EURAUD to find buyers at current market price?EURAUD - 24h expiry
The selloff is close to an exhaustion count on the intraday chart.
We expect a reversal in this move.
Risk/Reward would be poor to call a buy from current levels.
A move through 1.7650 will confirm the bullish momentum.
The measured move target is 1.7800.
We look to Buy at 1.7600 (stop at 1.7525)
Our profit targets will be 1.7750 and 1.7800
Resistance: 1.7650 / 1.7700 / 1.7750
Support: 1.7600 / 1.7550 / 1.7525
Risk Disclaimer
The trade ideas beyond this page are for informational purposes only and do not constitute investment advice or a solicitation to trade. This information is provided by Signal Centre, a third-party unaffiliated with OANDA, and is intended for general circulation only. OANDA does not guarantee the accuracy of this information and assumes no responsibilities for the information provided by the third party. The information does not take into account the specific investment objectives, financial situation, or particular needs of any particular person. You should take into account your specific investment objectives, financial situation, and particular needs before making a commitment to trade, including seeking, under a separate engagement, as you deem fit.
You accept that you assume all risks in independently viewing the contents and selecting a chosen strategy.
Where the research is distributed in Singapore to a person who is not an Accredited Investor, Expert Investor or an Institutional Investor, Oanda Asia Pacific Pte Ltd (“OAP“) accepts legal responsibility for the contents of the report to such persons only to the extent required by law. Singapore customers should contact OAP at 6579 8289 for matters arising from, or in connection with, the information/research distributed.
D-AUD

Potential bearish drop?EUR/AUD has rejected off the resistance level which is an overlap resistance and could drop from this level to our take profit.
Entry: 1.77581
Why we like it:
There is an overlap resistance level.
Stop loss: 1.78593
Why we like it:
There is a pullback resistance level.
Take profit: 1.75795
Why we like it:
There is a multi-swing low support level.
Enjoying your TradingView experience? Review us!
Please be advised that the information presented on TradingView is provided to Vantage (‘Vantage Global Limited’, ‘we’) by a third-party provider (‘Everest Fortune Group’). Please be reminded that you are solely responsible for the trading decisions on your account. There is a very high degree of risk involved in trading. Any information and/or content is intended entirely for research, educational and informational purposes only and does not constitute investment or consultation advice or investment strategy. The information is not tailored to the investment needs of any specific person and therefore does not involve a consideration of any of the investment objectives, financial situation or needs of any viewer that may receive it. Kindly also note that past performance is not a reliable indicator of future results. Actual results may differ materially from those anticipated in forward-looking or past performance statements. We assume no liability as to the accuracy or completeness of any of the information and/or content provided herein and the Company cannot be held responsible for any omission, mistake nor for any loss or damage including without limitation to any loss of profit which may arise from reliance on any information supplied by Everest Fortune Group.

Bullish rise?Aussie (AUD/USD) has bounced off the pivot and could potentially rise to the swing high resistance.
Pivot: 0.6537
1st Support: 0.6509
1st Resistance: 0.6611
Disclaimer:
The opinions given above constitute general market commentary and do not constitute the opinion or advice of IC Markets or any form of personal or investment advice.
Any opinions, news, research, analyses, prices, other information, or links to third-party sites contained on this website are provided on an "as-is" basis, are intended to be informative only, and are not advice, a recommendation, research, a record of our trading prices, an offer of, or solicitation for, a transaction in any financial instrument and thus should not be treated as such. The information provided does not involve any specific investment objectives, financial situation, or needs of any specific person who may receive it. Please be aware that past performance is not a reliable indicator of future performance and/or results. Past performance or forward-looking scenarios based upon the reasonable beliefs of the third-party provider are not a guarantee of future performance. Actual results may differ materially from those anticipated in forward-looking or past performance statements. IC Markets makes no representation or warranty and assumes no liability as to the accuracy or completeness of the information provided, nor any loss arising from any investment based on a recommendation, forecast, or any information supplied by any third party.

Hassett Fed Rumors Hit USD; AUDUSD Set for Bounce!!Hey Traders,
In today’s trading session we’re monitoring AUDUSD for a potential buying opportunity around the 0.65900 zone. The pair remains in a well-defined uptrend, and the ongoing correction is guiding price back toward a key support-and-trendline confluence, where buyers have repeatedly stepped in.
On the fundamental front, USD sentiment is shifting fast.
It’s now almost certain that Kevin Hassett will become the next FED Chair.
Trump hasn’t made the announcement official, but the internal signals are clear: the decision looks essentially locked in.
And the market knows exactly what that means:
Hassett is the most dovish option on the table
He will push to lower interest rates aggressively next year
This is bearish USD, supportive for commodities, and bullish AUDUSD
With the dollar turning softer into a dovish-policy outlook, AUDUSD’s pullback into 0.65900 could offer a clean continuation setup.
Trade safe, Joe.

Bullish bounce off key support?EUR/AUD is falling towards the support level, which is a multi-swing low support that aligns with the 61.8% Fibonacci projection and could bounce from this level to our take profit.
Entry: 1.7579
Why we like it:
There is a multi-swing low support that aligns with the 61.85 Fibonacci projection.
Stop loss: 1.7475
Why we like it:
There is a pullback support level that aligns with the 100% Fibonacci projection.
Take profit: 1.7758
Why we like it:
There is an overlap resistance level.
Enjoying your TradingView experience? Review us!
Please be advised that the information presented on TradingView is provided to Vantage (‘Vantage Global Limited’, ‘we’) by a third-party provider (‘Everest Fortune Group’). Please be reminded that you are solely responsible for the trading decisions on your account. There is a very high degree of risk involved in trading. Any information and/or content is intended entirely for research, educational and informational purposes only and does not constitute investment or consultation advice or investment strategy. The information is not tailored to the investment needs of any specific person and therefore does not involve a consideration of any of the investment objectives, financial situation or needs of any viewer that may receive it. Kindly also note that past performance is not a reliable indicator of future results. Actual results may differ materially from those anticipated in forward-looking or past performance statements. We assume no liability as to the accuracy or completeness of any of the information and/or content provided herein and the Company cannot be held responsible for any omission, mistake nor for any loss or damage including without limitation to any loss of profit which may arise from reliance on any information supplied by Everest Fortune Group.

EURAUD: Short After Break!Next week we are going to have important news for AUSSIE. If it aligns with our analysis, we will short the pair after breaking below the PURPLE level of 1.7550!
Regarding the EQUAL daily levels, we have seen a great reaction and wait for more bearish moves!
This is a great ZONE we are facing now!
We see that the last bearish move was considerably STRONG!
We expect a break below the zone; I'll put my orders then!

Dollar sinks as Hassett odds surge | FX ResearchThe dollar index is sliding to its weakest level since late October as markets increasingly price in Kevin Hasset, now seen with roughly 85 percent odds as the next Fed chair following President Trump’s public signaling, a development expected to weigh on the dollar, steepen the curve, and support risk assets.
Aussie dollar is also pushing higher after RBA Governor Bullock struck a hawkish tone, warning that firming inflation pressures may require a policy response even as Australia’s softer than expected Q3 GDP headline masks stronger domestic demand and a sharp rebound in business investment. Swiss inflation surprised slightly to the downside, with core CPI at its lowest since 2021, though the data is unlikely to shift SNB policy expectations.
Ahead today, US markets turn to the ADP employment report and ISM services for directional cues, while comments from ECB President Lagarde and the BOE’s Mann will round out the central bank narrative.
Exclusive FX research from LMAX Group Market Strategist, Joel Kruger

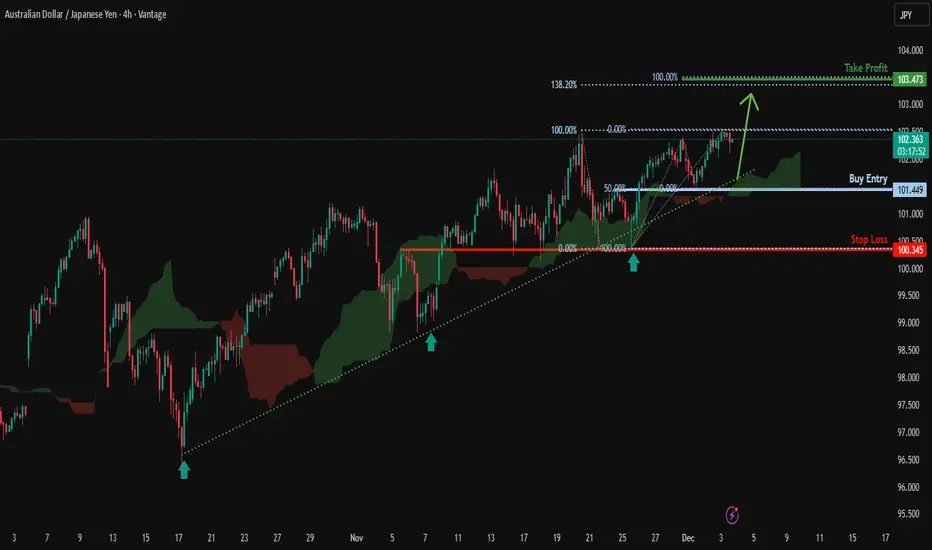
Bullish momentum to extend?AUD/JPY has bounced off the support level, which is a pullback support that aligns with the 50% Fibonacci retracement and could rise from this level to our take profit.
Entry: 101.44
Why we like it:
There is a pullback support level that aligns with the 50% Fibonacci retracement.
Stop loss: 100.34
Why we lik eit:
There is an overlap support level.
Take profit: 103.47
Why we like it:
There is a resistance level that aligns with the 138.2% Fibonacci extension and the 100% Fibonacci projection.
Enjoying your TradingView experience? Review us!
Please be advised that the information presented on TradingView is provided to Vantage (‘Vantage Global Limited’, ‘we’) by a third-party provider (‘Everest Fortune Group’). Please be reminded that you are solely responsible for the trading decisions on your account. There is a very high degree of risk involved in trading. Any information and/or content is intended entirely for research, educational and informational purposes only and does not constitute investment or consultation advice or investment strategy. The information is not tailored to the investment needs of any specific person and therefore does not involve a consideration of any of the investment objectives, financial situation or needs of any viewer that may receive it. Kindly also note that past performance is not a reliable indicator of future results. Actual results may differ materially from those anticipated in forward-looking or past performance statements. We assume no liability as to the accuracy or completeness of any of the information and/or content provided herein and the Company cannot be held responsible for any omission, mistake nor for any loss or damage including without limitation to any loss of profit which may arise from reliance on any information supplied by Everest Fortune Group.
Bullish momentum to extend?AUD/USD has bounced off the support level, which is a pullback support, and could rise from this level to our target profit.
Entry: 0.6538
Why we like it:
There is a pullback support level.
Stop loss: 0.6502
Why we like it:
There is a pullback support level.
Take profit: 0.6612
Why we like it:
There is a swing high resistance level.
Enjoying your TradingView experience? Review us!
Please be advised that the information presented on TradingView is provided to Vantage (‘Vantage Global Limited’, ‘we’) by a third-party provider (‘Everest Fortune Group’). Please be reminded that you are solely responsible for the trading decisions on your account. There is a very high degree of risk involved in trading. Any information and/or content is intended entirely for research, educational and informational purposes only and does not constitute investment or consultation advice or investment strategy. The information is not tailored to the investment needs of any specific person and therefore does not involve a consideration of any of the investment objectives, financial situation or needs of any viewer that may receive it. Kindly also note that past performance is not a reliable indicator of future results. Actual results may differ materially from those anticipated in forward-looking or past performance statements. We assume no liability as to the accuracy or completeness of any of the information and/or content provided herein and the Company cannot be held responsible for any omission, mistake nor for any loss or damage including without limitation to any loss of profit which may arise from reliance on any information supplied by Everest Fortune Group.

euraud looking bearish consolidation broken towards downside, as long as its below horizontal and trend line it can give 150 pips bearish rally

Bullish bounce off?AUD/JPY has bounced off the support level, which is a pullback support that aligns with the 38.2% Fibonacci retracement and could potentially rise from this level to our take profit.
Entry: 101.44
Why we like it:
There is a pullback support that aligns with the 38/2% Fibonacci retracement.
Stop loss: 100.34
Why we like it:
There is an overlap support level.
Take profit: 103.47
Why we like it:
There is a resistance level at the 138.2% Fibonacci extension and the 100% Fibonacci projection.
Enjoying your TradingView experience? Review us!
Please be advised that the information presented on TradingView is provided to Vantage (‘Vantage Global Limited’, ‘we’) by a third-party provider (‘Everest Fortune Group’). Please be reminded that you are solely responsible for the trading decisions on your account. There is a very high degree of risk involved in trading. Any information and/or content is intended entirely for research, educational and informational purposes only and does not constitute investment or consultation advice or investment strategy. The information is not tailored to the investment needs of any specific person and therefore does not involve a consideration of any of the investment objectives, financial situation or needs of any viewer that may receive it. Kindly also note that past performance is not a reliable indicator of future results. Actual results may differ materially from those anticipated in forward-looking or past performance statements. We assume no liability as to the accuracy or completeness of any of the information and/or content provided herein and the Company cannot be held responsible for any omission, mistake nor for any loss or damage including without limitation to any loss of profit which may arise from reliance on any information supplied by Everest Fortune Group.

AUDUSD H4 | Bearish Reversal Off 61.8% Fibonacci ResistanceMomentum: Bearish
The price is rising toward the sell entry, which aligns with the 61.8% Fibonacci retracement.
Sell entry: 0.6516
Strong overlap resistance
61.8% Fibonacci retracement
Stop loss: 0.6537
Pullback resistance
Slightly below the 78.6% Fibonacci retracement.
Take profit: 0.6465
Overlap support
High Risk Investment Warning
Stratos Markets Limited (tradu.com ), Stratos Europe Ltd (tradu.com ):
CFDs are complex instruments and come with a high risk of losing money rapidly due to leverage. 70% of retail investor accounts lose money when trading CFDs with this provider. You should consider whether you understand how CFDs work and whether you can afford to take the high risk of losing your money.
Stratos Global LLC (tradu.com ): Losses can exceed deposits.
Please be advised that the information presented on TradingView is provided to Tradu (‘Company’, ‘we’) by a third-party provider (‘TFA Global Pte Ltd’). Please be reminded that you are solely responsible for the trading decisions on your account. Any information and/or content is intended entirely for research, educational and informational purposes only and does not constitute investment or consultation advice or investment strategy. The information is not tailored to the investment needs of any specific person and therefore does not involve a consideration of any of the investment objectives, financial situation or needs of any viewer that may receive it. Past performance is not a reliable indicator of future results. Actual results may differ materially from those anticipated in forward-looking or past performance statements. We assume no liability as to the accuracy or completeness of any of the information and/or content provided herein and the Company cannot be held responsible for any omission, mistake nor for any loss or damage including without limitation to any loss of profit which may arise from reliance on any information supplied by TFA Global Pte Ltd.

AUDUSD Breakout and Potential RetraceHey Traders, in the coming week we are monitoring AUDUSD for a buying opportunity around 0.65400 zone, AUDUSD was trading in a downtrend and successfully managed to break it out. Currently is in a correction phase in which it is approaching the retrace area at 0.65400 support and resistance area.
Trade safe, Joe.

GBPAUD ShortHello everyone, I just saw the good idea that can be taken in consideration. A smooth downtrend for GBPAUD which will likely will make a low to around level of 2.00.

#043: Long Investment Opportunity on AUD/NZD
The AUD/NZD pair is approaching a key phase in which both structural price dynamics and macroeconomic forces are beginning to significantly align. After several sessions of downward pressure, the pair has found stability near a historically responsive demand zone, from which buyers have begun to show the first signs of interest. Recent candlesticks highlight a slowdown in bearish momentum, with wicks suggesting absorption and renewed buyer participation.
From a macroeconomic perspective, the pair remains supported by the evolving divergence between the Reserve Bank of Australia (RBA) and the Reserve Bank of New Zealand (RBNZ). Hello, I'm Forex Trader Andrea Russo, author of the book "The Institutional Code of Forex, 14 Steps to Read the Markets Like a Bank," available on Amazon. I'm an independent trader and money manager, and I thank you in advance for your time.
Australia continues to experience persistent inflationary pressures, with the latest Consumer Price Index (CPI) release coming in higher than expected. This reduces the likelihood of short-term rate cuts and keeps the RBA relatively firmer than other central banks in the region.
On the other hand, New Zealand is signaling increasing openness to monetary easing in the coming months, as domestic economic indicators weaken. This policy divide—aggressive stability versus dovish bias—naturally creates underlying upside pressure on the AUD/NZD in the medium term.
Market sentiment reinforces this structural trend. Retail positioning is heavily skewed toward the short side according to leading sentiment indicators, a pattern that historically tends to fuel a continuation scenario in the opposite direction. Inflows into AUD-linked assets also remain stable, with commodity currencies benefiting from the recalibration of global risk.
Technically, the pair is at the lower end of its recent multi-day range. This area is repeatedly shaken as a pocket of liquidity where institutional traders accumulate positions ahead of directional expansions. If the pair holds current support levels, the next structural target will be near the medium-range equilibrium, with further upside potential if market conditions continue to favor the Australian dollar.
Traders monitoring the AUD/NZD may find this juncture particularly relevant, as macroeconomic alignment, sentiment imbalance, and technical positioning converge. As always, volatility should be monitored closely, especially around upcoming data releases from Australia and New Zealand, which could provide further catalysts for a directional move.

Multi swing high resistance ahead?AUD/CAD is rising towards the resistance level, which is a multi swing high resistance and could reverse from this level to our take profit.
Entry: 0.91961
Why we like it:
There is a multi-swing high resistance
Stop loss: 0.92483
Why we like it:
There is a resistance level at the 127.2% Fibonacci extension.
Take profit: 0.91181
Why we like it:
There is a pullback support level.
Enjoying your TradingView experience? Review us!
Please be advised that the information presented on TradingView is provided to Vantage (‘Vantage Global Limited’, ‘we’) by a third-party provider (‘Everest Fortune Group’). Please be reminded that you are solely responsible for the trading decisions on your account. There is a very high degree of risk involved in trading. Any information and/or content is intended entirely for research, educational and informational purposes only and does not constitute investment or consultation advice or investment strategy. The information is not tailored to the investment needs of any specific person and therefore does not involve a consideration of any of the investment objectives, financial situation or needs of any viewer that may receive it. Kindly also note that past performance is not a reliable indicator of future results. Actual results may differ materially from those anticipated in forward-looking or past performance statements. We assume no liability as to the accuracy or completeness of any of the information and/or content provided herein and the Company cannot be held responsible for any omission, mistake nor for any loss or damage including without limitation to any loss of profit which may arise from reliance on any information supplied by Everest Fortune Group.

GBPAUD | Long ideaGBPAUD tested this support level at 2.026. Looking for a retest here and a move to the upside.
GBPAUD has been climbing up the past month which is part of my bullish bias.
Let me know what you think!
Stay safe out there and do your own due diligence, this is not investment advise!

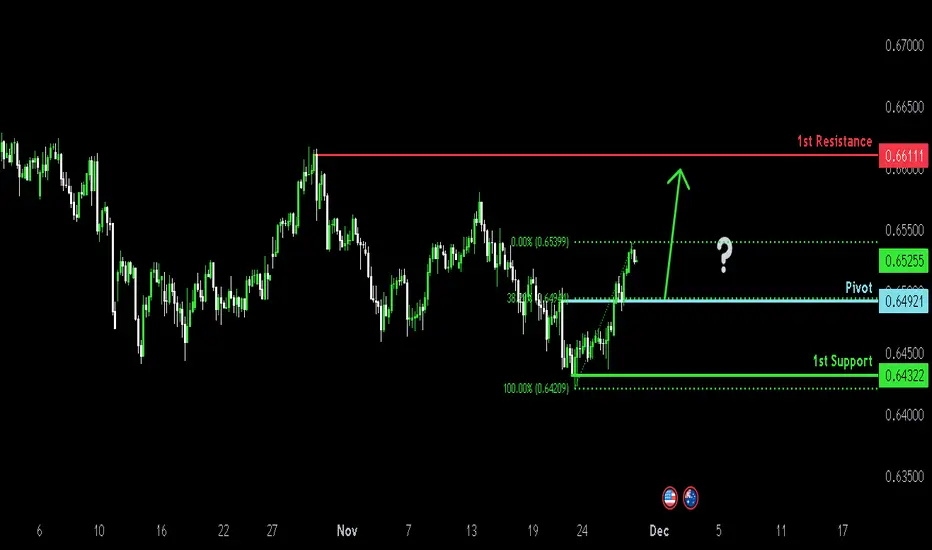
Falling towards 38.2% Fibonacci support?Aussie (AUD/USD) is falling towards the pivot, which acts as a pullback support and could bounce to the 1st resistance.
Pivot: 0.6492
1st Support: 0.6432
1st Resistance: 0.6611
Disclaimer:
The opinions given above constitute general market commentary and do not constitute the opinion or advice of IC Markets or any form of personal or investment advice.
Any opinions, news, research, analyses, prices, other information, or links to third-party sites contained on this website are provided on an "as-is" basis, are intended to be informative only, and are not advice, a recommendation, research, a record of our trading prices, an offer of, or solicitation for, a transaction in any financial instrument and thus should not be treated as such. The information provided does not involve any specific investment objectives, financial situation, or needs of any specific person who may receive it. Please be aware that past performance is not a reliable indicator of future performance and/or results. Past performance or forward-looking scenarios based upon the reasonable beliefs of the third-party provider are not a guarantee of future performance. Actual results may differ materially from those anticipated in forward-looking or past performance statements. IC Markets makes no representation or warranty and assumes no liability as to the accuracy or completeness of the information provided, nor any loss arising from any investment based on a recommendation, forecast, or any information supplied by any third party.
AUDJPYHello Traders,
We are waiting for a confirmation from CPI news! Any big surprise means we should not trade against it!
This is out Daily Chart!
A bullish chart it really is!
We are searching for middle of the channel to react!
The trend-line could be used as Liquidity hunt!


AUDUSD H4 | Bearish Reversal Off 38.2% Fibonacci ResistanceMomentum: Bearish
Price is retracing upward toward the sell entry, which sits at a pullback resistance level that aligns well with the 38.2% Fibonacci retracement.
Sell Entry: 0.6475
Pullback resistance
38.2% Fibonacci retracement
Stop Loss: 0.6516
Overlap resistance
61.8% Fibonacci retracement
Take Profit: 0.6389
Swing low support
61.8% Fibonacci extension
High Risk Investment Warning
Stratos Markets Limited (tradu.com ), Stratos Europe Ltd (tradu.com ):
CFDs are complex instruments and come with a high risk of losing money rapidly due to leverage. 70% of retail investor accounts lose money when trading CFDs with this provider. You should consider whether you understand how CFDs work and whether you can afford to take the high risk of losing your money.
Stratos Global LLC (tradu.com ): Losses can exceed deposits.
Please be advised that the information presented on TradingView is provided to Tradu (‘Company’, ‘we’) by a third-party provider (‘TFA Global Pte Ltd’). Please be reminded that you are solely responsible for the trading decisions on your account. Any information and/or content is intended entirely for research, educational and informational purposes only and does not constitute investment or consultation advice or investment strategy. The information is not tailored to the investment needs of any specific person and therefore does not involve a consideration of any of the investment objectives, financial situation or needs of any viewer that may receive it. Past performance is not a reliable indicator of future results. Actual results may differ materially from those anticipated in forward-looking or past performance statements. We assume no liability as to the accuracy or completeness of any of the information and/or content provided herein and the Company cannot be held responsible for any omission, mistake nor for any loss or damage including without limitation to any loss of profit which may arise from reliance on any information supplied by TFA Global Pte Ltd.

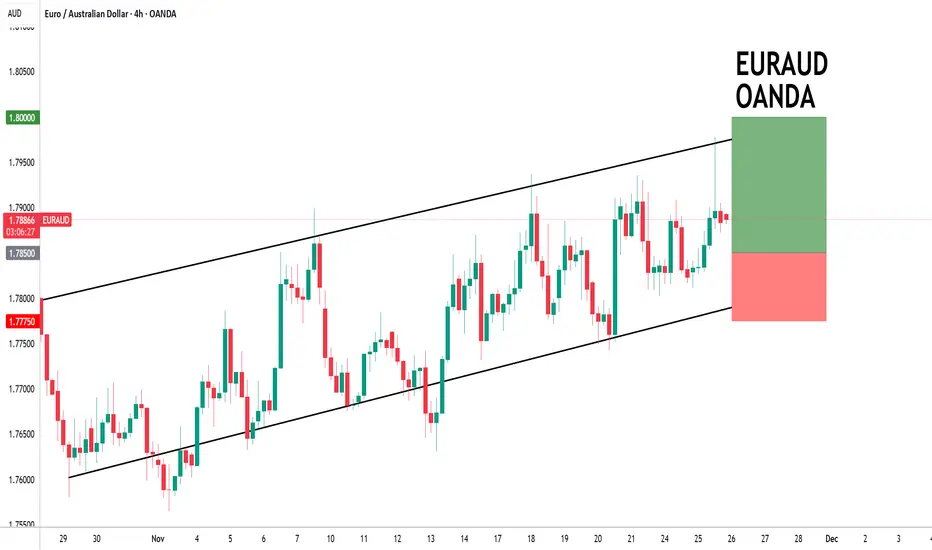
EURAUD to continue in the upward channel?EURAUD - 24h expiry
Indecisive price action has resulted in sideways congestion on the intraday chart.
Pivot support is at 1.7700.
Risk/Reward would be poor to call a buy from current levels.
A move through 1.7900 will confirm the bullish momentum.
The measured move target is 1.8025.
Our profit targets will be 1.8000 and 1.8025
Resistance: 1.7900 / 1.7950 / 1.8000
Support: 1.7850 / 1.7800 / 1.7775
Risk Disclaimer
The trade ideas beyond this page are for informational purposes only and do not constitute investment advice or a solicitation to trade. This information is provided by Signal Centre, a third-party unaffiliated with OANDA, and is intended for general circulation only. OANDA does not guarantee the accuracy of this information and assumes no responsibilities for the information provided by the third party. The information does not take into account the specific investment objectives, financial situation, or particular needs of any particular person. You should take into account your specific investment objectives, financial situation, and particular needs before making a commitment to trade, including seeking, under a separate engagement, as you deem fit.
You accept that you assume all risks in independently viewing the contents and selecting a chosen strategy.
Where the research is distributed in Singapore to a person who is not an Accredited Investor, Expert Investor or an Institutional Investor, Oanda Asia Pacific Pte Ltd (“OAP“) accepts legal responsibility for the contents of the report to such persons only to the extent required by law. Singapore customers should contact OAP at 6579 8289 for matters arising from, or in connection with, the information/research distributed.
#042: Long Investment Opportunity on AUD/CAD
The Australian dollar/Canadian dollar pair is moving within a broad compression phase that has been developing for several sessions. Hello, I'm Forex Trader Andrea Russo, author of the book "The Institutional Code of Forex, 14 Steps to Read the Markets Like a Bank," available on Amazon. I'm an independent trader and money manager, and I thank you in advance for your time.
This structure has created a clear area of inefficiency just below the current market, while liquidity remains relatively flat and concentrated around the most recent lows.
From a technical perspective, the pair is reacting after a prolonged period of downside pressure, forming a sequence of higher rejection wicks near a key support region. This behavior suggests that short-side exhaustion is beginning to emerge. The market is no longer making momentum-driven lows and is instead moving toward a classic accumulation pattern, often observed before a corrective upside expansion.
Intermarket flows also support this interpretation. The Australian dollar is beginning to stabilize after a period of weakness triggered by commodity repricing and the reprioritization of macroeconomic priorities. Meanwhile, the Canadian dollar is showing signs of deceleration, partly influenced by the weaker tone of energy markets. The combination of a stabilizing AUD and a slower CAD creates a favorable environment for a bullish retracement on this cross.
Volatility conditions remain moderate, and the recovery in short-term momentum indicators is consistent with the idea that the pair may attempt a rotation toward the middle range of the broader structure. The pair is currently near the lower limit of this range, making the risk-reward profile more attractive for a controlled long position, especially for traders seeking to anticipate institutional accumulation rather than chasing breakout moves.
Price action offers an initial reversal signal, supported by a sharper rejection from discounted levels. If the market maintains this behavior and continues to respect the support zone it has repeatedly defended, a bullish continuation toward upper liquidity pockets becomes the most consistent scenario.
In summary, AUDCAD represents a strategic opportunity for bullish exposure within a controlled and well-defined structure. The pair is showing the first signs of accumulation, improving sentiment dynamics, and an intermarket environment favoring an upward correction. This configuration is consistent with an institutional approach that favors discounted entries, asymmetric risk, and positioning relative to the retail sentiment curve.
