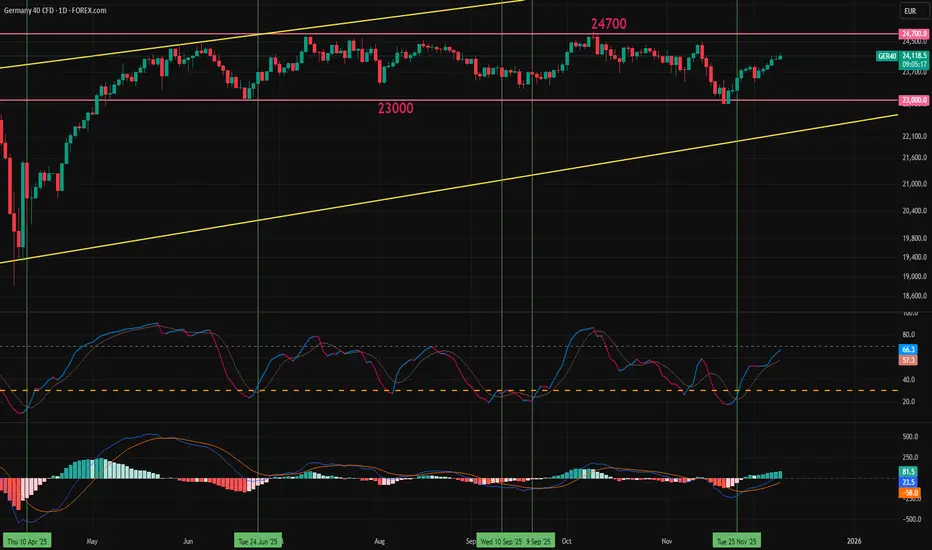
DAX potentially gearing up for a big breakout soonWith all major risk events now out of the way for the year, can we finally see the German DAX come out of its multi month consolidation in the days ahead? Recent price action has been bullish, albeit inside a wide consolidation range. But the downside has been limited and that gives the bulls the confidence needed to stick around and await a potential breakout in the coming weeks. The lengthy consolidation near record highs is usually a positive sign as it shown the buying pressure is building while the sellers haven't made any major ground. But rather than pre-empting it, let's wait for a clean breakout first, so this is one to watch for the holiday period and into early parts of 2026.
Germany's record fiscal spending is likely to give Europe's largest economy a major boost, which could then lead to further stock market gains. Well that is the hope anyway.
Key levels highlighted on the chart.
By Fawad Razaqzada, market analyst with FOREX.com
D-DAX

EURUSD – 1-Hour Timeframe Tradertilki AnalysisMy friends, greetings,
I have prepared an EURUSD analysis for you.
My friends, if EURUSD manages to close a candle above the levels of 1.17632-1.17460, I will open a buy position. Immediately after that, I will update here in the trade active section to inform you where I opened the buy position and share the target level.
My friends, I share these analyses thanks to each like I receive from you. Your likes increase my motivation and encourage me to support you in this way.🙏✨
Thank you to all my friends who support me with their likes.❤️

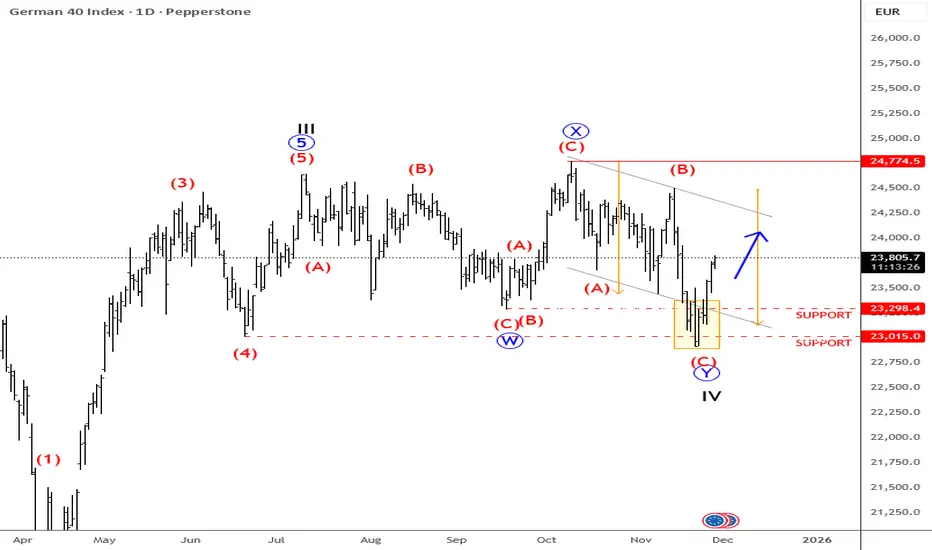
DAX Rebound Signals Potential Upside After Key Support HoldGerman DAX was very non-directional, basically since June of 2025 and what I see is some very nasty moves on both sides of the market, but what got our attention recently is that the price has stopped at key support levels around 23k to 23300 area, from where we can see a very interesting and strong rebound. What is most important is that this rebound is coming after only three waves down from all-time highs, so it can be part of a WXY complex correction here in a fourth wave on a daily chart. Of course there can be some other labelings as well, but with any approach you will probably come out with the same idea that this whole price action in this five to six month range is corrective, and whenever we see a correction we know that sooner or later it should be fully retraced, meaning the price could already be headed back toward the highs from current levels.
Bounce looks impulsive, and it may have formed a bullish setup formation with waves 1 and 2, so we think that more gains are coming within wave 3, especially if breaks back above 24500 bullish confirmation level.

DAX Just confirmed the start of a very strong Bear Cycle.DAX (DE40) has been practically trading sideways since June 2025, a fair range on short-term time-frames but a tight one on long-term ones such as the 1M (monthly) that we are looking at today.
We posted this chart 2 months ago warning of a potential multi-year Top for the market's 16-year Channel Up (this time we view it on 1M instead on 1W) and only last month, it hit its 1W MA50 (blue trend-line) for the first time since the April low.
We don't need to mention again the specifics of this pattern's cyclical behavior, such as why Phase 3 seems to have already topped due to hitting the 1.618 and 2.236 Fibonacci extensions on two different measurements. Those where analyzed extensively on the previous publication.
But what we do want to bring to you is that the 1M RSI has been trading downwards since hitting its 80.00 Resistance, a level that was last tested in 2007! This is a clear Bearish Divergence on a wide scale and couple with the fact that the 1M MACD just completed a Bearish Cross, all the basic conditions for a Cycle Top have been met. As you can see, since the 2008 U.S. Housing Crisis, every 1M MACD Bearish Cross was formed on a market Top and signaled an aggressive correction.
As a result, we expect 2026 to be a Bear Cycle, and Phase 4 historically has corrected to at least the 0.382 Fibonacci retracement level, while also hitting the 1W MA200 (orange trend-line). Our 18800 long-term Target fulfills both conditions. Notice also that the 1M RSI has a 14-year Support trend-line as well at 39.00. If this gets hit, it is historically the most optimal signal to buy for the long-term regardless of the price the market will be at the moment.
---
** Please LIKE 👍, FOLLOW ✅, SHARE 🙌 and COMMENT ✍ if you enjoy this idea! Also share your ideas and charts in the comments section below! This is best way to keep it relevant, support us, keep the content here free and allow the idea to reach as many people as possible. **
---
💸💸💸💸💸💸
👇 👇 👇 👇 👇 👇

DAX BULLISH BIAS|LONG|
✅DAX has broken above the descending trendline with strong displacement, signaling a shift in market structure. A continuation move is favored as liquidity builds above recent highs. Time Frame 5H.
LONG🚀
✅Like and subscribe to never miss a new idea!✅

GER40 Pullback Is Not a Reversal (Here’s Why)GER40 did not react at the 0.7–0.8 retracement of the previous bearish leg, indicating underlying strength. Price has since formed equal highs (EQH), which now serve as a logical liquidity target for the next upside move.
I expect a brief manipulation or pullback early in the week, followed by bullish expansion toward the 24,500 area.
I’ll share updates as the setup develops — follow for further analysis.

BMW - Cup And handlePattern: Cup and Handle
Occuracne: Bullish reversal
Age: 539 days
Pricetarget: 120,60

ALV - RectangleCompany name : Allianz SE
Pattern: Rectangle
Age: 7 months or 217 days
Occurance: Bullish continuation
Price target: 423 or 12%

DAX Hidden Sell Signal on this 4H Golden Cross?DAX (DE40) has been trading within a Channel Up (green) since its 1W MA50 (red trend-line) market bottom and yesterday it formed a 4H Golden Cross. That is technically a bullish pattern but in the past 5 months, every such formation (3 in total) has been an indication of a market Top, thus a bearish signal.
More specifically, the most it took for DAX to form a top after a 4H Golden Cross within this time-frame, has been 4 days. And as you can see it's also been similar Channel Up patterns that peaked after this Cross, on an identical Lower Highs trend-line like the one that the index is about to test.
What's even more striking is that every sell-off that followed the Tops was exactly -5.15%. Identical on all 3 occasions. As a result, it is possible for DAX to decline as low as 23050 following the upcoming top. Since however the 1W MA50 is involved this time as a Support, you may want to book profits there earlier, around 23300, if you see it acting as a Support with strong buying pressure.
---
** Please LIKE 👍, FOLLOW ✅, SHARE 🙌 and COMMENT ✍ if you enjoy this idea! Also share your ideas and charts in the comments section below! This is best way to keep it relevant, support us, keep the content here free and allow the idea to reach as many people as possible. **
---
💸💸💸💸💸💸
👇 👇 👇 👇 👇 👇

DAX Stuck in Sideways Grind, Year-End-Boost or Continued RangingThe DAX index has been moving sideways since May without any signs of a trend change. Weak German economic data, a struggling auto industry, ongoing Ukraine risks, and de-globalization moves from the US all limit the upside potential. However, with the new year approaching, incoming portfolio adjustments could provide a conservative boost to the index.
From the year start to the March top, the DAX rose more than 18% in a three-month period. After a big selloff and sharp recovery due to the April tariff announcement from Trump, returns from the start of the year reached over 23% by May. During this five-month period, the DAX positively diverged from the S&P 500, reaching above two standard deviations from the five-year average. Since then, the S&P 500 has continued to clinch gains while the DAX has been moving sideways in a 1,700-point-wide channel.
Germany's deep slump is expected to end in 2026, increasing GDP growth from 0.3% to 1% (market consensus). German CPI is expected to stay close to the 2% target like the rest of the EU, and lower ECB rates might give a conservative boost to investments. The changes are positive but not a significant boost for the DAX.
Now that the DAX/S&P 500 ratio has returned to its average, the correlation between the US stock market and the DAX might increase again. Currently, the relative momentum index (RMI) has generated a buy signal, similar to the MACD. Crossovers below “30” on the RMI and below “0” on the MACD usually provide decent bullish signals. However, the main focus will remain on the 24,700 resistance. Unless it is broken to the upside, the sideways move can be expected to continue.
Higher PMI, factory orders, and industrial production data have already shown a positive impact on the index, and post-COVID seasonality for December is historically bullish in December. The question is whether that will be enough to trigger a breakout.
GER40 Trade Idea: The Perfect Pullback Before Liftoff!I enjoy trading GER40, especially during the London session, where we consistently see a phase of manipulation followed by a clean move toward the target. At the moment, the structure is showing a similar pattern.
Although the HTF suggests a broader correction toward the 22,000 area, I’m looking for a short-term setup for next week.
My scenarios:
1) Primary scenario:
A move lower into the first Daily FVG, which is also visible on the 4H and 1H timeframes—confirming its validity. After a test of this zone and a liquidity grab around the 23,700 area, I expect price to move upward toward the 0.70–0.79 Fibonacci retracement, where I will look to take profit.
2) Alternative scenario (less likely):
A deeper correction into the second Daily FVG, which is only visible on the Daily timeframe. Due to its limited confluence, this scenario has lower probability.
Execution plan:
I’ll wait for price to trade into one of these FVGs, then look for LTF reversal signals to execute a long position targeting the 0.70–0.79 Fibonacci zone.
If you enjoy this type of analysis, make sure to follow and like this idea.

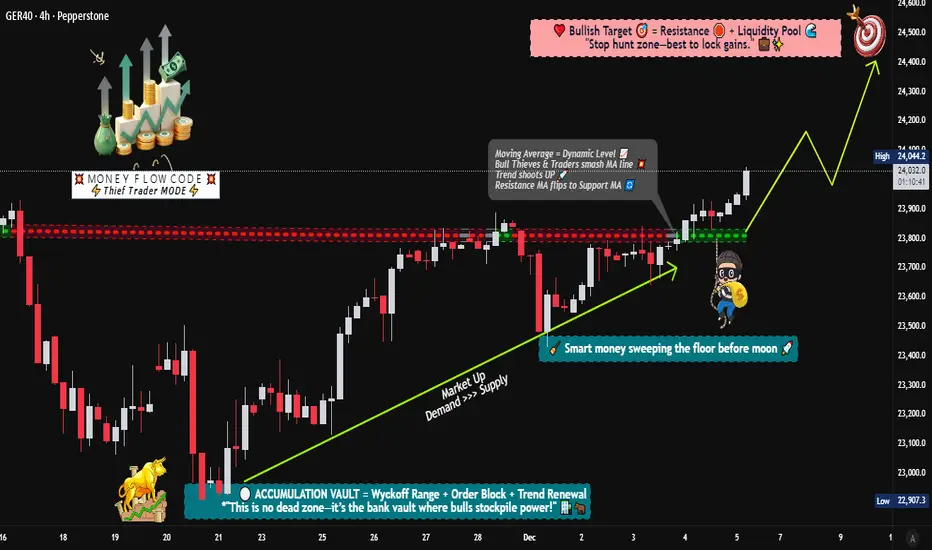
DAX40 Momentum Shift: Layered Buy Setup for Clean Profit Flow🚀 DAX40 (GER40) BULLISH BREAKOUT ALERT! | Layer Strategy for MAX Gains 🚀
📈 DAX40 BULLISH BREAKOUT CONFIRMED! 🏆 (Swing/Day Trade Setup with Layer Entry)
📊 Idea: Strong bullish momentum on the GER40 / DAX 40 following a decisive breakout above key moving averages! Perfect setup for a structured "thief-style" layered entry to capitalize on the trend.
🔑 KEY LEVELS & PLAN:
Trend: Bullish (MA Breakout Confirmation)
Entry Strategy: "Thief" Layer Method 🎯
Use multiple BUY LIMIT orders at key dips: 23,600 | 23,700 | 23,800 | 23,900 (Add more layers based on your capital).
This averages your entry and maximizes opportunity on pullbacks.
Stop Loss (SL): 23,400 (Thief OG's Zone ⚠️).
IMPORTANT NOTE: Adjust your SL based on YOUR risk tolerance & strategy! This is a guide, not financial advice. Protect your capital.
Take Profit (TP): Target Zone: 24,500 🎯
Strong resistance & potential overbought trap area. Secure profits wisely!
REMINDER: Manage your own TP. Take money at your own risk.
💎 PRO TRADER NOTES:
This "thief" layer strategy requires patience & discipline. Let the market come to your orders. Never risk more than 1-2% per layer. Trade with a plan, not emotion!
🌍 RELATED PAIRS TO WATCH (KEY CORRELATIONS):
FX:EURUSD : INVERSE Correlation. A stronger Euro can pressure DAX (export-heavy index). Watch for USD weakness supporting DAX rallies.
CAPITALCOM:US30 (Dow Jones) / SP:SPX (S&P 500): POSITIVE Correlation. US market strength often lifts European indices. Key for overall risk sentiment.
ICMARKETS:STOXX50 (Euro Stoxx 50): HIGH Correlation. Broader European index performance.
BUND Futures (/FGBL): INVERSE Correlation. Rising German bond yields (falling prices) can signal economic optimism, often supporting DAX.
EUR/GBP ( OANDA:EURGBP ): UK/EU economic relative strength flows.
👇 LIKE & FOLLOW if you found this useful!
💬 COMMENT your entry levels or chart insights below!
🔔 Click the BELL on my profile for real-time idea alerts!
#DAX #GER40 #TradingView #Breakout #Bullish #SwingTrading #DayTrading #LayerStrategy #TradingPlan #Forex #Indices #Investing #Stocks #ThiefStrategy #EURUSD
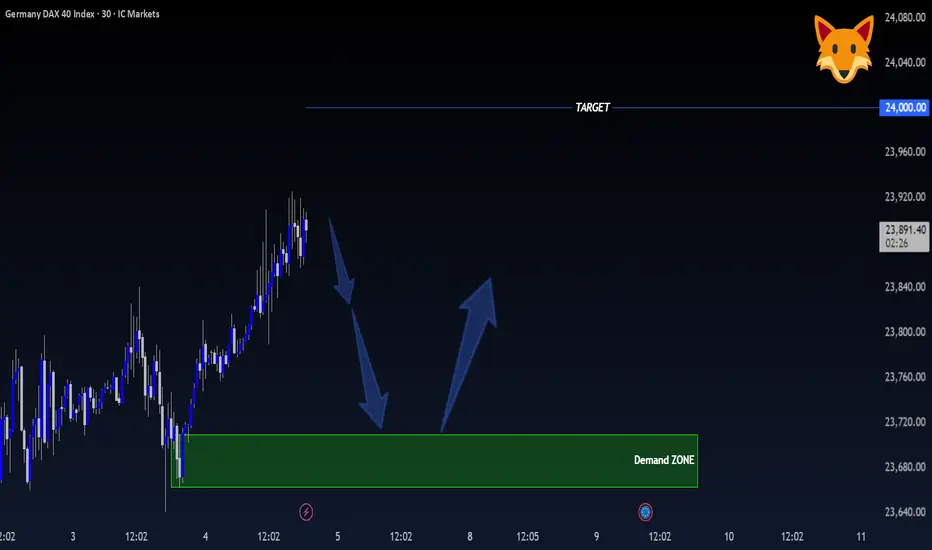
GER40 – 30-Minute Timeframe Tradertilki AnalysisGuys,
I have prepared a GER40 analysis for you.
On the 30-minute timeframe, if GER40 makes a pullback, I will open a buy position between 23,709 - 23,668.
My target will be the 24,000 level.
My friends, I share these analyses thanks to each like I receive from you.
Your likes increase my motivation and encourage me to support you in this way.🙏✨
Thank you to all my friends who support me with their likes.❤️
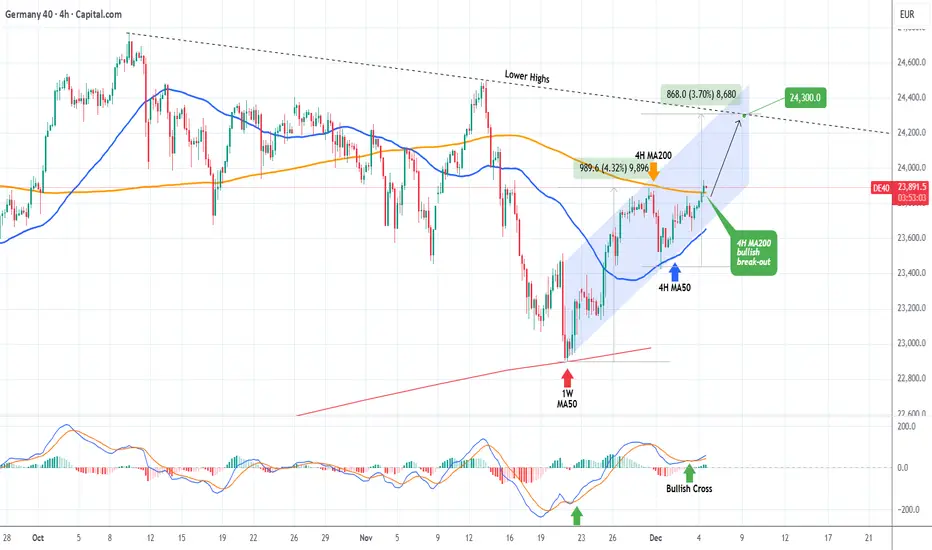
DAX Strong 4H break-out targeting 24300.DAX (DE40) has been trading within a Channel Up since the November 20 bottom on the 1W MA50 (red trend-line) and today it made a massive step upwards as it broke above its 4H MA200 (orange trend-line) for the first time in 3 weeks.
With the 4H MA50 (blue trend-line) established as the Support on the previous Higher Low, we expect this Bullish Leg to hit at least the 2-month Lower Highs trend-line at 24300.
---
** Please LIKE 👍, FOLLOW ✅, SHARE 🙌 and COMMENT ✍ if you enjoy this idea! Also share your ideas and charts in the comments section below! This is best way to keep it relevant, support us, keep the content here free and allow the idea to reach as many people as possible. **
---
💸💸💸💸💸💸
👇 👇 👇 👇 👇 👇
$DAX Move HigherDAX broke below the trendline on a false breakdown, before a close above the trendline, a re-test and hold. Looking for a move back to the above trendline at 24280 or so.

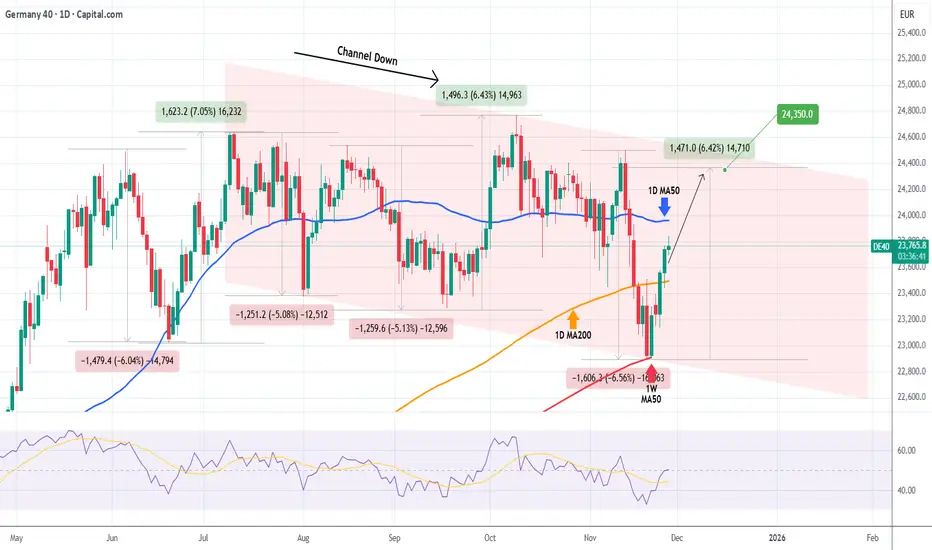
DAX This rally isn't over yet.DAX (DE40) has started a strong rebound following the 1W MA50 (red trend-line) test, as we showed last week. This week the price broke again above its 1D MA200 (orange trend-line) and is about to recover its 1D MA50 (blue trend-line) as well.
The latter has never posed as a Resistance in 2025, so we expect the price to break and continue above it without problems. However, given that the prevailing pattern right now is a Channel Down, the uptrend is limited to its top (Lower Highs trend-line).
With the previous Bullish Leg making a +6.43% rise, we expect a symmetric rise this time around to, thus targeting 24350 short-term.
---
** Please LIKE 👍, FOLLOW ✅, SHARE 🙌 and COMMENT ✍ if you enjoy this idea! Also share your ideas and charts in the comments section below! This is best way to keep it relevant, support us, keep the content here free and allow the idea to reach as many people as possible. **
---
💸💸💸💸💸💸
👇 👇 👇 👇 👇 👇
DAX: When Chopy Price Action Calls Next Clear Move German DAX was very non-directional, basically since June of 2025 and what I see is some very nasty moves on both sides of the market, but what got my attention recently is that the price has stopped at key support levels around 23k to 23300 area, from where we can see a very interesting and strong rebound.
What is most important is that this rebound is coming after only three waves down from all-time highs, so it can be part of a WXY complex correction here in a fourth wave. Of course there can be some other labelings as well, but with any approach you will probably come out with the same idea that this whole price action in this five to six month range is corrective, and whenever we see a correction we know that sooner or later it should be fully retraced, meaning the price could already be headed back toward the highs from current levels.
So I think that as long as we hold 23k, there can be some potential opportunities on intraday retracements on smaller time frames.
GH
$DAX dip to go longDAX moved as per plan since last week (). A nice re-test of the descending trendline and a 600 pts move higher. Probably a quiet trading day today but 23610 presents a good opportunity to go long off to 23970, confluence of algo levels.

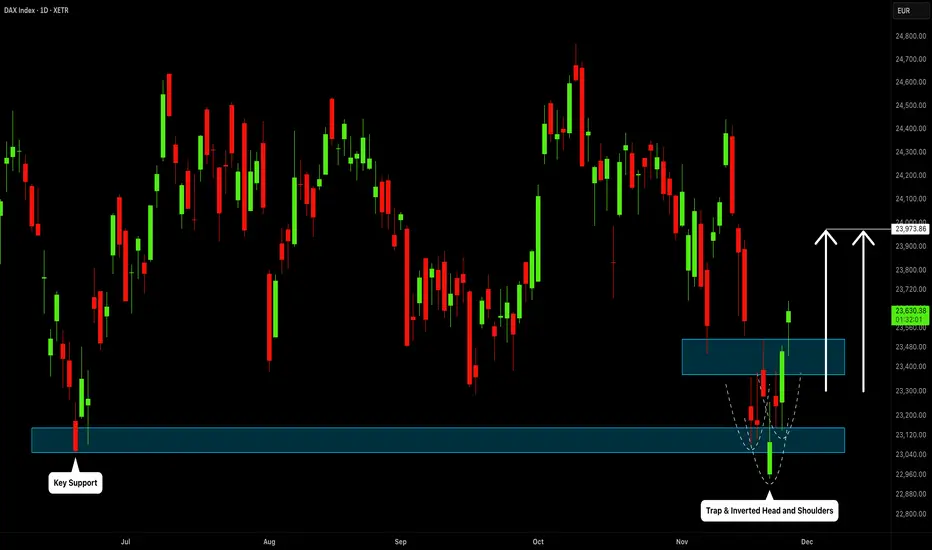
DAX INDEX: Finally Bullish?!
I see a confirmed bearish trap on DAX index
after a test of a key historic support.
An inverted head & shoulders pattern formation
and a bullish violation of its neckline provide strong
signal.
I expect a recovery at least to 24000 now.
❤️Please, support my work with like, thank you!❤️
Is the DAX Preparing for a Monster Rally? The Structure Says So.The DAX continues to follow a well-defined Elliott Wave structure across the higher time frames. Following the completion of Wave 1 at the prior cycle top, the subsequent corrective phase retraced efficiently into the 0.618 Fibonacci region, establishing a structurally sound Wave 2 low. Since then, price has progressed through a multi-year impulsive advance, with internal subdivisions aligning cleanly with higher-probability Fibonacci extensions.
Current price action is positioned within the latter stages of an extended Wave 3 sequence, where the 2.618 extension zone presents a significant confluence region for a potential medium-term top. A controlled corrective phase is expected thereafter, forming Wave 4 before the index resumes its structural bullish trajectory toward the projected Wave 5 completion.
This long-term framework remains valid as long as structural lows are preserved, with the broader trend supporting continued upside over the coming cycles.
⚠️ Disclaimer
This analysis is provided for educational purposes only and does not constitute financial advice. Trading financial markets involves risk, and you are solely responsible for your own investment decisions. Always conduct your own research and use proper risk management.
If you found this analysis valuable, leave a like, drop your thoughts in the comments, and follow for more structured market insights.

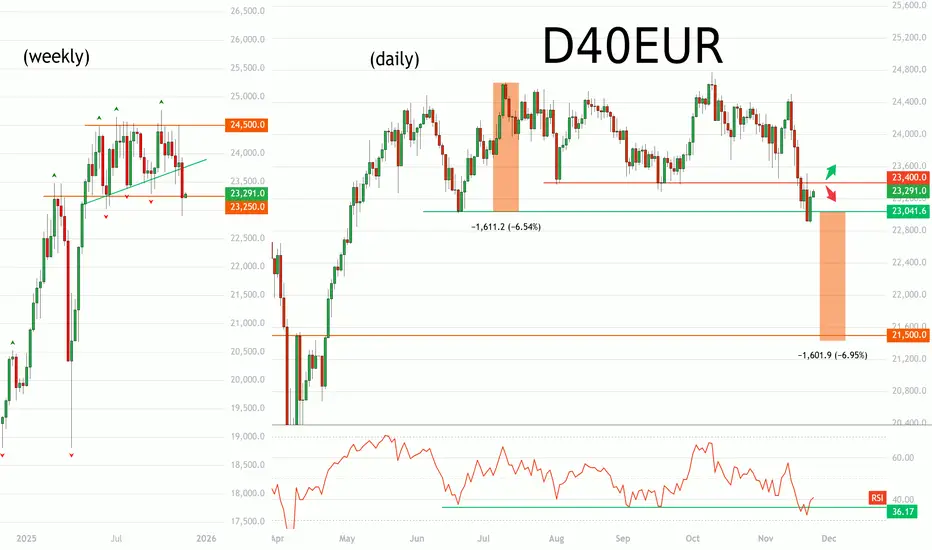
German stocks about to drop 7%? (DAX 40)Setup
Breakdown from horizontal range
Lowest weekly close since June
Breakdown below ‘green’ weekly trendline
RSI back at 35-40 support
Commentary
The DAX is sitting right on the support level of its long term range. The index could rally back into its range, offering reversal setups to go long, or it could continue to breakdown. Should it be the latter, projecting the height of the range lower would target 21500 - a demand area preceding the April rally.
Strategy
Option 2: Sell rebound towards 48,000 supply zone
Option 1: Sell the breakdown below 23,000
Dax Short Term Sell IdeaH1 - Strong bearish move.
No opposite signs.
Currently it looks like a pullback is happening.
Expecting bearish continuation until the two Fibonacci resistance zones hold.
If you enjoy this idea, don’t forget to LIKE 👍, FOLLOW ✅, SHARE 🙌, and COMMENT ✍! Drop your thoughts and charts below to keep the discussion going. Your support helps keep this content free and reach more people! 🚀
-------------------------------------------------------------------------------------------------------------------

DAX Will the 1W MA50 support once more?DAX (DE40) has been trading within a 3-year Channel Up, essentially for the entirety of its Bull Cycle, following the October 2022 bottom of the Inflation Crisis.
The most common Support, hence optimal long-term buy signal/ entry within this pattern, has been the 1W MA50 (blue trend-line), having been hit three times and providing on all instances massive rallies.
Every time that or the 1W MA100 (green trend-line) were hit, the rallies always hit the previous High/ Resistance 1 initially before either a consolidation or a slight pull-back.
As a result, if the market hits the 1W MA50 but manages to close the 1W candle above it, we expect the resulting rally to hit at least 24700 (Resistance 1).
Notice also that every long-term Bullish Leg was confirmed after the 1W RSI broke above its Lower Highs trend-line.
---
** Please LIKE 👍, FOLLOW ✅, SHARE 🙌 and COMMENT ✍ if you enjoy this idea! Also share your ideas and charts in the comments section below! This is best way to keep it relevant, support us, keep the content here free and allow the idea to reach as many people as possible. **
---
💸💸💸💸💸💸
👇 👇 👇 👇 👇 👇
