S&P500 INDEX (US500): Uptrend Continuation
US500 likely completed a correctional movement and will rise soon,
following a confirmed breakout of a resistance line of a bullish flag
pattern on a daily time frame.
Next goal wil be 7050.
❤️Please, support my work with like, thank you!❤️
I am part of Trade Nation's Influencer program and receive a monthly fee for using their TradingView charts in my analysis.
D-US30

US30 Trade Set Up Jan 27 2026Price has inverted a 4h FVG and is making LH/LL on the 1h so i will want to see some kind of pullback into a FVG followed by a 1m IFVG/CISD to continue towards PDL

US30 Will Move Lower! Sell!
Take a look at our analysis for US30.
Time Frame: 1h
Current Trend: Bearish
Sentiment: Overbought (based on 7-period RSI)
Forecast: Bearish
The market is approaching a significant resistance area 49,481.0.
Due to the fact that we see a positive bearish reaction from the underlined area, I strongly believe that sellers will manage to push the price all the way down to 49,076.8 level.
P.S
The term oversold refers to a condition where an asset has traded lower in price and has the potential for a price bounce.
Overbought refers to market scenarios where the instrument is traded considerably higher than its fair value. Overvaluation is caused by market sentiments when there is positive news.
Like and subscribe and comment my ideas if you enjoy them!

US30 Trade Set Up Jan 28 2026Price has swept London lows and is consolidating under a 4h FVG so i price can make internal bullish structure on the 1m-5m with a bullish IFVG/CISD i will take buys to BSL and higher 4h FVG or if price trades to PDL i will look for a buys set up from there

DowJones resistance at 49496 ahead of Fed decisionKey Support and Resistance Levels
Resistance Level 1: 49496
Resistance Level 2: 49800
Resistance Level 3: 50110
Support Level 1: 48700
Support Level 2: 48480
Support Level 3: 48320
This communication is for informational purposes only and should not be viewed as any form of recommendation as to a particular course of action or as investment advice. It is not intended as an offer or solicitation for the purchase or sale of any financial instrument or as an official confirmation of any transaction. Opinions, estimates and assumptions expressed herein are made as of the date of this communication and are subject to change without notice. This communication has been prepared based upon information, including market prices, data and other information, believed to be reliable; however, Trade Nation does not warrant its completeness or accuracy. All market prices and market data contained in or attached to this communication are indicative and subject to change without notice.

DOW JONES bearish short-term as long as this Resistance holds.Dow Jones (DJI) got rejected last week below the 1-month Resistance and that formed a Lower High on the 1H time-frame, establishing a Channel Down.
It appears that we are in the process of repeating a Bearish Leg highly symmetrical to the previous one. So far we have completed a -1.80% Stage 1 decline and after a rebound, the price dropped again below the 1H MA50 (blue trend-line) in a similar way as January 18-19. Observe how even the 1H RSI sequences between the two fractals are identical.
As long as this holds as Resistance, we expect Stage 2 of the Bearish Leg to hit the bottom of the Channel Down on the 1.618 Fibonacci extension (as the previous Bearish Leg) at 48250.
---
** Please LIKE 👍, FOLLOW ✅, SHARE 🙌 and COMMENT ✍ if you enjoy this idea! Also share your ideas and charts in the comments section below! This is best way to keep it relevant, support us, keep the content here free and allow the idea to reach as many people as possible. **
---
💸💸💸💸💸💸
👇 👇 👇 👇 👇 👇

US30 H1 | Bullish Bounce Off Overlap SupportBased on the H1 chart analysis, we can see that the price has bounced off our buy entry level at 48,897.36, which is an overlap support.
Our stop loss is set at 48,664.86, which is a pullback support level.
Our take profit is set at 49,263.62, which is a pullback resistance.

US30 Trade Set Up Jan 26 Price is making internal bullish structure but on the 4h its making bearish structure so i will expect price to test the 1h FVG and if it respects it with internal IFVG/CISD to the downside i will takes sells to Asia lows

US30 | Price Below Pivot as FOMC Risk BuildsUS30 | Event Risk Builds as Price Holds Below Pivot
Dow Jones futures remain under pressure as markets approach a heavy macro week dominated by the Federal Reserve rate decision, key U.S. earnings, and ongoing shifts in Treasury yields. With industrials and financials sensitive to policy guidance, any change in rate expectations could quickly impact US30 direction.
Recent price action shows consolidation below a key pivot zone, suggesting sellers remain in control unless buyers reclaim higher ground with strong confirmation.
Technical Outlook
The price has stabilized below the 49240 pivot area, maintaining a bearish structure.
As long as the index trades below 49240, downside pressure is expected toward 48840, followed by 48450.
A 4H close with volume stability above 49240 would invalidate the bearish bias and support a bullish recovery toward 49590 and 49960.
Key Levels
• Pivot: 49240
• Support: 48840 – 48450
• Resistance: 49590 – 49960

kvmev - EURJPY - 25/01/2026 - 30/01/2026Strong pullback on EJ, market structure is overall bullish creating HH's and is respecting the ascending trendline. Looking to take long positions upon strong rejection of zone below current price and trendline.

kvmev - GBPCHF FORECAST - 25/01/2026 - 30/01/2026*High risk trade*
Will wait for strong confirmation below support zone and clear rejection before taking sell position.
Price double top, failed to create HH & BoS, expecting price to drop unless fundamentals push it back up.

kvmev - EURNZD FORECAST - 25/01/2026 - 30/01/2026Clear head and shoulders pattern & closure below the current resistance zone above price.
Expecting a strong push to the downside.

kvmev - CADCHF FORECAST - 25/01/2026 - 30/01/2026Expecting a continuation to the downside following a retest of the zone above.

kvmev - USDCHF FORECAST - 25/01/2026 - 30/01/2026Expecting price to continue down following a retest of the resistance zone above.

US30 Rebound Ahead! Buy!
Hello,Traders!
US30 after a sharp bearish reaction from horizontal supply area above, price is likely to retest the demand zone to rebalance inefficiency before continuation upwards. Liquidity remains supportive on pullbacks. Time Frame 6H.
Buy!
Comment and subscribe to help us grow!
Check out other forecasts below too!
Disclosure: I am part of Trade Nation's Influencer program and receive a monthly fee for using their TradingView charts in my analysis.

Potential bearish drop off?US30 is reacting off the resistance level, which is an overlap resistance that aligns with the 23.6% Fibonacci retracement, and could drop from this level to our take profit.
Entry: 49,141.49
Why we like it:
There is an overlap resistance level that aligns with the 23.6% Fibonacci retracement.
Stop loss: 49,346.59
Why we like it:
There is a pullback resistance that aligns with the 50% Fibonacci retracement.
Take profit: 48,647.57
Why we like it:
There is a pullback support level that aligns with he 78.6% Fibonacci retracement.
Enjoying your TradingView experience? Review us!
Please be advised that the information presented on TradingView is provided to Vantage (‘Vantage Global Limited’, ‘we’) by a third-party provider (‘Everest Fortune Group’). Please be reminded that you are solely responsible for the trading decisions on your account. There is a very high degree of risk involved in trading. Any information and/or content is intended entirely for research, educational and informational purposes only and does not constitute investment or consultation advice or investment strategy. The information is not tailored to the investment needs of any specific person and therefore does not involve a consideration of any of the investment objectives, financial situation or needs of any viewer that may receive it. Kindly also note that past performance is not a reliable indicator of future results. Actual results may differ materially from those anticipated in forward-looking or past performance statements. We assume no liability as to the accuracy or completeness of any of the information and/or content provided herein and the Company cannot be held responsible for any omission, mistake nor for any loss or damage including without limitation to any loss of profit which may arise from reliance on any information supplied by Everest Fortune Group.

US30 Outlook : Momentum Still Favours upsideAt this stage, the focus remains on staying aligned with market direction and letting price confirm the bias, instead of trying to catch early reversals. As long as this momentum remains intact, the upside outlook stays valid.
Disclosure: We are part of Trade Nation's Influencer program and receive a monthly fee for using their TradingView charts in our analysis.

US30 SELLERS WILL DOMINATE THE MARKET|SHORT
US30 SIGNAL
Trade Direction: short
Entry Level: 48,987.0
Target Level: 47,696.0
Stop Loss: 49,840.8
RISK PROFILE
Risk level: medium
Suggested risk: 1%
Timeframe: 9h
Disclosure: I am part of Trade Nation's Influencer program and receive a monthly fee for using their TradingView charts in my analysis.
✅LIKE AND COMMENT MY IDEAS✅

US30 What Next? BUY!
My dear friends,
Please, find my technical outlook for US30 below:
The price is coiling around a solid key level - 49015
Bias - Bullish
Technical Indicators: Pivot Points High anticipates a potential price reversal.
Super trend shows a clear buy, giving a perfect indicators' convergence.
Goal - 49220
Safe Stop Loss - 48919
About Used Indicators:
The pivot point itself is simply the average of the high, low and closing prices from the previous trading day.
Disclosure: I am part of Trade Nation's Influencer program and receive a monthly fee for using their TradingView charts in my analysis.
———————————
WISH YOU ALL LUCK

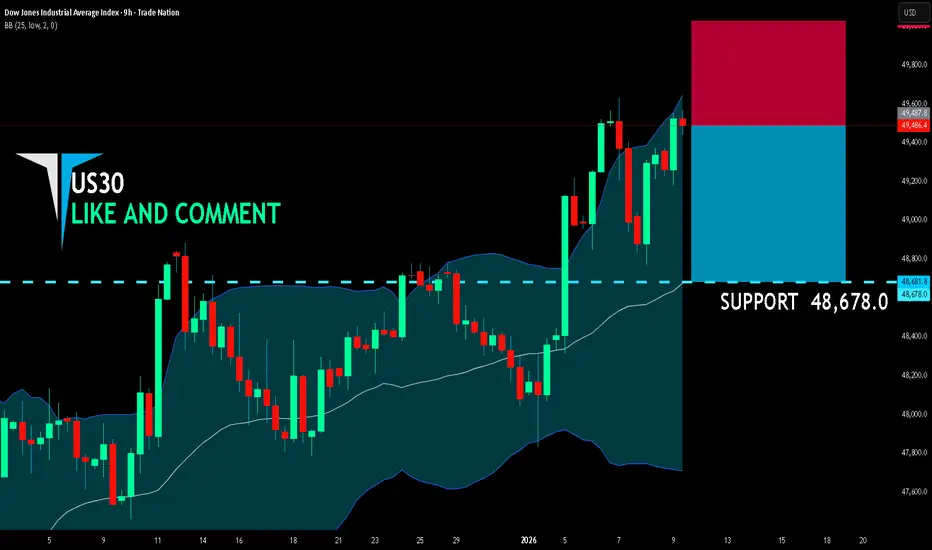
US30 BEARISH BIAS RIGHT NOW| SHORT
US30 SIGNAL
Trade Direction: short
Entry Level: 49,487.8
Target Level: 48.678.0
Stop Loss: 50,026.4
RISK PROFILE
Risk level: medium
Suggested risk: 1%
Timeframe: 9h
Disclosure: I am part of Trade Nation's Influencer program and receive a monthly fee for using their TradingView charts in my analysis.
✅LIKE AND COMMENT MY IDEAS✅
US30 I Potential upside from support 48,340 - 48,828Welcome back! Let me know your thoughts in the comments!
** US30 Analysis - Listen to video!
We recommend that you keep this on your watch list and enter when the entry criteria of your strategy is met.
Please support this idea with a LIKE and COMMENT if you find it useful and Click "Follow" on our profile if you'd like these trade ideas delivered straight to your email in the future.
Thanks for your continued support!

Dow 30 Outlook :: Trend Continuation Or Exhaustion?🎯 US30 (Dow Jones) - BULLISH PULLBACK SETUP | Day/Swing Trade 📈
💎 ASSET OVERVIEW
US30 Index CFD (Dow Jones Industrial Average)
The legendary Wall Street benchmark - 30 blue-chip giants moving markets worldwide 🏛️
🔥 TRADE SETUP - THIEF'S BLUEPRINT
📊 BIAS: Bullish Momentum Confirmed ✅
🎯 STRATEGY: Simple Moving Average (SMA) Pullback Play
⏰ TIMEFRAME: Day Trade / Swing Position
🚀 ENTRY ZONE
ANY PRICE LEVEL ENTRY - Flexibility is power, fam! 💪
Smart thieves don't chase - they position strategically at current market levels
🎖️ TARGET ZONE
TP: 50,600 🎉
Why this level? 🤔
✅ Police force resistance (strong institutional selling zone)
✅ Overbought territory - RSI screaming "TAKE PROFITS!"
✅ Correlation trap zone detected
✅ Historical rejection area
⚠️ THIEF'S WISDOM: Dear Ladies & Gentlemen (Thief OG's) 👑 - I'm NOT recommending you set ONLY my TP. It's YOUR choice, YOUR money, YOUR risk! Scale out, lock profits, be smart! 💰
🛡️ STOP LOSS
SL: 48,800 🚨
Risk Management = Survival 🎲
⚠️ THIEF'S DISCLAIMER: Dear Ladies & Gentlemen (Thief OG's) 👑 - I'm NOT recommending you set ONLY my SL. Adjust based on YOUR risk tolerance and account size. Protect that capital like it's gold! 🔐
🔗 CORRELATED PAIRS TO WATCH 👀
🇺🇸 US Dollar Pairs:
DXY (US Dollar Index) - Inverse correlation: If DXY falls, US30 typically rallies 📉➡️📈
EUR/USD - Risk-on sentiment boosts both
GBP/USD - Cable follows risk appetite
📊 US Indices Family:
NAS100 (Nasdaq) - Tech-heavy cousin, leads risk sentiment 🖥️
SPX500 (S&P 500) - Broader market confirmation 📊
Russell 2000 - Small-cap risk gauge
💹 Other Key Assets:
Gold (XAU/USD) - Safe haven inverse play 🥇
Crude Oil (WTI/Brent) - Energy sector impact ⛽
VIX (Fear Index) - Low VIX = Bullish equities 😌
📰 FUNDAMENTAL & ECONOMIC FACTORS 🌍
🔑 KEY DRIVERS TO MONITOR:
✅ Latest Considerations:
Fed Interest Rate Policy - Rate cut expectations boost indices 💵
US Employment Data - Strong jobs = bullish markets 💼
Corporate Earnings Season - Dow components reporting (Boeing, Apple, Microsoft, etc.) 📊
Inflation Data (CPI/PPI) - Lower inflation = rally fuel 🔥
GDP Growth Figures - Economic expansion supports equities 📈
📅 Upcoming News Events to Watch:
FOMC Minutes Release - Fed policy hints 🏦
NFP (Non-Farm Payrolls) - First Friday monthly jobs bomb 💣
Retail Sales Data - Consumer spending strength 🛍️
PMI Manufacturing/Services - Economic health check 🏭
Presidential Economic Policies - Trade deals, tariffs, fiscal stimulus 🇺🇸
⚠️ Risk-Off Events:
Geopolitical tensions (watch Middle East, China-US relations) 🌐
Banking sector stress signals 🏦
Unexpected Fed hawkish pivot 🦅
🎭 THIEF'S FINAL MESSAGE 💬
Yo fam! 🎩✨
If you made it this far, you're one of the REAL ONES! 🔥
Remember: The market doesn't care about your feelings - it only respects discipline, strategy, and risk management! 🎯
This setup is MY analysis, but YOUR money is YOUR responsibility. Take profits when they're green, cut losses when they're red. No hero holding here! 💯
🙏 THIEF'S BLESSING:
"May your entries be clean, your exits be profitable, and your stop losses never get hit!" 🚀💰
"Trade smart, stay sharp, and let the market pay you!" 💸
👇 SUPPORT THE THIEF SQUAD! 👇
If this idea helped you or gave you clarity:
✅ SMASH that LIKE button 👍💎
✅ DROP a COMMENT below with your thoughts or questions! 💬🔥
✅ HIT FOLLOW to catch the next heist setup! 🎯📲
Your support fuels more FREE alpha! 🚀
⚡ Let's rob the markets LEGALLY together! ⚡
#US30 #DowJones #TradingView #DayTrading #SwingTrading #TechnicalAnalysis #BullishSetup #ThiefTrader #MarketHeist #ProfitTakers #StockMarket #ForexTrading #Indices #WallStreet 📊💰🎯

US30 SENDS CLEAR BULLISH SIGNALS|LONG
US30 SIGNAL
Trade Direction: short
Entry Level: 49,128.6
Target Level: 49,509.4
Stop Loss: 48,876.2
RISK PROFILE
Risk level: medium
Suggested risk: 1%
Timeframe: 1h
Disclosure: I am part of Trade Nation's Influencer program and receive a monthly fee for using their TradingView charts in my analysis.
✅LIKE AND COMMENT MY IDEAS✅
