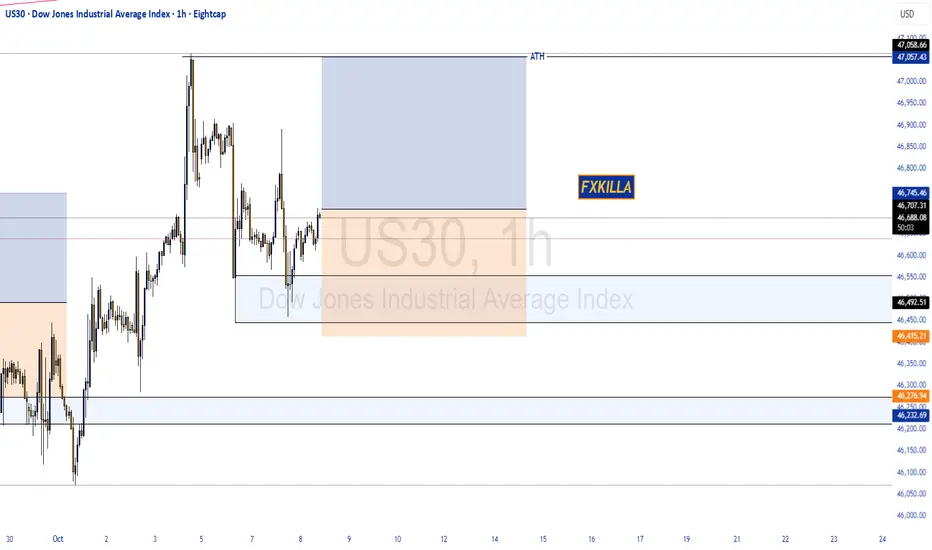
DOW JONES HIGH PROBABILITY SETUP SOON!!!🚨 DOW30 HIGH PROBABILITY BUY SETUP 🚨
* Here We Can See Clearly The Next Potential Move For US30 Coming Hours/Days.
* Keep Your Eyes Close On Your Trading Positions.
* Happy PIP Hunting Traders.
FXKILLA.
D-US30
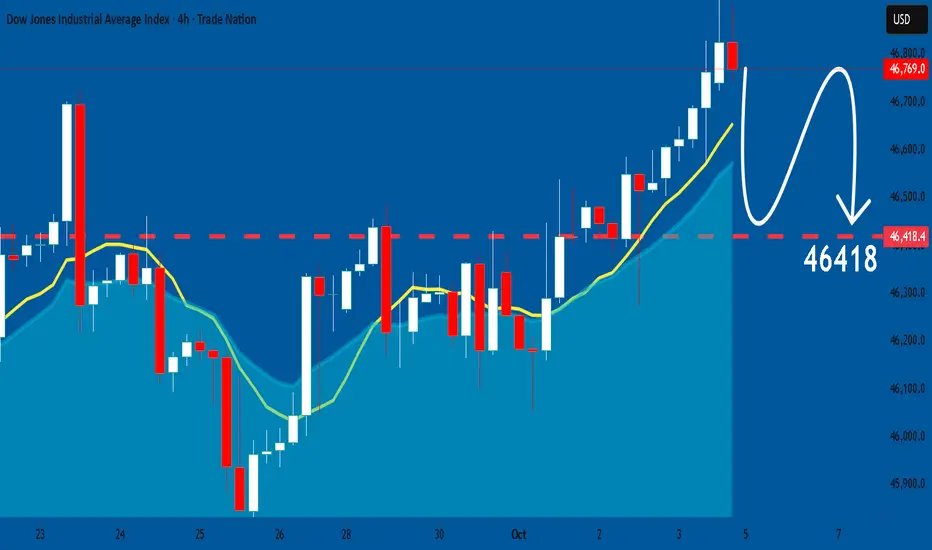
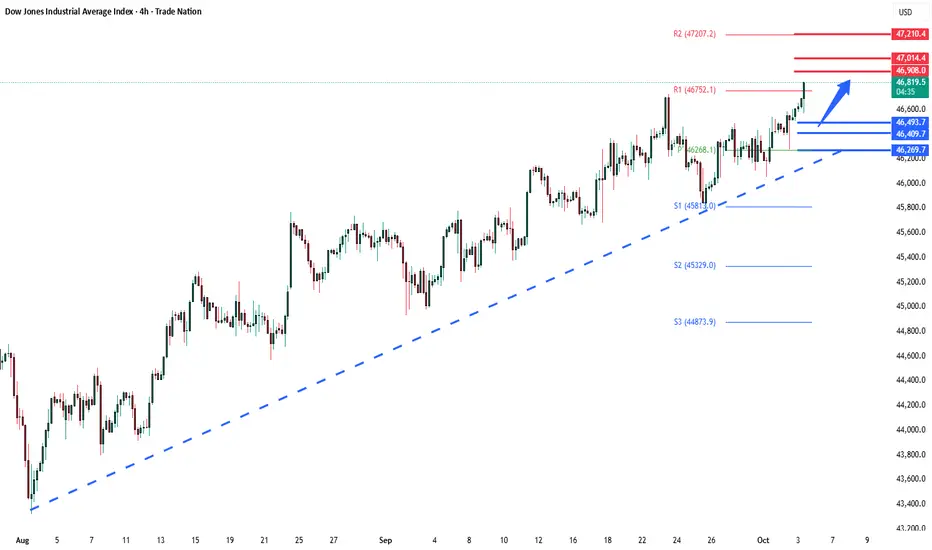
DowJones pre US Open key trading levelsKey Support and Resistance Levels
Resistance Level 1: 46908
Resistance Level 2: 47014
Resistance Level 3: 47210
Support Level 1: 46493
Support Level 2: 46409
Support Level 3: 46270
This communication is for informational purposes only and should not be viewed as any form of recommendation as to a particular course of action or as investment advice. It is not intended as an offer or solicitation for the purchase or sale of any financial instrument or as an official confirmation of any transaction. Opinions, estimates and assumptions expressed herein are made as of the date of this communication and are subject to change without notice. This communication has been prepared based upon information, including market prices, data and other information, believed to be reliable; however, Trade Nation does not warrant its completeness or accuracy. All market prices and market data contained in or attached to this communication are indicative and subject to change without notice.

Us30 Trade Set Up Oct 7 2025Price is approaching a 4h FVG, if price respects it i will take sells to SSL but if price trades through it i will wait for PDH to be swept before looking for sells
www.tradingview.com

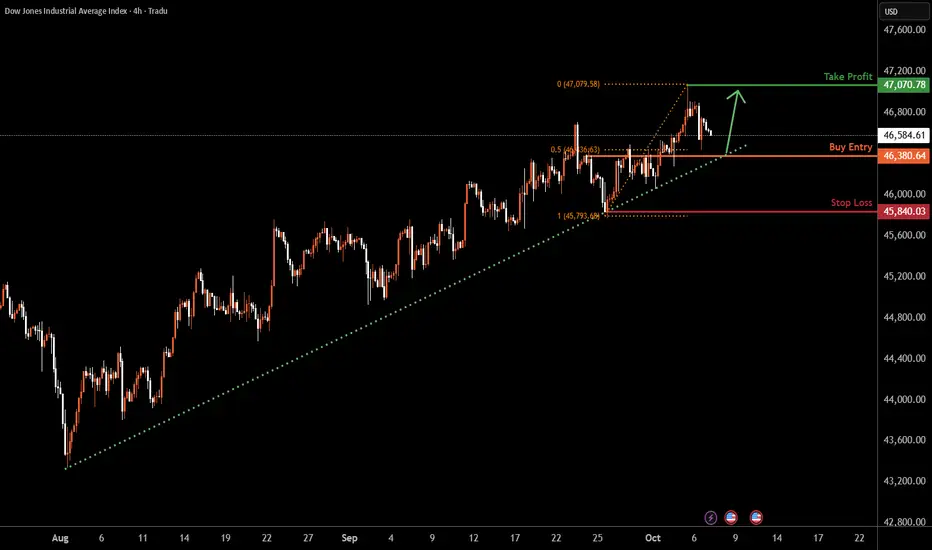
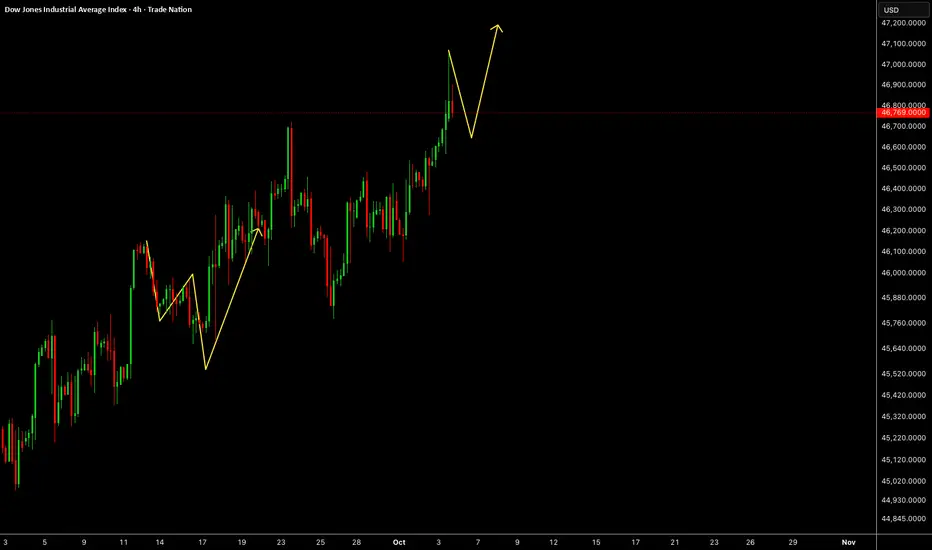
US30 H4 | Continuation Of Bullish MomentumBased on the H4 chart analysis, we could see the price fall to the buy entry at 46,380.64, whichis a pullback support that aligns with the 50% Fibonacci retracement and could bounce from this level to the upside.
Stop loss is at 45,840.03, which is a pullback support.
Tak eporfit is at 47,070.78, which is a swing high resistance.
High Risk Investment Warning
Trading Forex/CFDs on margin carries a high level of risk and may not be suitable for all investors. Leverage can work against you.
Stratos Markets Limited (tradu.com ):
CFDs are complex instruments and come with a high risk of losing money rapidly due to leverage. 65% of retail investor accounts lose money when trading CFDs with this provider. You should consider whether you understand how CFDs work and whether you can afford to take the high risk of losing your money.
Stratos Europe Ltd (tradu.com ):
CFDs are complex instruments and come with a high risk of losing money rapidly due to leverage. 66% of retail investor accounts lose money when trading CFDs with this provider. You should consider whether you understand how CFDs work and whether you can afford to take the high risk of losing your money.
Stratos Global LLC (tradu.com ):
Losses can exceed deposits.
Please be advised that the information presented on TradingView is provided to Tradu (‘Company’, ‘we’) by a third-party provider (‘TFA Global Pte Ltd’). Please be reminded that you are solely responsible for the trading decisions on your account. There is a very high degree of risk involved in trading. Any information and/or content is intended entirely for research, educational and informational purposes only and does not constitute investment or consultation advice or investment strategy. The information is not tailored to the investment needs of any specific person and therefore does not involve a consideration of any of the investment objectives, financial situation or needs of any viewer that may receive it. Kindly also note that past performance is not a reliable indicator of future results. Actual results may differ materially from those anticipated in forward-looking or past performance statements. We assume no liability as to the accuracy or completeness of any of the information and/or content provided herein and the Company cannot be held responsible for any omission, mistake nor for any loss or damage including without limitation to any loss of profit which may arise from reliance on any information supplied by TFA Global Pte Ltd.
The speaker(s) is neither an employee, agent nor representative of Tradu and is therefore acting independently. The opinions given are their own, constitute general market commentary, and do not constitute the opinion or advice of Tradu or any form of personal or investment advice. Tradu neither endorses nor guarantees offerings of third-party speakers, nor is Tradu responsible for the content, veracity or opinions of third-party speakers, presenters or participants.
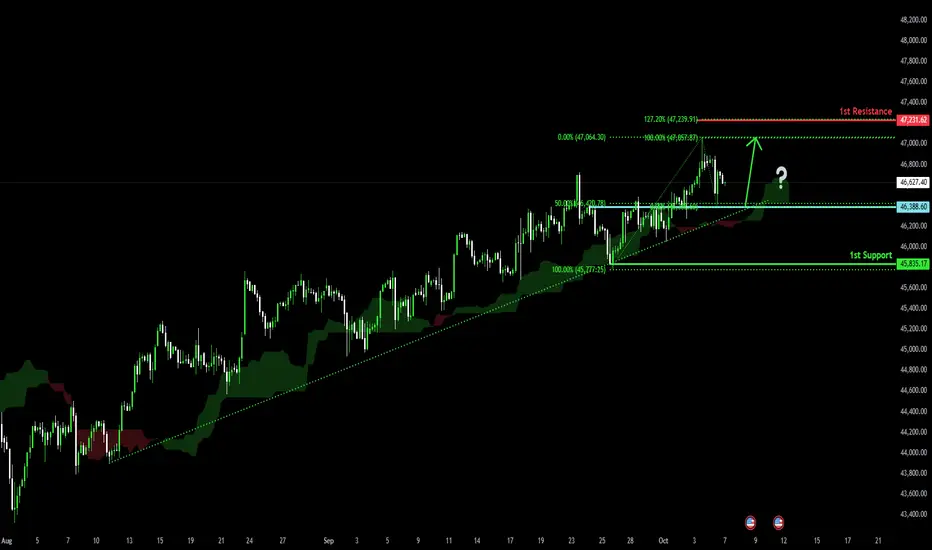
Bullish continuation?Dow Jones (US30) is reacting off the pivot and could bounce to the 1st resistance.
Pivot: 46,388.60
1st Support: 45,835.17
1st Resistance: 47,231.62
Disclaimer:
The above opinions given constitute general market commentary, and do not constitute the opinion or advice of IC Markets or any form of personal or investment advice.
Any opinions, news, research, analyses, prices, other information, or links to third-party sites contained on this website are provided on an "as-is" basis, are intended only to be informative, is not an advice nor a recommendation, nor research, or a record of our trading prices, or an offer of, or solicitation for a transaction in any financial instrument and thus should not be treated as such. The information provided does not involve any specific investment objectives, financial situation and needs of any specific person who may receive it. Please be aware, that past performance is not a reliable indicator of future performance and/or results. Past Performance or Forward-looking scenarios based upon the reasonable beliefs of the third-party provider are not a guarantee of future performance. Actual results may differ materially from those anticipated in forward-looking or past performance statements. IC Markets makes no representation or warranty and assumes no liability as to the accuracy or completeness of the information provided, nor any loss arising from any investment based on a recommendation, forecast or any information supplied by any third-party.
Us30 Trade Set Up Oct 6 2025Price made made ATH last week and is bullish making HH/HL on the 1h. There is a bullish 4h FVG under SSL and a bearish 1h FVG above BSL so i want to see either one tapped into first followed by a 1m IFVG/CISD to take to the level that wasnt tapped yet
www.tradingview.com

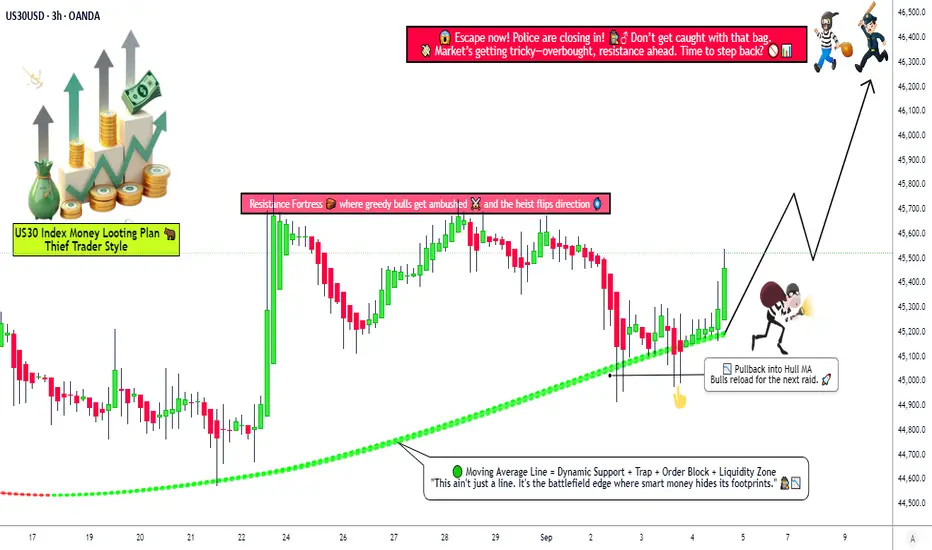
Dow Jones Bullish Strategy! Can the Market Break Higher?🚀 US30 Index Money-Making Plan (Swing / Day Trade) 📊
🧠 Trading Plan & Strategy (Thief Layer Style)
🚀 Approach: Bullish Hull Moving Average pullback plan — “bulls reloaded” for the next wave.
🎯 Entry (Layering Strategy): Multiple buy-limit layers → 45,200 • 45,300 • 45,400 • 45,500 (flexible to add more based on your own plan).
🛡️ Stop Loss: Reference point at 45,000. Adjust SL responsibly to match your personal risk tolerance & style.
💰 Target: Potential resistance zone (the “police barricade”) sits near 46,300. That’s where traders may consider taking profits.
📢 Note: This is an illustrative plan based on technicals — every trader should adapt TP/SL to their own strategy and risk appetite.
📊 US30 Market Report – September 4, 2025
📈 Current Price Snapshot
Trading near 45,000 points, up 0.05% today.
Strong monthly performance (+2.4%) and robust yearly gains (+17%).
Market showing resilience despite trade tensions.
😊 Retail Traders’ Sentiment
60% long vs 40% short → Tilted bullish.
Optimism driven by hopes for earnings growth & Fed rate cuts.
Caution remains due to tariff risks.
🏦 Institutional Traders’ Outlook
Cautiously bullish positioning.
Demand for equities continues, but with moderated exposure.
Buybacks + foreign inflows supporting price action.
🌡️ Overall Investor Mood
Neutral to positive tone.
Economic resilience balanced against policy uncertainty.
Healthy breadth across sectors, not just tech.
😨 Fear & Greed Index
Currently at 52 (Neutral).
Suggests balance — no extremes dominating.
Neutral setups often precede steady gains.
💹 Fundamental Score → 8/10
Strong corporate earnings (+12–13% growth projected next year).
Balance sheets remain solid.
AI & tech themes boosting key components.
Tariffs still a drag, but diversified exposure helps.
🌍 Macro Score → 7/10
US GDP growth cooling to 1.5%, but global rebound supports outlook.
Inflation ~2.9%; Fed rate cuts expected later.
Labor market stable, policy clarity could add upside.
🐂 Overall Market Outlook: Bullish Bias 📈
If support at 45,000 holds, potential move higher toward 46,000+.
Drivers: Strong earnings, Fed easing, broad rally.
Watch: Trade news headlines remain a key risk factor.
🔎 Why This Plan?
Hull MA pullback indicates momentum continuation.
Layered entries provide flexibility & better risk distribution.
Market sentiment + fundamentals align with bullish bias.
Resistance at 46,300 offers a clear take-profit zone.
📌 Related Pairs to Watch
CAPITALCOM:US30
FOREXCOM:SPX500
EIGHTCAP:NDQ100
TVC:VIX
TVC:DXY
✨ “If you find value in my analysis, a 👍 and 🚀 boost is much appreciated — it helps me share more setups with the community!”
#US30 #DowJones #Indices #SwingTrading #DayTrading #TechnicalAnalysis #StockMarket #TradingPlan #HullMA #LayeringStrategy
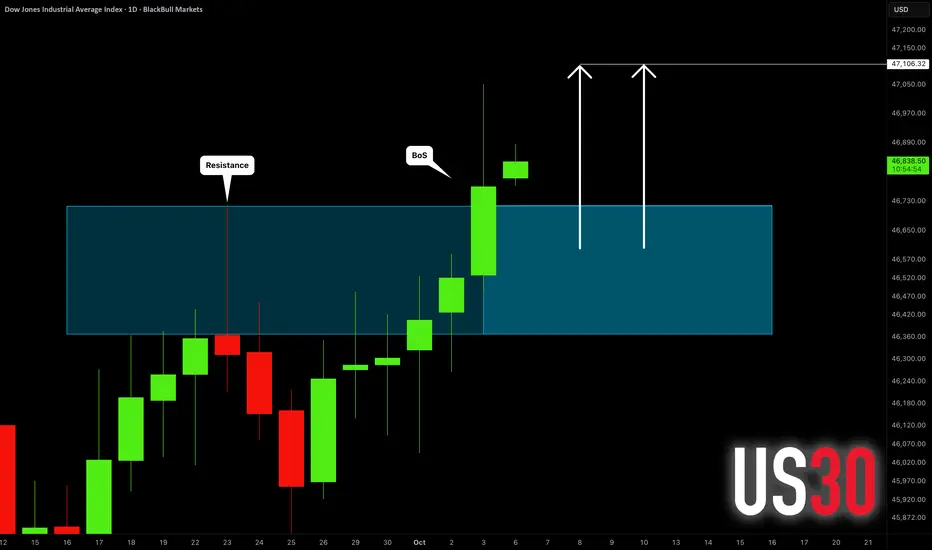
DOW JONES INDEX (US30): Another BoS Confirmed
US30 updated the all-time high on Friday, breaking and closing
above a major daily horizontal resistance cluster.
It opens a potential for more growth now.
Next resistance is 47100.
❤️Please, support my work with like, thank you!❤️
I am part of Trade Nation's Influencer program and receive a monthly fee for using their TradingView charts in my analysis.
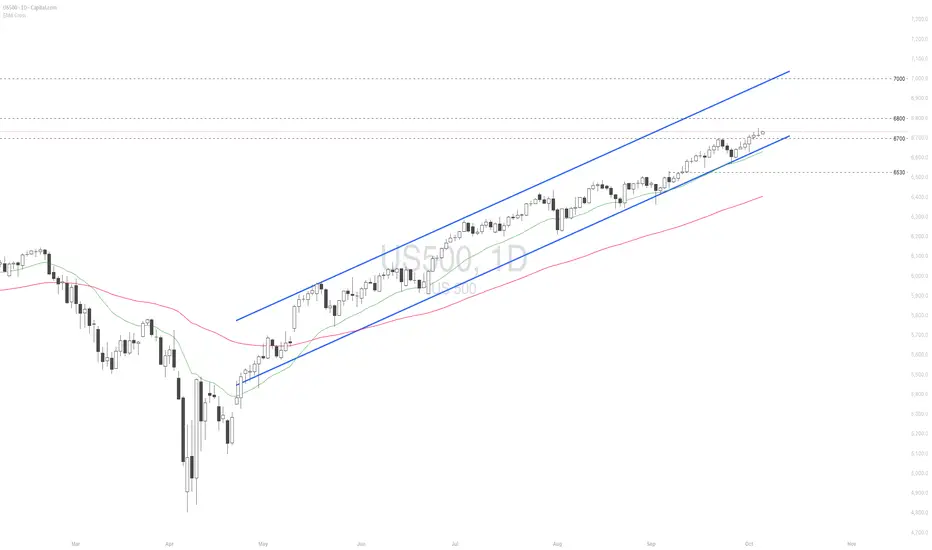
Will the AI frenzy drive US indices to new record highs again?
Despite the US government shutdown risk and elevated valuation concerns, US equities continued their upward rally, driven primarily by strength in AI-related stocks.
OpenAI’s valuation has surged to USD 500 billion, a sharp jump from the USD 300 billion valuation in an earlier SoftBank-led funding round earlier this year. This makes OpenAI the most valuable startup in the world, surpassing SpaceX.
Citigroup (C) raised its forecast for global AI spending, projecting USD 490 billion by 2026 (up from USD 420 billion) and cumulative hyperscaler investments by Amazon (AMZN), Microsoft (MSFT), and others to reach USD 2.8 trillion by 2029, up from the previous USD 2.3 trillion estimate.
US500 extended its rally to a new record high, maintaining a solid uptrend within the ascending channel. The diverging bullish EMAs point to the potential continuation of bullish momentum. If US500 breaches above the psychological resistance at 6800, the index may gain upward momentum toward the next psychological resistance at 7000. Conversely, if US500 breaks below the support at 6700, the index could retreat toward 6530.
Dow Jones US30 Analysis: Bullish Trend, Trade Plan📊 The US30 (Dow Jones) remains in a strong bullish trend, showing a clear sequence of higher highs and higher lows on the 4-hour chart 📈. However, when viewed on the daily timeframe, price now appears somewhat overextended ⚠️.
🔎 Dropping down to the lower timeframes and applying the Anchored VWAP (AVWAP) indicator, it’s evident that price is trading well above VWAP, signaling a premium zone. The risk here is that traders may continue buying into strength without acknowledging that price could easily retrace back into VWAP.
💡 Remember — smart money buys at a discount, not at a premium. In bullish trends like this, patience is crucial.
📹 In the video, I outline my trade plan, which focuses on waiting for a healthy pullback and then looking for a bullish setup if the structure aligns in our favor. I’m not interested in chasing price when it’s this extended — instead, I prefer to wait for the retracement and enter at better value, reducing risk and improving trade quality 🎯.
⚠️ Disclaimer: This analysis is for educational purposes only and not financial advice. Always trade responsibly and manage risk carefully.

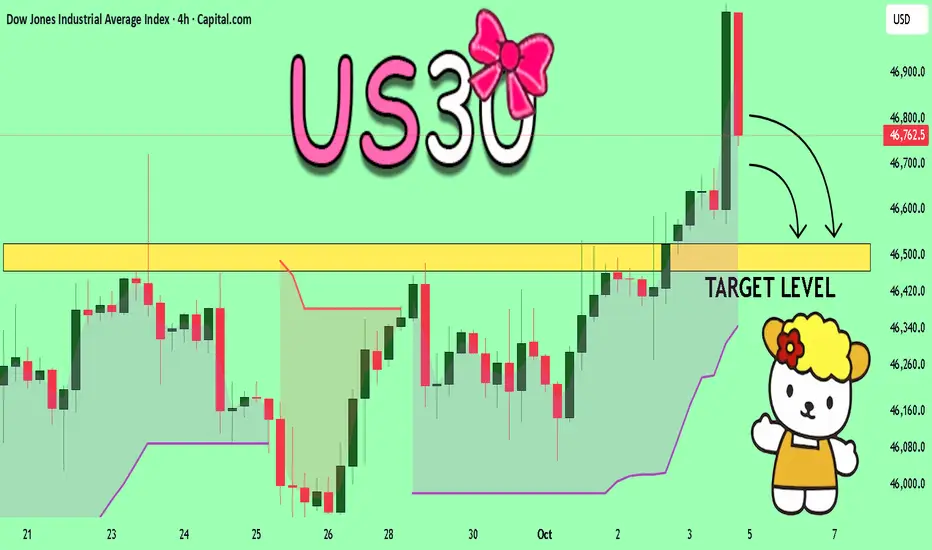
US30 Will Collapse! SELL!
My dear followers,
This is my opinion on the US30 next move:
The asset is approaching an important pivot point 46.762
Bias - Bearish
Technical Indicators: Supper Trend generates a clear short signal while Pivot Point HL is currently determining the overall Bearish trend of the market.
Goal - 46.525
About Used Indicators:
For more efficient signals, super-trend is used in combination with other indicators like Pivot Points.
Disclosure: I am part of Trade Nation's Influencer program and receive a monthly fee for using their TradingView charts in my analysis.
———————————
WISH YOU ALL LUCK
US30US30 needs some more correction before pushing up.
Disclosure: We are part of Trade Nation's Influencer program and receive a monthly fee for using their TradingView charts in our analysis.
US30: Bearish Continuation is Expected! Here is Why:
Looking at the chart of US30 right now we are seeing some interesting price action on the lower timeframes. Thus a local move down seems to be quite likely.
Disclosure: I am part of Trade Nation's Influencer program and receive a monthly fee for using their TradingView charts in my analysis.
❤️ Please, support our work with like & comment! ❤️
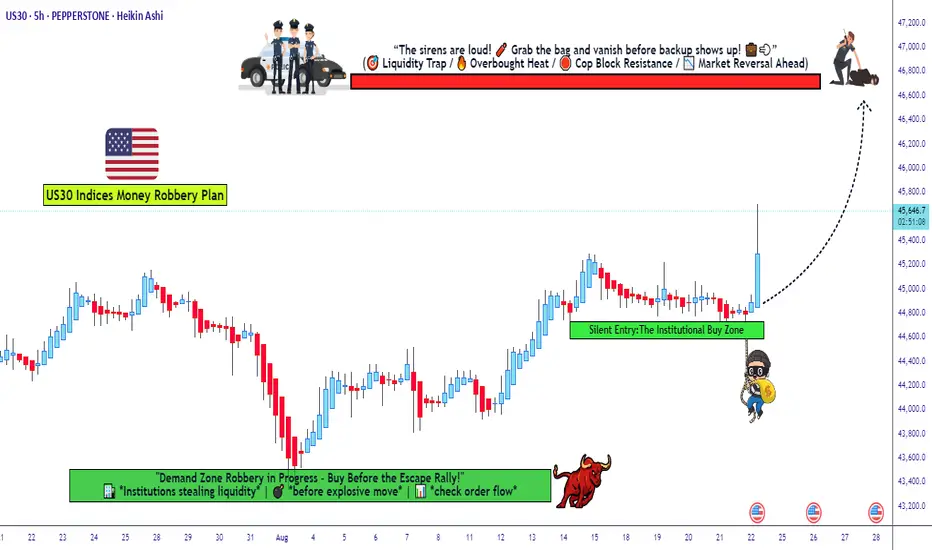
Dow Jones Bulls Preparing Another Robbery — Are You In?🚨💰 US30/DJ30 Index CFD Market Heist Plan 🏦🎭
🕵️ Dear Thief OG’s, Ladies & Gentlemen of the robbery squad… the vault is wide open again! This time we’re sneaking into the Dow Jones (US30) for a Bullish Day/Swing Heist. 🔥
🎯 Robbery Blueprint
Asset: US30/DJ30 Index CFD (Day/Swing Trade)
Plan: Bullish 📈
Entry (Thief Style):
The thief never knocks once… we layer the doors! Multiple buy limit orders 🔐:
Layer 1 → 45,600.0
Layer 2 → 45,400.0
Layer 3 → 45,200.0
(You can expand the layers depending on your risk appetite 🕳️)
Stop Loss (SL) 🛑:
📍 Thief SL @ 44,600.0
(Adjust based on your own risk & startergy – remember, survival is key in every robbery 🏃💨)
Target (TP) 🎯:
🚓 Police barricade spotted @47,000.0! Our sweet escape is planned at 46,800.0 before sirens catch us. 💰
🏆 Thief Strategy
Multiple limit order entries (layering method / scaling in).
Enter at any price level if you’re fast, but layering is the OG Thief move.
Manage your SL & risk like a pro robber – no reckless moves, or you’ll end up behind market bars! 🚔
💡 Why This Heist? 💡
The US30/DJ30 is primed for a bullish run 📈, driven by real-time market signals:
Technical Analysis: Strong support levels holding firm, momentum indicators screaming bullish! 📊
Fundamental Outlook: Check global market data, COT reports, and sentiment analysis for confirmation. 🔗👉
Volatility Watch: Stay sharp for news releases that could spike volatility. 📰⚠️
⚠️ Thief’s Risk Management ⚠️
News Alert: Avoid new trades during major news drops to dodge wild price swings. 🚫
Position Management: Use trailing stops to lock in those sweet profits. 🔐
Risk Control: Adjust lot sizes and SL based on your layered entries and risk profile. 📉
🏆 Join the Heist! 🏆
💥 Hit the Boost Button 💥 to power up our Thief Trader crew! 🚀 Let’s make bank with ease using the Thief Trading Style! 💸😎 Stay tuned for the next heist plan, and let’s keep robbing the markets! 🤑🐱👤
US30 -Dow Jones Industrial Average Technical Analysis & ForecastCurrent Price: 46,785.30 | 4th October 2025, 12:54 AM UTC+4
EXECUTIVE SUMMARY
The Dow Jones Industrial Average is trading at 46,785.30, showing consolidation near all-time highs. Multi-timeframe analysis reveals a bullish trend with caution signals emerging on shorter timeframes. Key resistance at 47,000-47,200 zone presents a critical decision point for continuation versus correction.
Bottom Line: Bullish bias remains intact on daily/weekly charts, but intraday traders should watch for potential pullback to 46,500-46,300 support zone before next leg higher.
MULTI-TIMEFRAME MARKET STRUCTURE
Monthly/Weekly Context (Swing Trading)
Trend: Strong bullish momentum maintained since October 2023 lows
Elliott Wave Count: Potential Wave 5 of larger degree impulse, suggesting final push before correction
Key Levels: Major support at 45,800-46,000 (previous breakout zone); resistance at 47,200-47,500
Daily Chart Analysis
Structure: Higher highs and higher lows pattern intact
Ichimoku Cloud: Price trading above bullish cloud; Tenkan-sen/Kijun-sen bullish cross active
Pattern Recognition: Ascending channel formation with upper boundary at 47,150
4-Hour Chart (Critical Timeframe)
Candlestick Patterns: Recent doji and spinning tops indicating indecision
RSI: Divergence warning - price making higher highs while RSI shows lower highs (bearish divergence)
Volume Profile: Declining volume on recent push higher suggests weakening momentum
1-Hour/30-Minute (Intraday Focus)
Microstructure: Double top formation developing at 46,850-46,900 zone
Bollinger Bands: Price touching upper band with band width expanding
VWAP: Trading 0.2% above daily VWAP (46,692) - moderately extended
TECHNICAL INDICATOR DEEP DIVE
Momentum Indicators
RSI (14):
Daily: 62 (neutral-bullish)
4H: 58 (declining from 72 two days ago)
1H: 54 (bearish divergence present)
Interpretation: Momentum cooling after recent rally; not yet oversold
Trend Indicators
Moving Averages:
20 EMA: 46,580 (immediate support)
50 EMA: 46,200 (critical support)
200 EMA: 44,800 (long-term trend support)
Golden Cross Status: Active and bullish (50 MA above 200 MA)
Volatility Indicators
Bollinger Bands (20,2): Price at upper band; squeeze releasing suggests increased volatility ahead
ATR (14): 285 points (elevated) - expect 250-350 point daily ranges
Volume Analysis
Volume Weighted Average Price: 46,692
Volume Trend: Declining on up-moves (distribution warning)
Anchored VWAP: From October 1st low at 46,450 - price 0.7% above anchor
HARMONIC & PATTERN ANALYSIS
Gann Analysis
Square of 9: Next resistance at 47,088 (90° from current cycle low); support at 46,488
Gann Angles: 1x1 angle from September low projects support at 46,550
Time Cycles: October 8-10 represents potential reversal window (45-48 trading days from last pivot)
Harmonic Patterns
Potential Bat Pattern: Monitoring for completion at 46,950-47,000 (0.886 retracement level)
Fibonacci Confluence: 1.618 extension of recent corrective wave targets 47,150
Wyckoff Analysis
Phase: Appears to be in Distribution Phase B (preliminary supply)
Spring/Shakeout Watch: False breakout above 47,000 could trigger sell-off
Elliott Wave Count
Primary Count: Wave 5 of Intermediate (3), targeting 47,400-47,800
Alternate Count: Wave B corrective triangle forming; expect breakdown if 46,500 breaks
SUPPORT & RESISTANCE FRAMEWORK
Immediate Resistance Zones
46,850-46,900 - Intraday double top / psychological
47,000-47,050 - Major psychological / round number / Gann level
47,150-47,200 - Channel top / Fibonacci 1.618 / weekly pivot
47,500-47,600 - All-time high extension target
Support Zones
46,650-46,700 - VWAP / hourly demand zone
46,500-46,550 - 20 EMA / Gann 1x1 angle / pivot
46,200-46,300 - 50 EMA / gap fill / strong demand
45,800-46,000 - Daily cloud / major breakout point
TRAP SCENARIOS
Bull Trap Alert
Setup: Break above 47,000 with low volume followed by immediate reversal
Confirmation: Close below 46,800 same day with volume spike
Target: Retest 46,300-46,500 zone
Bear Trap Potential
Setup: Quick spike below 46,500 followed by rapid recovery
Confirmation: Close above 46,650 with strong volume
Target: Resume rally toward 47,200+
INTRADAY TRADING PLAN (October 4-11, 2025)
Day Trading Strategy - Scalp Setups
Bullish Scenario (60% Probability)
Entry Criteria:
Pullback to 46,650-46,700 with bullish engulfing or hammer on 15M chart
RSI (15M) reaches 40-45 oversold region
Volume contraction during pullback, expansion on reversal
Trade Setup:
Entry: 46,680-46,720
Stop Loss: 46,580 (100 points risk)
Target 1: 46,850 (130 points, 1.3:1 R/R) - scale out 50%
Target 2: 47,000 (280 points, 2.8:1 R/R) - scale out 30%
Target 3: 47,150 (430 points, 4.3:1 R/R) - let 20% run
Optimal Entry Times:
9:45-10:15 AM EST (post-opening volatility)
2:00-3:00 PM EST (afternoon momentum)
Bearish Scenario (40% Probability)
Entry Criteria:
Rejection at 46,900-47,000 with bearish engulfing on 15M/30M
RSI (15M) overbought above 70
Break below 46,780 (short-term support)
Trade Setup:
Entry: 46,760-46,800 (after break confirmation)
Stop Loss: 46,920 (120-160 points risk)
Target 1: 46,650 (110-150 points) - cover 50%
Target 2: 46,500 (260-300 points) - cover 30%
Target 3: 46,300 (460-500 points) - trail remainder
Optimal Entry Times:
10:30-11:00 AM EST (if morning rally fails)
3:00-3:45 PM EST (late-day profit taking)
SWING TRADING PLAN (1-4 Week Horizon)
Primary Swing Setup - Bullish Continuation
Entry Strategy:
Ideal Entry Zone: 46,300-46,500 (if pullback materializes)
Aggressive Entry: Current levels with 46,450 stop
Pattern: Bull flag/ascending channel continuation
Position Management:
Entry: 46,400 (scale in 30% at 46,500, 40% at 46,400, 30% at 46,300 if available)
Stop Loss: 46,100 (300 points, daily close below)
Target 1: 47,200 (700-800 points) - reduce 40%
Target 2: 47,800 (1,300-1,400 points) - reduce 30%
Target 3: 48,500 (2,000+ points) - trail with 50 EMA
Timeframe: 2-4 weeks
Confidence Level: 65%
Alternative Swing Setup - Mean Reversion Short
Activation Criteria:
Daily close below 46,500 with volume above 20-day average
RSI daily breaks below 50
Break of ascending trendline from September
Trade Setup:
Entry: 46,450-46,500 (after confirmation)
Stop Loss: 46,850 (350-400 points)
Target 1: 46,000 (450-500 points) - cover 50%
Target 2: 45,600 (850-900 points) - cover 30%
Target 3: 45,200 (1,250-1,300 points) - trail remainder
Timeframe: 1-3 weeks
Confidence Level: 35% (lower probability setup)
WEEKLY ROADMAP (October 4-11)
Monday-Tuesday (Oct 6-7):
Expected Range: 46,500-47,100
Bias: Neutral to bullish - watch for pullback completion
Key Level: 46,700 (holding above maintains bullish structure)
Wednesday-Thursday (Oct 8-9):
Gann Time Window: Potential reversal period
Strategy: Reduce position size; let patterns develop
Watch: Economic data releases could spike volatility
Friday (Oct 10):
Weekly Close: Critical for swing positioning
Bullish Confirmation: Close above 46,850
Bearish Warning: Close below 46,600
RISK MANAGEMENT GUIDELINES
Position Sizing
Intraday: Risk 0.5-1% of capital per trade
Swing Trades: Risk 1-2% of capital per trade
Max Portfolio Heat: 4-5% across all positions
Key Risk Levels
Invalidation Point (Bulls): Daily close below 46,100
Invalidation Point (Bears): Daily close above 47,300
Correlation Monitoring
Watch US10Y yields (inverse correlation currently strong)
S&P 500 and Nasdaq leading/lagging analysis
Dollar Index impact on risk appetite
MARKET CONTEXT & EXTERNAL FACTORS
Macroeconomic Considerations
Federal Reserve policy stance remains influential
Q3 earnings season beginning - watch corporate guidance
Geopolitical tensions requiring monitoring (Middle East, US-China)
Sentiment Indicators
VIX below 15 suggests complacency - potential volatility spike risk
Put/Call ratios showing neutral sentiment
Institutional flows appear distributive near highs
Seasonal Patterns
October historically volatile (correction risk)
Year-end rally potential if correction occurs early month
FINAL TRADING RECOMMENDATIONS
For Intraday Traders:
Best Setup: Wait for pullback to 46,650-46,700 for low-risk long entries
Avoid: Chasing above 46,900 without confirmation
Focus Timeframes: 15-minute and 1-hour charts for entries; 5-minute for exits
For Swing Traders:
Patience Required: Current levels are extended; wait for 46,300-46,500 zone
Alternative: Small position at current levels with very tight stops (46,650)
Best Risk/Reward: Appears in the 46,300-46,400 region
Overall Market Outlook:
Bullish bias maintained with 60-65% probability of testing 47,200+ in coming 2-3 weeks. However, near-term consolidation or shallow pullback (5-7%) is healthy and would provide better entry opportunities. The combination of weakening momentum indicators and potential Gann time reversal window suggests patience will be rewarded.
TRADING PSYCHOLOGY NOTES
FOMO Warning: Resist urge to chase at current elevated levels
Discipline: Stick to predefined entry zones even if price continues higher
Flexibility: Be ready to flip bias if key levels break (46,100 bears / 47,300 bulls)
Disclaimer: This analysis is for educational purposes only. Trading involves substantial risk of loss. Always conduct your own research and consult with financial advisors before making investment decisions. Past performance does not guarantee future results.
Next Update: October 7, 2025 (Mid-week review with refined levels)
Analysis combines multiple technical methodologies for comprehensive market perspective. No single indicator should be used in isolation. Confluence of signals increases probability of success.
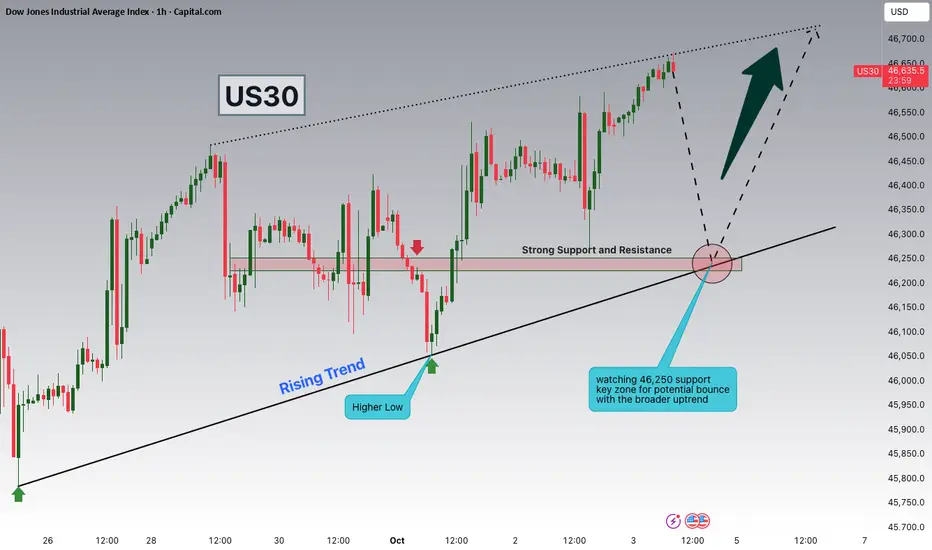
Dow Jones Watching 46,250 Support for Potential ContinuationHey Traders, in today’s trading session we are monitoring US30 for a potential buying opportunity around the 46,250 zone. The Dow Jones is trading in an uptrend and currently in a correction phase, with price moving toward this key support/resistance level.
Structure: The broader trend remains bullish, with pullbacks serving as corrections within the uptrend.
Key level in focus: 46,250 — an important support zone where price could stabilize and attract buyers.
Next move: Holding above 46,250 could open the door for continuation toward higher highs, while a breakdown would suggest a deeper retracement.
Trade safe,
Joe.
Is the Dow Jones still bullish? Yes.
Hello everyone
I think Dow Jones has the potential to grow further and if the conditions set in the figure below are met, it can be said that it can easily reach the set target. What do you think, friend? Leave me a comment

DowJones Key Trading levels Key Support and Resistance Levels
Resistance Level 1: 46900
Resistance Level 2: 47000
Resistance Level 3: 47210
Support Level 1: 46490
Support Level 2: 46410
Support Level 3: 46270
This communication is for informational purposes only and should not be viewed as any form of recommendation as to a particular course of action or as investment advice. It is not intended as an offer or solicitation for the purchase or sale of any financial instrument or as an official confirmation of any transaction. Opinions, estimates and assumptions expressed herein are made as of the date of this communication and are subject to change without notice. This communication has been prepared based upon information, including market prices, data and other information, believed to be reliable; however, Trade Nation does not warrant its completeness or accuracy. All market prices and market data contained in or attached to this communication are indicative and subject to change without notice.
Us30 Trade Set Up Oct 3 2025Price is trading above PDH so still bullish. If this 4h FVG gets respected and SSL gets swept i will look for buys to BSL/ATH but price has changed state on the 15m and 1h so i price comes to retest the 15m CISD and respects it i will look for IFVG on the 1m to take to lower SSL
www.tradingview.com


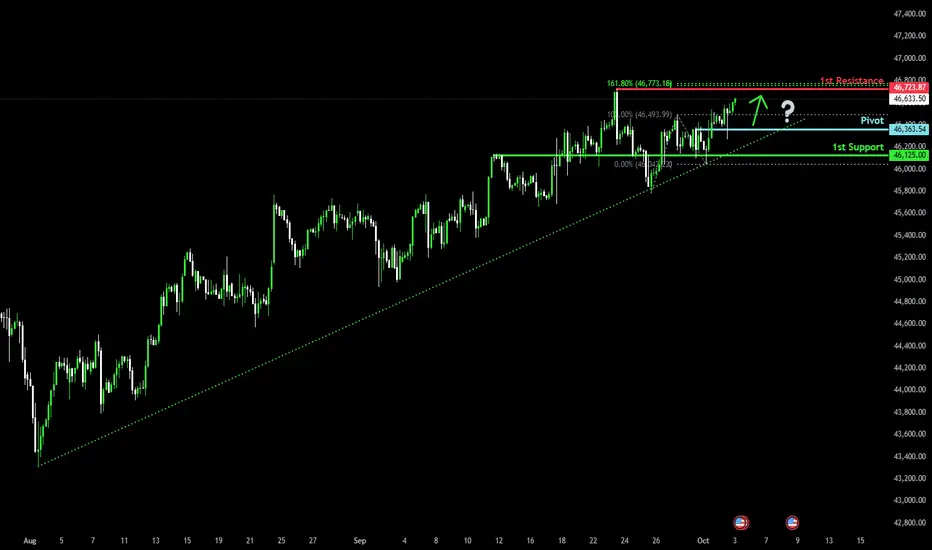
Bullish momentum to extend?Dow Jones (US30) has bounced off the pivot and could rise to the 1st resistance whch acts as a swing high resistance.
Pivot: 46,363.54
1st Support: 46,125
1st Resistance: 46,723.87
Disclaimer:
The above opinions given constitute general market commentary, and do not constitute the opinion or advice of IC Markets or any form of personal or investment advice.
Any opinions, news, research, analyses, prices, other information, or links to third-party sites contained on this website are provided on an "as-is" basis, are intended only to be informative, is not an advice nor a recommendation, nor research, or a record of our trading prices, or an offer of, or solicitation for a transaction in any financial instrument and thus should not be treated as such. The information provided does not involve any specific investment objectives, financial situation and needs of any specific person who may receive it. Please be aware, that past performance is not a reliable indicator of future performance and/or results. Past Performance or Forward-looking scenarios based upon the reasonable beliefs of the third-party provider are not a guarantee of future performance. Actual results may differ materially from those anticipated in forward-looking or past performance statements. IC Markets makes no representation or warranty and assumes no liability as to the accuracy or completeness of the information provided, nor any loss arising from any investment based on a recommendation, forecast or any information supplied by any third-party.
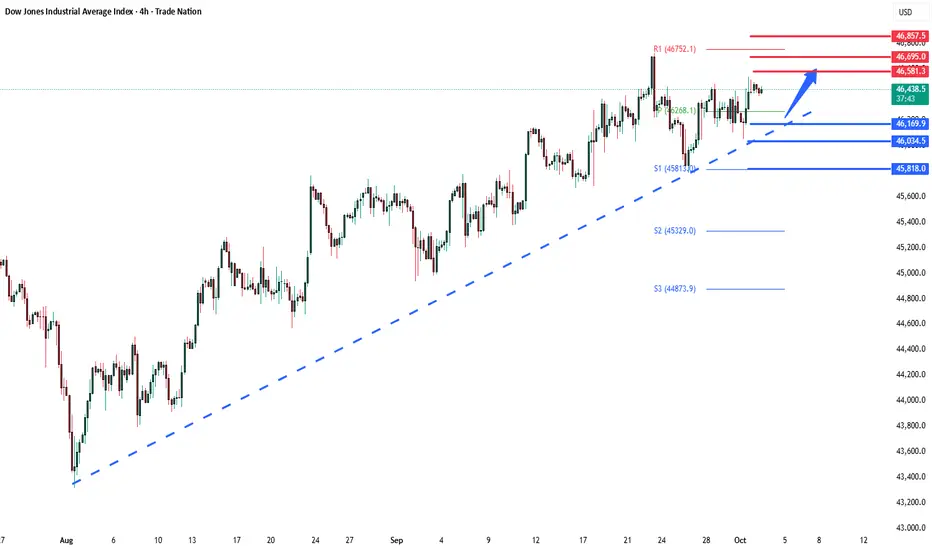
Dow Key Trading LevelsKey Support and Resistance Levels
Resistance Level 1: 46580
Resistance Level 2: 46690
Resistance Level 3: 46850
Support Level 1: 46170
Support Level 2: 46040
Support Level 3: 45800
This communication is for informational purposes only and should not be viewed as any form of recommendation as to a particular course of action or as investment advice. It is not intended as an offer or solicitation for the purchase or sale of any financial instrument or as an official confirmation of any transaction. Opinions, estimates and assumptions expressed herein are made as of the date of this communication and are subject to change without notice. This communication has been prepared based upon information, including market prices, data and other information, believed to be reliable; however, Trade Nation does not warrant its completeness or accuracy. All market prices and market data contained in or attached to this communication are indicative and subject to change without notice.
Us30 Trade Set Up Oct 2 2025Price is overall bullish making HH/HL and has created a 4h FVG so i want to see price first sweep SSL/London lows, tap into 4h FVG to then look for 1m IFVG/CISD to target PDH
www.tradingview.com
