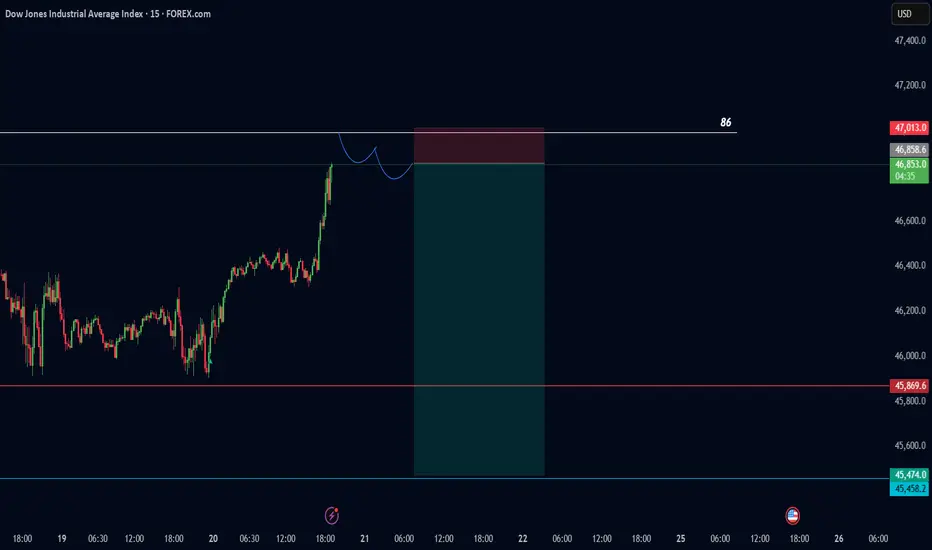
US30 DOW JONES at Resistance: Here's My Trade PlanI'm keeping a close eye on US30 right now. The market has pushed into a clean bullish breakout, printing higher highs and higher lows across both the H4 and H1 timeframes. 🚀
At the moment, price is overextended and tapping into a significant resistance zone, suggesting that a retracement is likely. Some aggressive traders may look for a counter-trend short, but that comes with elevated risk. ⚠️
Personally, I’m waiting for a healthy pullback, followed by a bullish break of structure to confirm a trend continuation setup. That’s where the higher-probability opportunity may unfold. ✔️
Not financial advice — for educational purposes only.
D-US30

US30 Trade Set Up Nov 25 2025Price remains bullish and has swept SSL already in Asia and London followed by a 1h engulfing and CISD so i will wait for more internal bullish structure on the 5m before looking for buys above PDH to target BSL

US30 LONG IDEAOverall trend is bullish so why not grabbing the nice bullish continuation opportunity
US30 Trade Secured 2500 PipsPlayed out perfectly, sweeping SSl and London lows to then engulf and invert on the 5m to target PDL/BSL

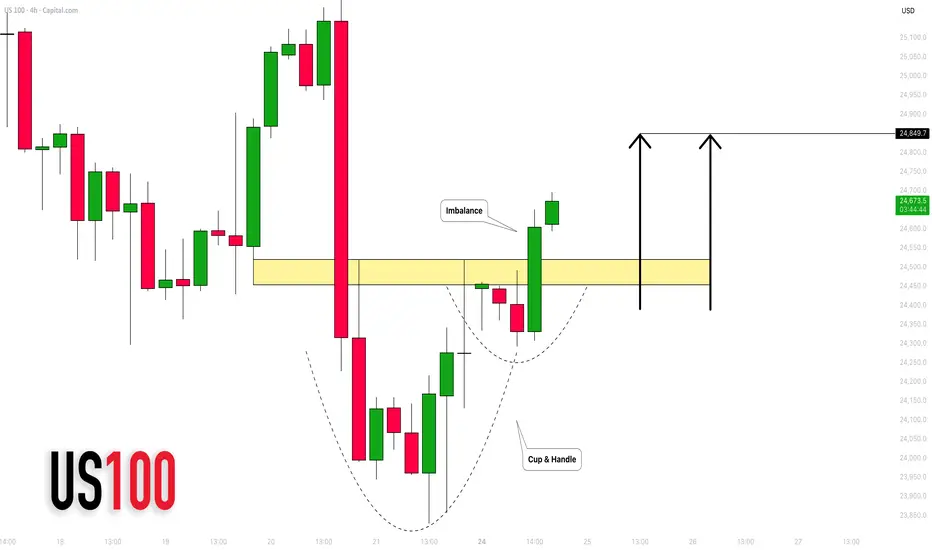
NASDAQ INDEX (US100): Strong Bullish Pattern
There is a high chance that US100 will rise
after a formation of a cup & handle pattern on a 4h time frame
with a breakout of its neckline with a bullish imbalance.
Expect a rise at least to 24850
❤️Please, support my work with like, thank you!❤️
I am part of Trade Nation's Influencer program and receive a monthly fee for using their TradingView charts in my analysis.
US30 Trade Set Up Nov 24 2025Price has swept 1h SSL in London and engulfed 1h bearish candle so i want to see a internal 15m SSL swept followed by 1m-5m IFVG/CISD to target PDH

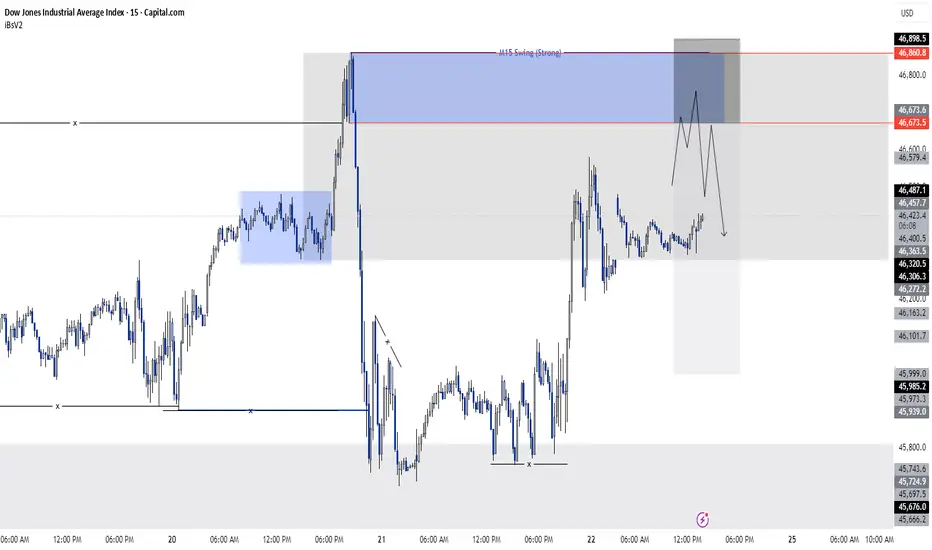
US 30 sell idea As we know, the swing structure on both the H4 and M15 timeframes is bearish. And we also know that we cannot take trades directly from the H4 timeframe, so to refine our entry we move down to the M15 timeframe and take our entry from there.
Now, on the H4 timeframe, we observed that the H4 swing is bearish, and at the same time, the H4 has also swept a fractal zone, after which the market moved downward. Now, for the market to continue its trend, it will make a pullback. We will look for this pullback on the M15 timeframe because we will take our sell entry from the M15 timeframe.
And on the M15 timeframe, when the price comes into our blue zone (46673.5 – 46860.8), we will take a sell trade.
US30: Bearish Continuation & Short Signal
US30
- Classic bearish formation
- Our team expects fall
SUGGESTED TRADE:
Swing Trade
Sell US30
Entry Level - 46270
Sl - 46419
Tp - 46011
Our Risk - 1%
Start protection of your profits from lower levels
Disclosure: I am part of Trade Nation's Influencer program and receive a monthly fee for using their TradingView charts in my analysis.
❤️ Please, support our work with like & comment! ❤️

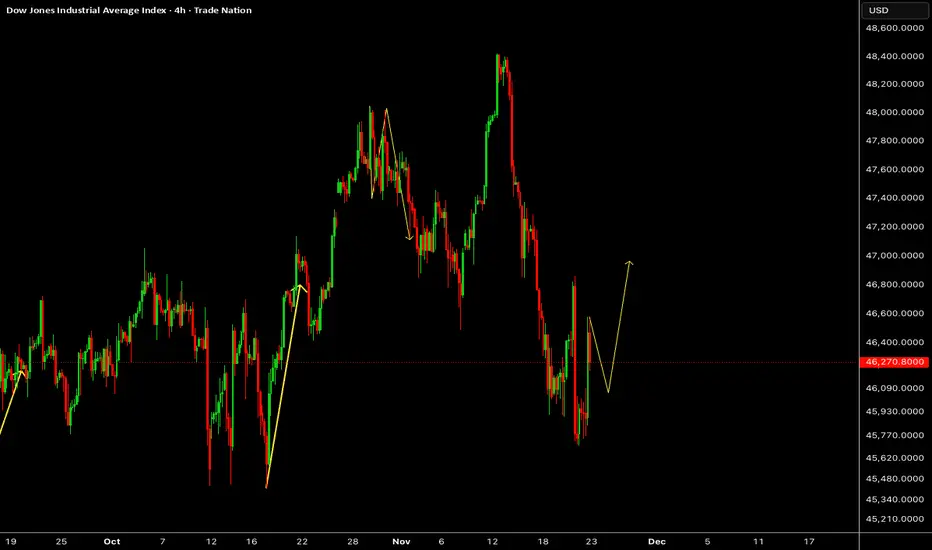
US30 – Sharp Drop Stabilising with a Potential Recovery PathAfter a pronounced downside move, price has begun to stabilise with a volatile rebound pattern forming. If this developing structure continues to hold, a gradual upward continuation scenario may unfold as sentiment attempts to shift in the coming sessions.
Disclosure: We are part of Trade Nation's Influencer program and receive a monthly fee for using their TradingView charts in our analysis.
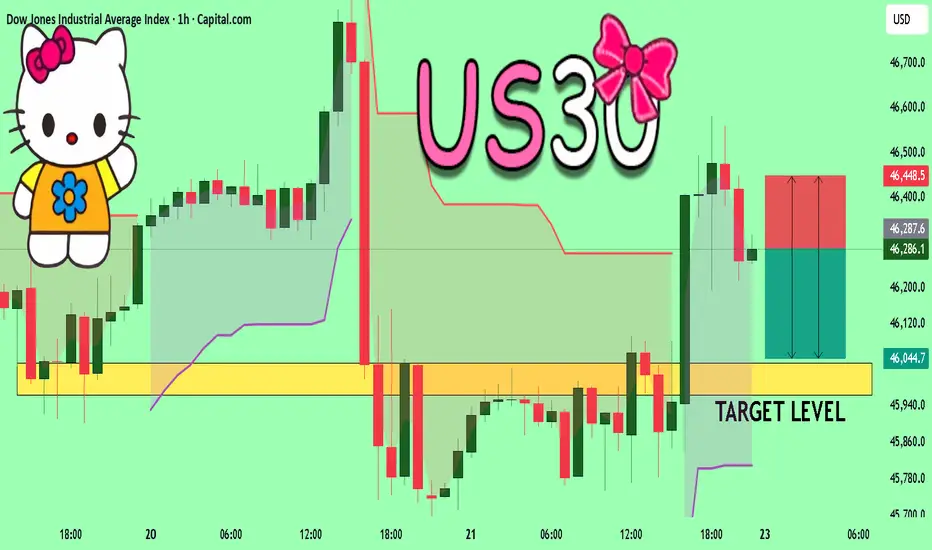
US30 BEARS ARE GAINING STRENGTH|SHORT
US30 SIGNAL
Trade Direction: short
Entry Level: 46,264.6
Target Level: 45,574.0
Stop Loss: 46,722.1
RISK PROFILE
Risk level: medium
Suggested risk: 1%
Timeframe: 4h
Disclosure: I am part of Trade Nation's Influencer program and receive a monthly fee for using their TradingView charts in my analysis.
✅LIKE AND COMMENT MY IDEAS✅

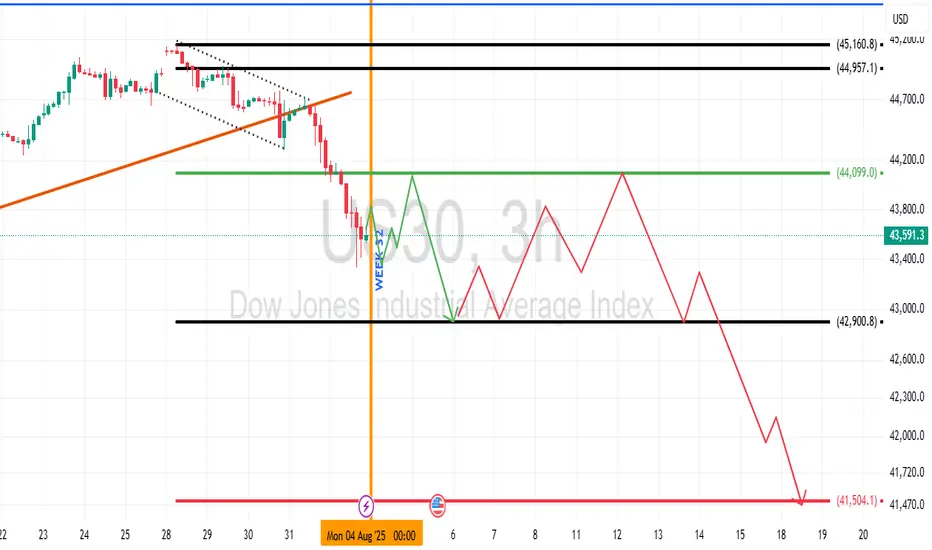
US 30 Dow Jones Industrial Average Week 32 OutlookUS 30, along with related indices, is likely to range for most of the week with early sells to confirm the support of interest. Best interest is in the bearish sentiment right now.
US30 Will Collapse! SELL!
My dear subscribers,
US30 looks like it will make a good move, and here are the details:
The market is trading on 46286 pivot level.
Bias - Bearish
My Stop Loss - 46448
Technical Indicators: Both Super Trend & Pivot HL indicate a highly probable Bearish continuation.
Target - 46034
About Used Indicators:
The average true range (ATR) plays an important role in 'Supertrend' as the indicator uses ATR to calculate its value. The ATR indicator signals the degree of price volatility.
Disclosure: I am part of Trade Nation's Influencer program and receive a monthly fee for using their TradingView charts in my analysis.
———————————
WISH YOU ALL LUCK
US30 Trade Set Up Nov 21 2025As of right now price is in a range so i want to see internal structure form first to either sweep BSL followed but 1m-5m CISD/IFVG to target lows again or a push higher to fill 4h FVG

US30 H4 | Bearish Reaction off Key ResistanceMomentum: Bearish
Price is currently below the ichimoku cloud, and has broken past the ascending trendline.
Sell entry: 46,971.5
- Strong pullback resistance
- 38.2% Fib retracement
- Fair value gap
Stop Loss: 47,450.69
- Overlap resistance
Take Profit: 46,041.13
- Multi-swing low support
High Risk Investment Warning
Stratos Markets Limited (tradu.com/uk ), Stratos Europe Ltd (tradu.com/eu ):
CFDs are complex instruments and come with a high risk of losing money rapidly due to leverage. 70% of retail investor accounts lose money when trading CFDs with this provider. You should consider whether you understand how CFDs work and whether you can afford to take the high risk of losing your money.
Stratos Global LLC (tradu.com/en ): Losses can exceed deposits.
Please be advised that the information presented on TradingView is provided to Tradu (‘Company’, ‘we’) by a third-party provider (‘TFA Global Pte Ltd’). Please be reminded that you are solely responsible for the trading decisions on your account. Any information and/or content is intended entirely for research, educational and informational purposes only and does not constitute investment or consultation advice or investment strategy. The information is not tailored to the investment needs of any specific person and therefore does not involve a consideration of any of the investment objectives, financial situation or needs of any viewer that may receive it. Past performance is not a reliable indicator of future results. Actual results may differ materially from those anticipated in forward-looking or past performance statements. We assume no liability as to the accuracy or completeness of any of the information and/or content provided herein and the Company cannot be held responsible for any omission, mistake nor for any loss or damage including without limitation to any loss of profit which may arise from reliance on any information supplied by TFA Global Pte Ltd.

US30 – AI Bubble Pressure | Bearish Below 46000US30 | OVERVIEW
US30 declined on Friday as major technology stocks — including Nvidia — remained under pressure following the previous session’s sharp selloff.
Concerns over stretched AI-related valuations continued to weigh on market sentiment, despite Nvidia posting stronger-than-expected Q3 revenue and projecting an upbeat Q4 outlook.
Even with bullish forward guidance, the market is increasingly focused on the risk of an “AI bubble”, which remains the primary driver behind the decline.
US30 – Market Outlook | Bearish Below 46000
US30 declined as tech stocks came under pressure again, with concerns over a possible AI bubble overshadowing Nvidia’s strong earnings and positive guidance.
Below 46000: Bearish continuation toward 45680 → 45285 → 44950
Above 46000–46050: Short-term bullish correction toward 46250 → 46420 → 46600
Pivot: 46000
Support: 45680 · 45285 · 44950
Resistance: 46250 · 46400 · 46600
US30 remains bearish while below 46000, with only limited upside if 46050 breaks.

SPX500 ShortHello traders,
I am expecting the SPX500 to see a potential 20% correction. Current sentiment appears mixed while valuations remain elevated, which increases downside risk. This view also aligns with the technical setup:
On the weekly timeframe, price is respecting a well-defined channel.
On the daily timeframe, a double-top pattern has just formed, suggesting possible trend exhaustion.
Not financial advice, just sharing my market perspective.

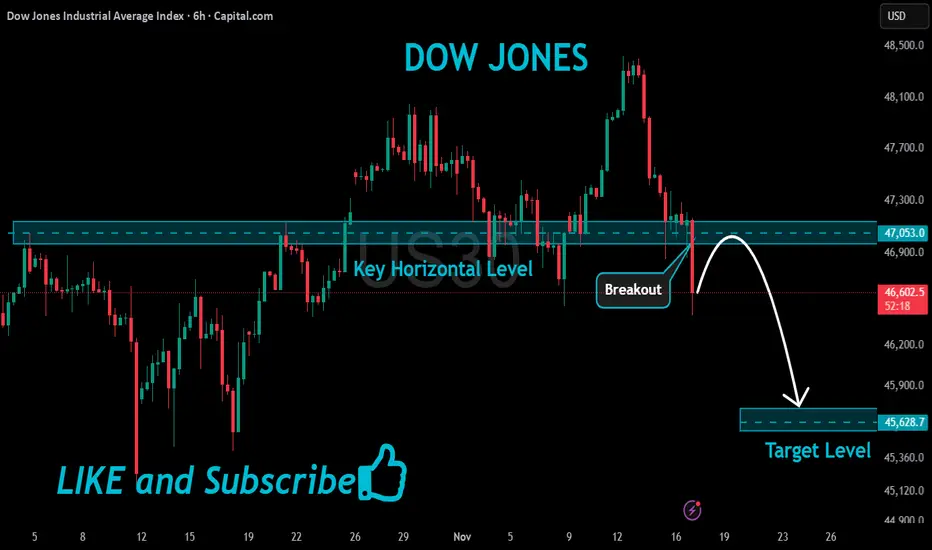
US30 Bearish Breakout!
HI,Traders !
#US30 made a bearish
Breakout of the key horizontal
Level of 47053.0 and the
Breakout is confirmed
So we are bearish biased
And we will be expecting
A further bearish move down !
Comment and subscribe to help us grow !
The us30-dow jones could have a drop.Dow Jones could experience a drop at the specified price, so look for confirmation according to the drawn schematic, and you could make a nice trade.
Make sure to get confirmation.
US30 Trade Secured 2500 Pipsprice manipulated higher into daily FVG and sweeping BSL to then engulf and BOS to the downside to target PDL

XRP HOLIDAY SALE!The overall crypto market has been sliding off recent highs since late September. This was after crypto markets created gap structures on the October 10th sell off. The gap left on XRP was priced in near $1.99-$1.98. We have just reached this liquidity zone. I expect fear to boost and bears to be trapped as the crypto season approaches the holidays, this should be an early Black Friday sale to new highs toward $4 and higher.
Happy Thanksgiving and Early Christmas
-This is not financial advice, R2C.

Us30 before NFP newsMy directional bias was bullish according to how yesterday's Daily candle closed and the change of trend

US30 Trade Set Up Nov 20 2025Over all im still bearish for indices so i want to see a sweep of BSL and tap into fib levels to then wait for for 5m-15m bearish engulfing and CISD/IVFG to target SSL/PDL

US30 Trade Secured 1500 PipsSet up played out perfectly, BOS on the 1h, sweep SSL, 5m IFVG and engulfing candle to move up towards BSL
