SPX500 ShortHello traders,
I am expecting the SPX500 to see a potential 20% correction. Current sentiment appears mixed while valuations remain elevated, which increases downside risk. This view also aligns with the technical setup:
On the weekly timeframe, price is respecting a well-defined channel.
On the daily timeframe, a double-top pattern has just formed, suggesting possible trend exhaustion.
Not financial advice, just sharing my market perspective.
D-US30

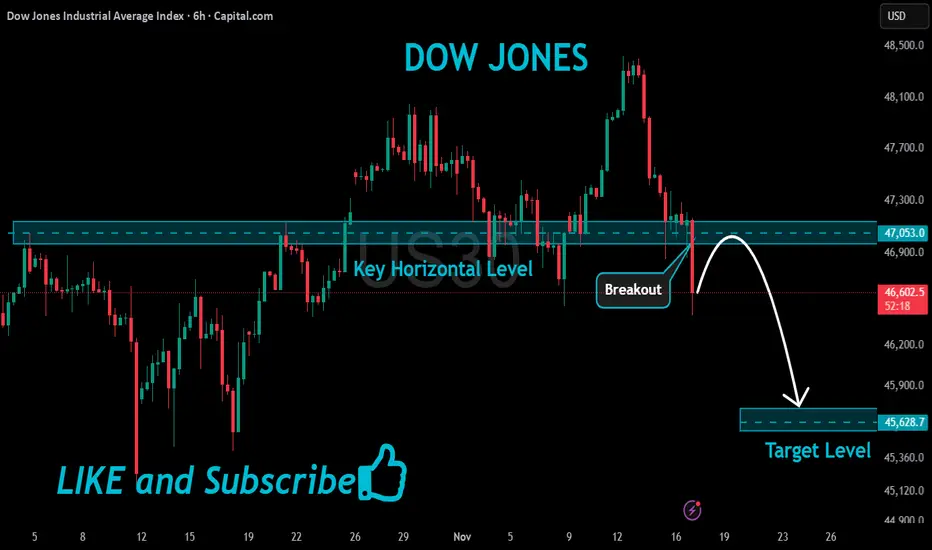
US30 Bearish Breakout!
HI,Traders !
#US30 made a bearish
Breakout of the key horizontal
Level of 47053.0 and the
Breakout is confirmed
So we are bearish biased
And we will be expecting
A further bearish move down !
Comment and subscribe to help us grow !
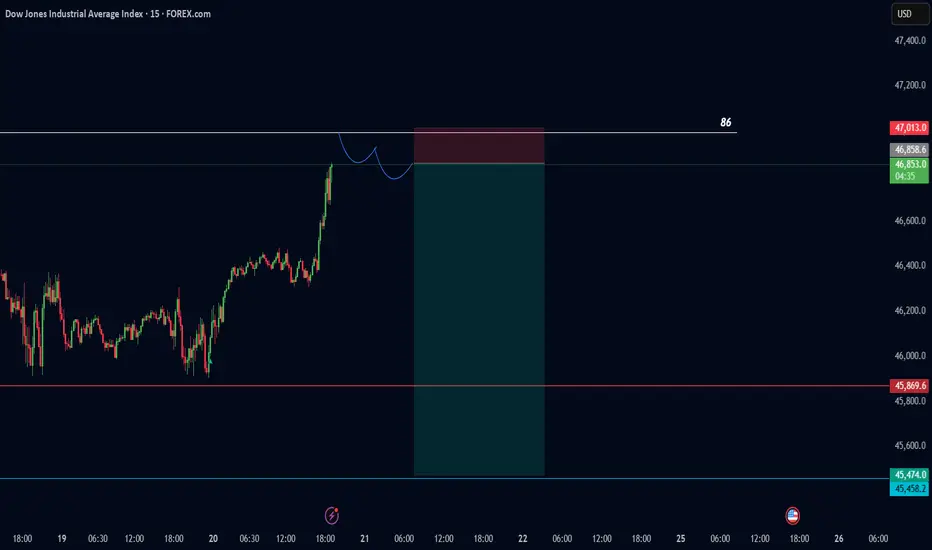
The us30-dow jones could have a drop.Dow Jones could experience a drop at the specified price, so look for confirmation according to the drawn schematic, and you could make a nice trade.
Make sure to get confirmation.
US30 Trade Secured 2500 Pipsprice manipulated higher into daily FVG and sweeping BSL to then engulf and BOS to the downside to target PDL

XRP HOLIDAY SALE!The overall crypto market has been sliding off recent highs since late September. This was after crypto markets created gap structures on the October 10th sell off. The gap left on XRP was priced in near $1.99-$1.98. We have just reached this liquidity zone. I expect fear to boost and bears to be trapped as the crypto season approaches the holidays, this should be an early Black Friday sale to new highs toward $4 and higher.
Happy Thanksgiving and Early Christmas
-This is not financial advice, R2C.

Us30 before NFP newsMy directional bias was bullish according to how yesterday's Daily candle closed and the change of trend

US30 Trade Set Up Nov 20 2025Over all im still bearish for indices so i want to see a sweep of BSL and tap into fib levels to then wait for for 5m-15m bearish engulfing and CISD/IVFG to target SSL/PDL

US30 Trade Secured 1500 PipsSet up played out perfectly, BOS on the 1h, sweep SSL, 5m IFVG and engulfing candle to move up towards BSL

US30 Trade Set Up Nov 19 2025Us30 is still in a overall bearish trend but there is a lot of daily imbalance above that needs to be filled eventually if we sweep SSL and stay closed above, i will look for internal 1m-5m IFVG/CISD to target BSL/PDH

DOW JONES Will the 1D MA100 save the day?Dow Jones (DJI) has been trading within a 6-month Channel Up and in the past 4 days it has been correcting on its latest Bearish Leg. By doing so, it broke below the 1D MA50 (blue trend-line) and is approaching the 1D MA100 (green trend-line) right at the bottom of the pattern.
This is the Channel's last Support. As long as it closes the daily candles above it, we will be bullish on Dow, targeting 49000, which represents a +7.25% rise, something all previous 3 Bullish Legs did.
---
** Please LIKE 👍, FOLLOW ✅, SHARE 🙌 and COMMENT ✍ if you enjoy this idea! Also share your ideas and charts in the comments section below! This is best way to keep it relevant, support us, keep the content here free and allow the idea to reach as many people as possible. **
---
💸💸💸💸💸💸
👇 👇 👇 👇 👇 👇

US30 Trade Set Up Nov 18 2025Price is showing strong bearish movement, creating LL/LH on the 1h and 15m and has BOS on the 15m so first id want to see price sweep internal BSL and tap into 15m or 1h FVG before looking for a continuation back down to lower SSL and 4h FVG

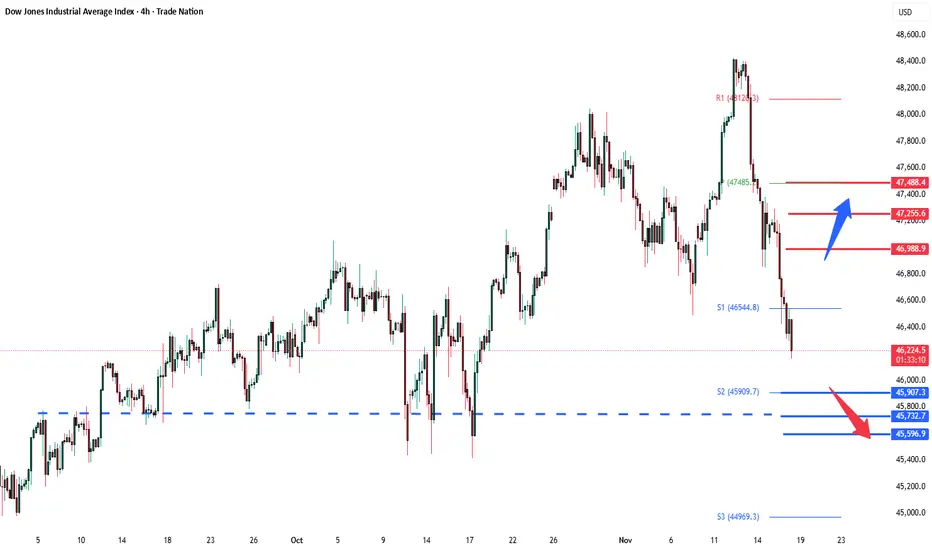
DowJones Key Trading LevelsKey Support and Resistance Levels
Resistance Level 1: 46988
Resistance Level 2: 47255
Resistance Level 3: 47488
Support Level 1: 45907
Support Level 2: 45732
Support Level 3: 45600
This communication is for informational purposes only and should not be viewed as any form of recommendation as to a particular course of action or as investment advice. It is not intended as an offer or solicitation for the purchase or sale of any financial instrument or as an official confirmation of any transaction. Opinions, estimates and assumptions expressed herein are made as of the date of this communication and are subject to change without notice. This communication has been prepared based upon information, including market prices, data and other information, believed to be reliable; however, Trade Nation does not warrant its completeness or accuracy. All market prices and market data contained in or attached to this communication are indicative and subject to change without notice.
us30 bullishDow Jones can start its bullish move from 46,411 toward 46,681, keeping in mind the critical level at 46,298. CMCMARKETS:US30

Dow Jones - Looking To Sell Pullbacks In The Short TermH1 - Strong bearish move.
No opposite signs.
Expecting bearish continuation until the two Fibonacci resistance zones hold.
If you enjoy this idea, don’t forget to LIKE 👍, FOLLOW ✅, SHARE 🙌, and COMMENT ✍! Drop your thoughts and charts below to keep the discussion going. Your support helps keep this content free and reach more people! 🚀
-------------------------------------------------------------------------------------------------------------------

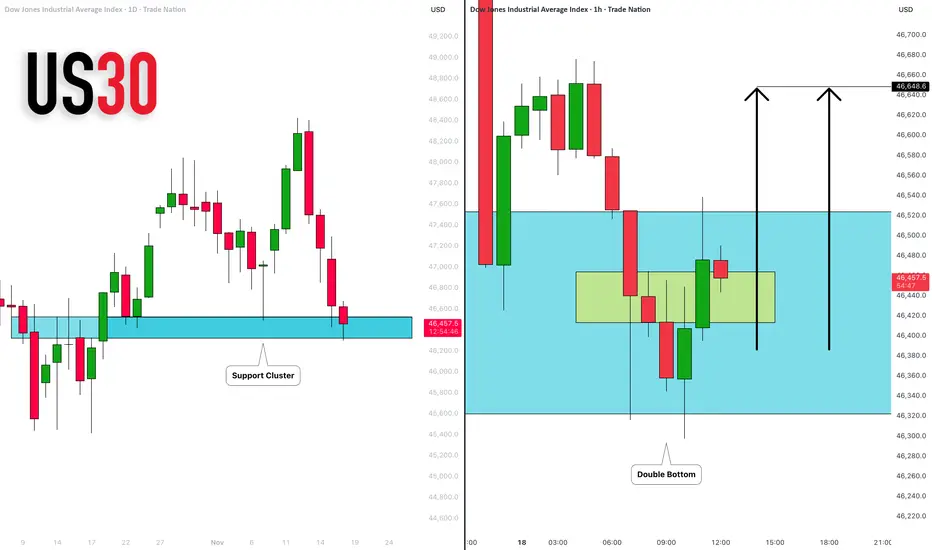
DOW JONES INDEX (US30): Time to Buy?!
It feels like US30 has finally found a bottom.
I see a strong buying interest after a test of a key
historic support cluster.
I anticipate a pullback at least to 46648
❤️Please, support my work with like, thank you!❤️
I am part of Trade Nation's Influencer program and receive a monthly fee for using their TradingView charts in my analysis.
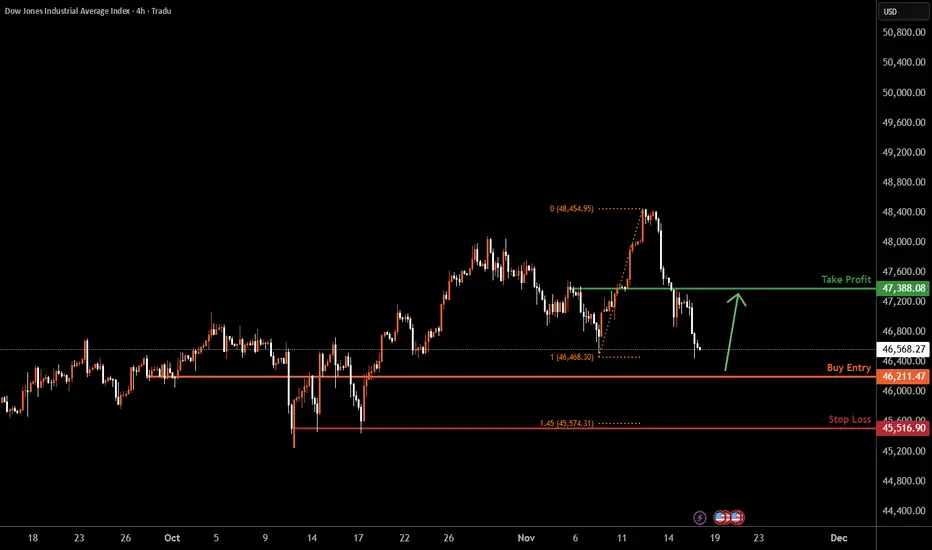
US30 H4 | Bullish Reversal SetupMomentum: Bullish
The price is currently retracing toward the buy entry, which aligns with a key pullback support level.
Buy Entry: 46,211.47
Pullback support
Stop Loss: 45,516.00
Multi swing-low support
145% Fibonacci extension
Take Profit: 47,388.08
Pullback resistance
High Risk Investment Warning
Stratos Markets Limited (tradu.com ), Stratos Europe Ltd (tradu.com ):
CFDs are complex instruments and come with a high risk of losing money rapidly due to leverage. 70% of retail investor accounts lose money when trading CFDs with this provider. You should consider whether you understand how CFDs work and whether you can afford to take the high risk of losing your money.
Stratos Global LLC (tradu.com ): Losses can exceed deposits.
Please be advised that the information presented on TradingView is provided to Tradu (‘Company’, ‘we’) by a third-party provider (‘TFA Global Pte Ltd’). Please be reminded that you are solely responsible for the trading decisions on your account. Any information and/or content is intended entirely for research, educational and informational purposes only and does not constitute investment or consultation advice or investment strategy. The information is not tailored to the investment needs of any specific person and therefore does not involve a consideration of any of the investment objectives, financial situation or needs of any viewer that may receive it. Past performance is not a reliable indicator of future results. Actual results may differ materially from those anticipated in forward-looking or past performance statements. We assume no liability as to the accuracy or completeness of any of the information and/or content provided herein and the Company cannot be held responsible for any omission, mistake nor for any loss or damage including without limitation to any loss of profit which may arise from reliance on any information supplied by TFA Global Pte Ltd.
US30 FREE SIGNAL|LONG|
✅US30 taps a key demand zone after a clean liquidity sweep, signaling potential displacement higher. If bullish orderflow sustains, a premium retracement toward the target zone is likely.
—————————
Entry: 46,590
Stop Loss: 46,408
Take Profit: 46,808
Time Frame: 4H
—————————
LONG🚀
✅Like and subscribe to never miss a new idea!✅

US30 Trade Set Up Nov 17 2025Price has left a daily FVG that will need to be filled this week but first i want to see a sweep of SSL or PDL followed by internal 1m-5m IFVG/CISD to target BSL

Bull US30We have the HL arround price level 46,952 created from last week correction. So price maintains its bull structure.
But we still have a resistance level around 47,298 . If price breaks through our bullish trade will be activated.
Let's keep an eye on any high impact news.

US500 slipped on AI-bubble fears and the Hawkish Fed
Stocks weakened last week as the Fed’s revived hawkish tone and mounting concerns over stretched AI valuations outweighed strong earnings from major AI names.
Despite upbeat 3Q results, fears of an AI bubble continued to build. AMD CEO Su highlighted insatiable demand for AI chips, projecting the data-center market to reach 1tln USD by 2030 and forecasting an average annual growth rate of 35% for AMD over the next five years.
Morgan Stanley warned of an impending power shortage within a year as AI expansion accelerates. while Microsoft CEO Nadella pointed out that the biggest bottleneck is not compute capacity but power, noting that parts of the company’s GPU inventory lack sufficient power connectivity.
US500 briefly retested the support at 6650 before rebounding. EMA21 has death-crossed EMA78, indicating a potential shift toward a bearish structure.
If US500 fails to close above the support at 6700, the index could retreat toward 6650. Conversely, if US500 breaches above both EMAs and the resistance at 6800, the index may advance toward the following resistance at 6920.

US30 LongsBias: Bullish continuation, but with caution given proximity to resistance.
Setup: If price breaks cleanly above the resistance zone with momentum (i.e., a strong bullish candle, minimal wick, decent follow-through) then a long entry is justified. Entry could be placed just above the breakout candle high.
Alternative: If price rejects the resistance zone (e.g., bearish pin bar, engulfing candle, then broken trendline) then a short counter-trend trade might be viable — but only for experienced traders with tight risk control, because the broader trend is still up.
Stop-loss: For the long trade, consider placing a stop just below the breakout candle low or below the trendline pivot, whichever is tighter. For the short trade, a stop above the recent swing high/resistance zone.
Target: For the long trade, the next logical target is the next major supply area (perhaps historical highs or measured move from the consolidation). For the short trade, target near the trendline support or prior swing lows.
The chart shows a clear uptrend over the intermediate term, with a series of higher highs and higher lows.
Price has respected key structure zones (off the weekly and daily frames) and is now approaching a significant resistance region.
Volume data is not shown, but the price action suggests momentum has been backing this move (i.e., relatively strong candles, visible follow-through after retests).

US30 - Corrective Drop Completed? Next Push Up AheadUS30 has pulled back sharply and is now forming a corrective structure near the lows.
If the current sub-waves continue to align, the next leg could be an impulsive push upward to complete the broader wave pattern. Short-term fluctuations are expected, but the wave structure as a whole still favours an upward continuation once the correction is fully completed.
Disclosure: We are part of Trade Nation's Influencer program and receive a monthly fee for using their TradingView charts in our analysis.

US30: Growth & Bullish Continuation
The price of US30 will most likely increase soon enough, due to the demand beginning to exceed supply which we can see by looking at the chart of the pair.
Disclosure: I am part of Trade Nation's Influencer program and receive a monthly fee for using their TradingView charts in my analysis.
❤️ Please, support our work with like & comment! ❤️
