EURJPY: Likely to Continue HigherMomentum on EURJPY was clearly bullish. Then price began to compress into a triangle.
And here’s the key: price has now broken above it with strength.
That breakout candle confirms that bullish momentum will resume.
From here, the projection is measured from the base of the triangle and extended upward from the breakout. That would be around 177.350
Daily Charts

Gold 1H – Inflation Fears & Risk Flows Drive MomentumGold on the 1H timeframe is trading around 3,753 after repeated BOS confirmations, showing strong bullish structure but facing premium resistance. Liquidity remains stacked above 3,787–3,785, while discount demand zones sit lower at 3,725–3,723 and deeper at 3,688–3,686.
Today’s headlines on sticky U.S. inflation expectations and renewed geopolitical tensions in Eastern Europe are fueling safe-haven demand, but intraday structure suggests engineered sweeps into resistance before retracement into demand zones.
________________________________________
📌 Key Structure & Liquidity Zones (1H):
• 🔴 SELL SCALP 3,787–3,785 (SL 3,794): Premium resistance where liquidity sweeps may trigger short-term rejections targeting 3,780 → 3,775 → 3,770.
• 🟢 BUY ZONE 3,725–3,723 (SL 3,718): Pullback entry aligned with BOS structure, offering upside targeting 3,740 → 3,755 → 3,770+.
• 🟢 BUY ZONE 3,688–3,686 (SL 3,680): Deeper discount demand, attractive for dip buys targeting 3,700 → 3,715 → 3,730+.
________________________________________
📊 Trading Ideas (Scenario-Based):
🔺 Buy Setup – Pullback Entry (3,725–3,723)
• Entry: 3,725–3,723
• Stop Loss: 3,718
• Take Profits:
TP1: 3,740
TP2: 3,755
TP3: 3,770+
🔺 Buy Setup – Discount Demand (3,688–3,686)
• Entry: 3,688–3,686
• Stop Loss: 3,680
• Take Profits:
TP1: 3,700
TP2: 3,715
TP3: 3,730+
🔻 Sell Setup – Liquidity Run (3,787–3,785)
• Entry: 3,787–3,785
• Stop Loss: 3,794
• Take Profits:
TP1: 3,780
TP2: 3,775
TP3: 3,770
________________________________________
🔑 Strategy Note
With inflation concerns heating up and geopolitical risks sustaining safe-haven flows, the broader trend remains bullish. Smart money may engineer stop-runs into premium resistance before retracements into discount zones. Focus on buy-the-dip opportunities at well-defined supports, while fading liquidity sweeps cautiously near 3,787–3,785. Expect intraday volatility as markets react to U.S. inflation chatter and risk-off headlines.

Gold 1H – Should We Hold or Fade Liquidity at 3800?Gold on the 1H timeframe is trading near 3,776 within a corrective channel, with premium liquidity stacked above 3,800–3,798 and discount demand waiting at 3,725–3,727. Recent BOS structures confirm bullish intent, but engineered sweeps into premium zones remain likely before retracements to discount levels.
Today’s headlines on the Federal Reserve’s cautious tone and Middle East geopolitical tensions are reinforcing safe-haven demand, though intraday moves may produce liquidity grabs before directional clarity emerges.
________________________________________
📌 Key Structure & Liquidity Zones (1H):
• 🔴 SELL GOLD LIQUIDITY 3,800–3,798 (SL 3,807): Premium resistance where sweeps may trigger rejection toward 3,770 → 3,760 → 3,755.
• 🟢 BUY ZONE 3,725–3,727 (SL 3,720): Discount demand aligned with BOS, offering upside targets at 3,740 → 3,760 → 3,775.
________________________________________
📊 Trading Ideas (Scenario-Based):
🔻 Sell Setup – Liquidity Run (3,800–3,798)
• Entry: 3,800–3,798
• Stop Loss: 3,807
• Take Profits:
TP1: 3,770
TP2: 3,760
TP3: 3,755
🔺 Buy Setup – Discount Demand (3,725–3,727)
• Entry: 3,725–3,727
• Stop Loss: 3,720
• Take Profits:
TP1: 3,740
TP2: 3,760
TP3: 3,775+
________________________________________
🔑 Strategy Note
With Fed caution and geopolitical risks keeping gold supported, the broader structure favors buy-the-dip setups while fading engineered sweeps into premium liquidity. Expect volatility around 3,800 liquidity runs before retracements to well-defined discount zones.

Gold 1H – Fed Signals & Geopolitics Keep Bulls ActiveGold on the 1H timeframe is trading near 3,705–3,710 after a strong BOS, holding inside a rising channel. Liquidity is stacked above at the premium resistance zone around 3,716–3,718, while demand sits lower at 3,687–3,689 and deeper at the FVG zone 3,654–3,656. Recent Fed dovish signals following last week’s rate cut, along with escalating geopolitical tensions, continue to support safe-haven demand. However, upcoming U.S. inflation data and Fed speakers could spark engineered sweeps into premium supply before retracements into discount demand zones.
________________________________________
📌 Key Structure & Liquidity Zones (1H):
• 🔴 SELL ZONE 3,718–3,716 (SL 3,725): Premium resistance where liquidity sweeps may trigger short-term rejections targeting 3,710 → 3,700 → 3,690 .
• 🟢 BUY ZONE 3,687–3,689 (SL 3,680): Near-term demand zone aligned with channel structure, offering a pullback entry targeting 3,695 → 3,700 → 3,715+.
• 🟢 FVG BUY ZONE 3,654–3,656 (SL 3,647): Deeper discount support, attractive for longer setups targeting 3,670 → 3,685 → 3,700+.
________________________________________
📊 Trading Ideas (Scenario-Based):
🔺 Buy Setup – Pullback to Demand (3,687–3,689)
• Entry: 3,687–3,689
• Stop Loss: 3,680
• Take Profits:
TP1: 3,695
TP2: 3,700
TP3: 3,715+.
🔺 Buy Setup – FVG Sweep (3,654–3,656)
• Entry: 3,654–3,656
• Stop Loss: 3,647
• Take Profits:
TP1: 3,670
TP2: 3,685
TP3: 3,700+
🔻 Sell Setup – Premium Liquidity Run (3,716–3,718)
• Entry: 3,718–3,716
• Stop Loss: 3,725
• Take Profits:
TP1: 3,710
TP2: 3,700
TP3: 3,690.
________________________________________
🔑 Strategy Note
The Fed’s dovish tilt and safe-haven flows from geopolitical risks are sustaining bullish momentum, but intraday structure suggests smart money may first engineer stop-runs into premium resistance before retracing toward demand. Maintain buy-the-dip bias at defined support zones, while fading liquidity sweeps near 3,716–3,718 with caution. Volatility could increase as markets await fresh U.S. inflation data and Fed policy remarks.

BTC H&S IN PROGRESS. WATCH FOR BULLISH SIGNS AROUND $111.3KMorning folks,
So, everything has happened as we discussed last time. Minor H&S led us to the big one. And now price stands at the point, where it has to either start working or to fail. And for any trader, who would like to trade this pattern, it is a decision making moment.
Thus, drop your time frame to 15 min chart and watch for market reaction around 111.3K support. If we get any bullish patterns there, then it is possible to try. Conversely, if H&S will fail - BTC probably will drop down to 100K area.
Unfortunately currently I can't exactly tell whether this H&S will work or not, just because price has touched support level a few minutes ago. It needs time to show a reaction. Although fast drop is not good for bullish reversal pattern, but it not always leads to failure.
I mark this idea as "bullish" but with some advance and mostly due to its nature. For position taking we still need clear patterns on lower time frames.

A descending channel/bullflag reveals itself on btcusdThe pole looks more obvious on longer timeframe charts but the flag/ channel itself is best illustrated on the 1day time frame. In fact there is a much longer pole than the one shown here on the monthly chart, but I didn’t go with that one because the flag on the monthly is more of a horizontal channel than the descending channel shown here on the 1day chart. *not financial advice*

Gold 1H – Premium Sweeps Risk Before ReversalGold on the 1H chart is consolidating after consecutive BOS and ChoCH signals, showing rejection from premium levels. Price is balancing between the fresh FVG sell zone near 3,673–3,671 and deep discount support at 3,634–3,636. Liquidity remains stacked above 3,705 and below 3,632, leaving room for engineered sweeps before direction is confirmed.
________________________________________
📌 Key Structure & Liquidity Zones (1H):
• 🔴 FVG SELL ZONE 3,673 – 3,671 (SL 3,680)
Premium intraday pocket for rejection targeting 3,660 → 3,650 → 3,640.
• 🔴 SELL GOLD LIQUIDITY 3,705 – 3,703 (SL 3,712)
Major premium liquidity trap before continuation lower toward 3,690 → 3,675 → 3,660.
• 🟢 BUY GOLD SUPPORT 3,634 – 3,636 (SL 3,627)
Discount demand zone, targeting recovery into 3,645 → 3,660 → 3,670 if defended.
________________________________________
📊 Trading Ideas (Scenario-Based):
🔻 Sell Setup – FVG Rejection (3,673–3,671)
• Entry: 3,673 – 3,671
• Stop Loss: 3,680
• Take Profits:
TP1: 3,660
TP2: 3,650
TP3: 3,640
👉 Expect engineered liquidity grab into FVG before downside extension.
🔻 Sell Setup – Premium Liquidity Sweep (3,705–3,703)
• Entry: 3,705 – 3,703
• Stop Loss: 3,712
• Take Profits:
TP1: 3,690
TP2: 3,675
TP3: 3,660
👉 Smart money may sweep highs near 3,705 before resuming bearish momentum.
🔺 Buy Setup – Discount Reversal (3,634–3,636)
• Entry: 3,634 – 3,636
• Stop Loss: 3,627
• Take Profits:
TP1: 3,645
TP2: 3,660
TP3: 3,670
👉 High R:R setup if gold defends discount demand; ideal for counter-trend scalps.
________________________________________
🔑 Strategy Note
Gold remains pressured below 3,673–3,705, favoring short setups into premium sweeps. However, watch closely for accumulation signs at 3,634–3,636 as buyers may reclaim structure. Best approach: scale in smaller positions until NY session confirms directional bias.

Gold 1H – Retail Sales Impact Before FedGold on the 1H timeframe is trading near 3,682 after a strong BOS. Liquidity is now stacked above the premium resistance at 3,700 and below the fresh FVG demand at 3,669–3667. With U.S. Retail Sales scheduled today at 19:30 VN time, volatility may spike intraday, but broader positioning remains cautious ahead of the Fed’s rate decision this week. Expect engineered sweeps into premium before retracements back into demand.
________________________________________
📌 Key Structure & Liquidity Zones (1H):
• 🔴 SELL ZONE 3,700 – 3,698 (SL 3,707): Premium resistance for engineered sweep/rejection targeting 3,690 → 3,680 → 3,670.
• 🟢 FVG BUY ZONE 3,669 – 3,667 (SL 3,660): Fair Value Gap demand aligned with retracement into structure, targeting 3,680 → 3,690 → 3,700+.
• 🟢 BUY SUPPORT 3,641 – 3,639 (SL 3,632): Deep discount support zone targeting 3,655 → 3,670 → 3,685+.
________________________________________
📊 Trading Ideas (Scenario-Based):
🔺 Buy Setup – FVG Reclaim (3,669–3,667)
• Entry: 3,669 – 3,667
• Stop Loss: 3,660
• Take Profits:
TP1: 3,680
TP2: 3,690
TP3: 3,700+
👉 Look for a liquidity sweep into the FVG zone before New York open.
🔺 Buy Setup – Discount Sweep (3,641–3,639)
• Entry: 3,641 – 3,639
• Stop Loss: 3,632
• Take Profits:
TP1: 3,655
TP2: 3,670
TP3: 3,685+
👉 Strong R:R if price hunts stops below structure before Retail Sales data.
🔻 Sell Setup – Premium Liquidity Run (3,700–3,698)
• Entry: 3,700 – 3,698
• Stop Loss: 3,707
• Take Profits:
TP1: 3,690
TP2: 3,680
TP3: 3,670
👉 Expect engineered stop-runs into premium supply before fading lower.
________________________________________
🔑 Strategy Note
Retail Sales may provide short-term volatility, but Fed expectations will dominate the week. Smart money is likely to run both sides of liquidity: fading premium near 3,700–3,698 while protecting buys at 3,669–3,667 and 3,641–3,639. Trade with reduced size and confirm structure on H1 closes.

BE AWARE OF 118K BTC REVERSALMorning folks,
here is just a light update on situation. BTC now stands at 118K resistance area and here it could either to keep going higher, or, start forming the right arm of our bigger H&S pattern.
Just watch for signs of reversal, say H&S pattern here is possible. Depending on what you want to do - either wait (if you bullish) or you could use it (bearish).

Gold 1H – Dollar Strength Weighs Ahead of US DataGold on the 1H chart is testing deeper demand zones near 3,612–3,614 after repeated liquidity sweeps into 3,678 and 3,702. Sellers continue to defend premium supply, with engineered stop-runs fading quickly. Today’s US data releases and renewed dollar strength keep gold vulnerable to further downside unless discount demand zones show strong defense.
________________________________________
📌 Key Structure & Liquidity Zones (1H):
• 🔴 SELL SCALP 3,678 – 3,680 (SL 3,685)
Premium intraday pocket for rejection targeting 3,675 → 3,670 → 3,665.
• 🔴 SELL ZONE 3,704 – 3,702 (SL 3,711)
Major premium supply trap for engineered sweep before continuation lower toward 3,670 → 3,655 → 3,640.
• 🟢 BUY GOLD SUPPORT 3,616 – 3,618 (SL 3,610)
Fresh deep discount demand zone, targeting recovery into 3,630 → 3,645 → 3,655+ if defended.
________________________________________
📊 Trading Ideas (Scenario-Based):
🔻 Sell Setup – Intraday Premium Rejection (3,678–3,680)
• Entry: 3,678 – 3,680
• Stop Loss: 3,685
• Take Profits:
TP1: 3,675
TP2: 3,670
TP3: 3,665
👉 Expect engineered liquidity grab into premium before NY session.
🔻 Sell Setup – Higher Premium Trap (3,704–3,702)
• Entry: 3,704 – 3,702
• Stop Loss: 3,711
• Take Profits:
TP1: 3,670
TP2: 3,655
TP3: 3,640
👉 Smart money may sweep highs near 3,704 before extending bearish leg.
🔺 Buy Setup – Discount Reversal (3,612–3,614)
• Entry: 3,616 – 3,618
• Stop Loss: 3,610
• Take Profits:
TP1: 3,630
TP2: 3,645
TP3: 3,655+
👉 Strong bounce potential if dollar retraces post-data; favorable risk/reward from deep demand.
________________________________________
🔑 Strategy Note
With US data and dollar strength in focus, gold remains heavy below 3,678–3,704. Favor short setups into premium sweeps, but monitor 3,612–3,614 closely for signs of accumulation. Trade smaller size until direction clarifies post-news.

Gold 1H – Fed Decision Looms After $3,700 BreakGold on the 1H timeframe is consolidating around 3,675 after sweeping the historic $3,700 level. Price briefly tapped 3,702 before retreating into the 3,670s, showing engineered liquidity runs both sides. With the Fed policy decision due at 1 AM VN time, volatility is expected to spike. Market remains supported by easing USD, central bank flows, and geopolitical tension, but short-term positioning suggests possible liquidity grabs before a directional move.
________________________________________
📌 Key Structure & Liquidity Zones (1H):
• 🔴 SELL SCALP 3,696 – 3,694 (SL 3,703)
Premium supply pocket for engineered rejection targeting 3,690 → 3,685 → 3,680.
• 🟢 FVG BUY ZONE 3,674 – 3,665 (SL 3,660)
Fair Value Gap demand zone for retracement into structure, targeting 3,685 → 3,695 → 3,700+.
• 🟢 BUY SUPPORT 3,636 – 3,638 (SL 3,630)
Deep discount accumulation zone targeting 3,655 → 3,670 → 3,680+.
________________________________________
📊 Trading Ideas (Scenario-Based):
🔺 Buy Setup – FVG Reclaim (3,674–3,665)
• Entry: 3,674 – 3,665
• Stop Loss: 3,660
• Take Profits:
TP1: 3,685
TP2: 3,695
TP3: 3,700+
👉 Look for liquidity sweep into FVG before NY session/Fed.
🔺 Buy Setup – Deep Discount (3,636–3,638)
• Entry: 3,636 – 3,638
• Stop Loss: 3,630
• Take Profits:
TP1: 3,655
TP2: 3,670
TP3: 3,680+
👉 High R:R setup if stops hunted before Fed decision.
🔻 Sell Setup – Premium Trap (3,696–3,694)
• Entry: 3,696 – 3,694
• Stop Loss: 3,703
• Take Profits:
TP1: 3,690
TP2: 3,685
TP3: 3,680
👉 Expect engineered stop-runs into premium before fading lower.
________________________________________
🔑 Strategy Note
Gold’s break above $3,700 highlights strong bullish sentiment, but Fed decision risk means smart money may sweep liquidity both ways. Stay nimble: fade extremes at 3,696–3,694 for shorts, and defend demand at 3,674–3,665 and 3,636–3,638 for longs. Trade lighter size until post-Fed clarity.

FOMC XAUUSD: Time to hold super SELL before FOMC🟡 XAUUSD Daily Trading Plan – Ahead of FOMC
📊 Market Context
Gold (XAUUSD) has recently broken out of its accumulation/manipulation zone and is currently trading around 3,684–3,690.
Market is in bullish structure after a Change of Character (CHoCH) followed by a Break of Structure (BOS).
However, imbalances remain below current price, suggesting a potential retracement before continuation.
Liquidity pools are forming above 3,721–3,725, creating the risk of false breakouts (liquidity traps) near FOMC.
🔎 Technical Analysis (SMC Perspective)
Structure: Bullish bias on H1/H4, confirmed by higher highs and BOS.
Imbalance Zone: 3,674 → 3,664 (likely to be revisited).
Liquidity Pools:
Buy-side liquidity at 3,721–3,725 (Sell Zone).
Sell-side liquidity around 3,626–3,624 (Equal Low Zone).
🔑 Key Levels
Resistance / Sell Zone:
3,686.88 (immediate resistance)
3,721–3,725 (Liquidity Sell Zone)
Support / Buy Zones:
3,668 (Front End Buy – imbalance retest)
3,656–3,654 (Back End CP Buy Zone)
3,626–3,624 (Equal Low Liquidity Zone)
✅ Priority Scenario – BUY
Entry 1
BUY Limit: 3,668 (Front End Zone – imbalance retest)
SL: 3,661
TP: 3,690 → 3,700 → 3,721
Entry 2
BUY Limit: 3,656 – 3,654 (Back End CP Buy Zone)
SL: 3,648
TP: 3,690 → 3,700 → 3,721
Entry 3
BUY Limit: 3,626 – 3,624 (Equal Low Liquidity)
SL: 3,618
TP: 3,690 → 3,700 → 3,721
🔻 Alternative Scenario – SELL (Counter-trade)
If price reaches 3,721–3,725 (Liquidity Zone) before retesting lower buy zones → watch for rejection patterns.
SELL if bearish confirmation appears.
SL: 3,730
TP: 3,698 → 3,690 → 3,676
⚠️ Risk Management & Notes
Expect high volatility during FOMC – traps around liquidity zones are likely.
Reduce lot size before news release to mitigate risk.
Stick to confirmation entries (avoid blind buys/sells).
Main directional bias: Bullish as long as 3,648 holds.

EURUSD - Follow The Bulls Indeed!Hello TradingView Family / Fellow Traders. This is Richard, also known as theSignalyst.
📈EURUSD has been overall bullish trading within the rising channel marked in blue.
This week, EURUSD has been retesting the lower bound of the channel.
Moreover, the orange zone is a strong demand.
🏹 Thus, the highlighted blue circle is a strong area to look for buy setups as it is the intersection of the lower blue trendline and orange demand.
📚 As per my trading style:
As #EURUSD approaches the blue circle zone, I will be looking for trend-following bullish reversal setups (like a double bottom pattern, trendline break , and so on...)
📚 Always follow your trading plan regarding entry, risk management, and trade management.
Good luck!
All Strategies Are Good; If Managed Properly!
~Richard Nasr

Gold 4H Outlook – Buy the Dip or Fade the Drop?Gold on the 4H timeframe is consolidating below 3,600 after a strong bullish run. Current structure shows price resting near premium levels, with liquidity building both above 3,600 and below 3,530. This suggests engineered sweeps before the next expansion.
________________________________________
📌 Key Structure & Liquidity Zones (4H):
• 🔼 Buy Zone 3,572 – 3,574 (SL 3,565): Fresh demand zone sitting at intraday discount; potential continuation area.
• 🔽 Sell Scalp Zone 3,530 – 3,526 (SL 3,537): Short-term supply/pivot area; scalp opportunity if price rejects.
• 📍 Liquidity Magnet 3,603 – 3,605: Upside imbalance zone likely to be rebalanced.
________________________________________
📊 Trading Ideas (Scenario-Based):
🔺 Buy Setup – Demand Zone Reaction
• Entry: 3,572 – 3,574
• Stop Loss: 3,565
• Take Profits:
o TP1: 3,585
o TP2: 3,595
o TP3: 3,605
👉 Demand block aligned with bullish order flow. Look for liquidity sweep and rejection to resume trend.
________________________________________
🔻 Sell Scalp Setup – Short-Term Reaction
• Entry: 3,530 – 3,528
• Stop Loss: 3,537
• Take Profits:
o TP1: 3,520
o TP2: 3,510
o TP3: 3,500
👉 Intraday supply zone and pivot. Best used for quick scalps against trend, targeting downside liquidity.
________________________________________
🔑 Strategy Note
Bias remains bullish overall, but intraday shorts are valid for scalps. The cleaner setup is buying into 3,572–3,574 for continuation toward 3,600+. Smart money may sweep liquidity at 3,530 before reversing higher.

Gold 1H – Breakout Liquidity Trap Ahead of ExpansionGold on the 1H timeframe is consolidating near 3,652 after sweeping discount liquidity and reclaiming structure. Price has tapped into the breakout zone and is now positioned between premium scalp supply and higher liquidity pools. The structure suggests engineered plays into 3,656–3,658 or deeper liquidity toward 3,672–3,674 before expansion. Discount demand remains protected at 3,614–3,612.
________________________________________
📌 Key Structure & Liquidity Zones (1H):
• 🔴 SELL ZONE 3,672 – 3,674 (SL 3,679): Premium supply pocket for engineered rejection targeting 3,660 → 3,650 → 3,640.
• 🔴 SELL SCALP 3,656 – 3,658 (SL 3,663): Short-term premium sweep zone for intraday liquidity grabs targeting 3,645 → 3,640.
• 🟢 BUY ZONE 3,614 – 3,612 (SL 3,607): Discount demand block aligned with bullish order flow targeting 3,630 → 3,640 → 3,655.
________________________________________
📊 Trading Ideas (Scenario-Based):
🔻 Sell Setup – Premium Scalp Rejection
• Entry: 3,656 – 3,658
• Stop Loss: 3,663
• Take Profits:
TP1: 3,645
TP2: 3,640
👉 Intraday scalp opportunity if price sweeps into shallow premium liquidity.
🔻 Sell Setup – Deeper Premium Sweep
• Entry: 3,672 – 3,674
• Stop Loss: 3,679
• Take Profits:
TP1: 3,660
TP2: 3,650
TP3: 3,640
👉 Expect engineered sweep into higher premium before reversal.
🔺 Buy Setup – Discount Demand Reaction
• Entry: 3,614 – 3,612
• Stop Loss: 3,607
• Take Profits:
TP1: 3,630
TP2: 3,640
TP3: 3,655
👉 High R:R play if price retraces to protected demand before expansion.
________________________________________
🔑 Strategy Note
Smart money is likely to manipulate both premium and discount zones around the breakout point. Bias favors:
• Scalp sells at 3,656–3,658
• Swing sells at 3,672–3,674
• Discount buys at 3,614–3,612
Risk management is critical — expect liquidity sweeps both sides before real expansion.

XAUUSD Pre-Cut Rates!! Will the all time high streak continue??Gold continues to show strength after breaking above the 3,676 resistance and printing a new All-Time High at 3,686. This breakout further confirms the clear uptrend structure across all timeframes, from H4 to daily. Overall, buyers remain in control, although price is currently consolidating near the highs, likely gathering momentum for the next move.
From a technical perspective, the latest candle closed above the key zone at 3,675–3,676, which has now flipped from strong resistance into dynamic support. As long as price holds above this area, the primary bias remains bullish, with potential continuation towards 3,708 and then 3,723 as the next upside targets.
On the other hand, if a deeper pullback occurs and price fails to hold above 3,656, the door opens for a retest of lower support around 3,625. However, unless there is a confirmed reversal on the lower timeframes, the broader trend still favors the upside.
🎯 Trading Plan for Today
Buy on dip at 3,656–3,660
SL: 3,625
TP1: 3,678
TP2: 3,686
TP3: 3,708
⚠️ Avoid aggressive SELL positions unless there are clear rejection signals or strong reversal patterns on lower timeframes (M15–H1).
For traders holding long positions from lower levels, consider partial take profit around TP1–TP2 while keeping some exposure for higher targets.
📌 Key Daily Zones
R3: All-Time High
R2: 3,724
R1: 3,687
Pivot: 3,675
S1: 3,637
S2: 3,601
S3: 3,586
⚠️ Notes & CTA Suggestions
Bullish momentum remains dominant, but price is trading far from major MAs, so a short-term pullback remains possible before further upside.
Watch price action around 3,675–3,656. As long as there is no close below this support, the bullish scenario stays intact.
Be cautious of volatility during the US session and use conservative lot sizing to stay protected from sudden swings.
Always adjust SL levels according to intraday volatility to avoid being taken out by temporary moves.

Gold 1H – Fed Week: Liquidity Sweeps Before FOMCGold on the 1H timeframe is ranging around 3,643 after a series of ChoCH/BOS prints. Liquidity is stacked above the intraday buy zone at 3,658–3,656 and higher at 3,676–3,678, while discount liquidity sits near 3,615–3,613. With markets pricing a potential Fed cut this week and dot-plot guidance in focus, expect engineered spikes into premium followed by mean reversion before any sustained move.
________________________________________
📌 Key Structure & Liquidity Zones (1H):
• 🔴 SELL ZONE 3,676 – 3,678 (SL 3,683): Premium resistance for engineered sweep/rejection targeting 3,665 → 3,655 → 3,645.
• 🟢 BUY ZONE 3,658 – 3,656 (SL 3,651): Intraday demand inside prior consolidation targeting 3,665 → 3,670 → 3,675+.
• 🟢 BUY SUPPORT 3,615 – 3,613 (SL 3,610): Discount demand at the base of structure targeting 3,630 → 3,645 → 3,655+.
________________________________________
📊 Trading Ideas (Scenario-Based):
🔺 Buy Setup – Intraday Reclaim (3,658–3,656)
• Entry: 3,658 – 3,656
• Stop Loss: 3,651
• Take Profits:
TP1: 3,665
TP2: 3,670
TP3: 3,675+
👉 Look for a sweep into the zone and an H1 close back above 3,656 to confirm order-flow continuation.
🔺 Buy Setup – Deep Discount Sweep (3,615–3,613)
• Entry: 3,615 – 3,613
• Stop Loss: 3,610
• Take Profits:
TP1: 3,630
TP2: 3,645
TP3: 3,655+
👉 High R:R if liquidity runs into protected demand before New York session.
🔻 Sell Setup – Premium Sweep to Resistance (3,676–3,678)
• Entry: 3,676 – 3,678
• Stop Loss: 3,683
• Take Profits:
TP1: 3,665
TP2: 3,655
TP3: 3,645
👉 Expect stop-run above recent highs into premium; invalidate on strong H1 close above 3,683.
________________________________________
🔑 Strategy Note
Into Fed week, smart money often runs both sides of the book. Bias today favors: discount buys at 3,658–3,656 and 3,615–3,613, and a premium fade at 3,676–3,678. Use reduced size, wait for structure confirmation, and avoid holding through any unexpected Fed headlines or USD spikes.

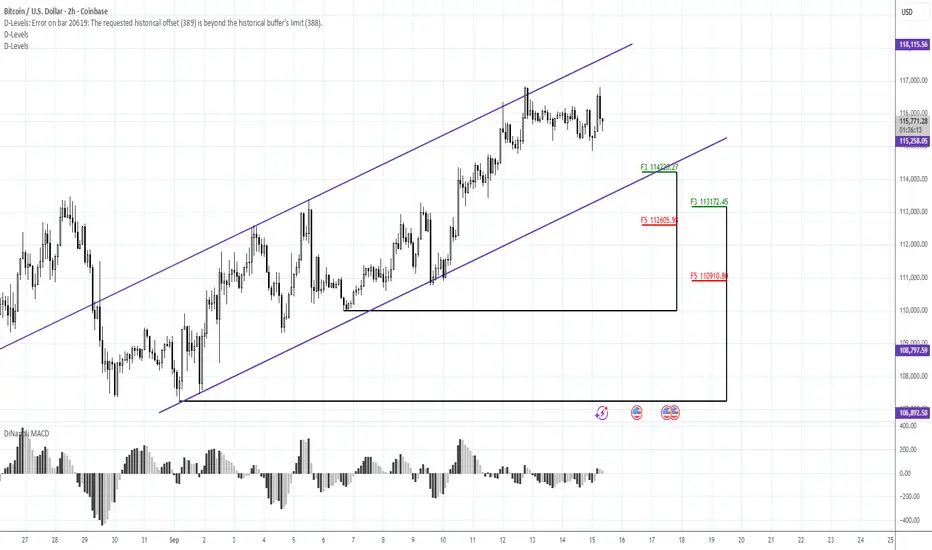
BE AWARE OF 111K BTC RETRACEMENT IF LARGER H&S STARTS FORMINGMorning folks,
So, our 116.15K target is perfectly met. What's next? First is, some quiet time should be until the Fed meeting. As market hits upside AB=CD, forming daily "222" Sell around resistance area, it is reasonable to suggest a pullback.
Normally, (before BTC proceeds to 119K target here) is to expect the pullback to nearest two levels - 114+K and 112.60-113.17K K-area as it is shown on 1H chart. But, we also do not exclude scenario of a bigger reverse H&S
So, if you will see that market is dropping further - keep an eye on 111K support. This is the last bullish outpost for short-term tendency. Drop to 111K doesn't mean yet that the upside game is over.
So, let's watch first for most common scenario of retracement, but also keep in mind 111K level. We do not consider any bearish trades for now and watch for deeps to buy.
I mark this idea as "bearish" just because of expected retracement. In general we have a bullish view.
SPY's Final Wall: The Bearish ThesisRight now, SPY is facing the most significant confluence of resistance trend lines it has seen in years. Think of this as the ultimate ceiling—a multi-layered wall that the bulls have to smash through.
The market's parabolic move has pushed the price to this critical point. But here's the thesis: the combined strength of these converging trend lines is just too much. The buying power is exhausted.
We believe this is a classic rollover setup. Instead of a breakout to new highs, we expect a strong rejection from this level. The price will hit this solid wall of resistance and turn over, leading to a significant pullback.
The current price isn't a simple pause; it's a test of strength that the bulls are likely to fail.
Day Trade/Swing Trade Idea: Short at red arrow and cover at the green arrow

Gold 1H – Demand Sweep Before Premium ExpansionGold on the 1H timeframe is consolidating near 3,644 after multiple ChoCHs, showing engineered liquidity grabs. Price has defined clear demand footprints at 3,620 and deeper at 3,593, while premium supply is stacked near 3,673–3,680. This structure suggests a possible retracement into discount zones before expansion toward premium liquidity.
________________________________________
📌 Key Structure & Liquidity Zones (1H):
• 🔼 Buy Zone 3,620 – 3,618 (SL 3,613): Fresh demand block aligned with bullish order flow.
• 🔼 Buy Zone 3,593 – 3,591 (SL 3,596): Deeper liquidity sweep, high R:R demand area.
• 🔽 Sell Zone 3,673 – 3,671 (SL 3,680): Premium supply pocket for short-term liquidity grabs.
________________________________________
📊 Trading Ideas (Scenario-Based):
🔺 Buy Setup – Shallow Demand Reaction
• Entry: 3,620 – 3,618
• Stop Loss: 3,613
• Take Profits:
TP1: 3,635
TP2: 3,650
TP3: 3,665+
👉 Expect a bounce from shallow demand before retesting premium zones.
🔺 Buy Setup – Deeper Liquidity Sweep
• Entry: 3,593 – 3,591
• Stop Loss: 3,596
• Take Profits:
TP1: 3,610
TP2: 3,625
TP3: 3,645+
👉 Ideal entry for swing traders seeking higher R:R after liquidity engineering.
🔻 Sell Setup – Premium Rejection
• Entry: 3,673 – 3,671
• Stop Loss: 3,680
• Take Profits:
TP1: 3,660
TP2: 3,650
TP3: 3,635
👉 Scalp opportunity at premium supply; bias remains bullish so manage risk tightly.
________________________________________
🔑 Strategy Note
Bias remains bullish, but smart money may engineer a dip into 3,620 or deeper 3,593 demand before expansion. Cleaner setups favor buying dips; shorts from 3,673 are counter-trend scalp plays only.

Gold 1H – CPI Liquidity Play Before ExpansionGold on the 1H timeframe is consolidating near 3,633 after multiple ChoCHs and engineered liquidity grabs. With CPI news today, price is expected to sweep both premium and discount liquidity zones. The structure suggests engineered spikes toward 3,688–3,691 or dips into 3,595–3,592 before expansion.
________________________________________
📌 Key Structure & Liquidity Zones (1H):
• 🔴 SELL ZONE 3,643 – 3,645 (SL 3,650): Premium supply pocket for short-term rejection.
• 🔴 SELL ZONE 3,688 – 3,691 (SL 3,696): Premium sweep zone targeting 3,680 → 3,670 → 3,660 → 3,650 with extended open target at 3,625.
• 🟢 BUY ZONE 3,595 – 3,592 (SL 3,587): Discount demand zone targeting 3,615 → 3,625 → 3,635 → 3,645 with extended open target at 3,685.
________________________________________
📊 Trading Ideas (Scenario-Based):
🔻 Sell Setup – Premium Rejection (Intraday)
• Entry: 3,643 – 3,645
• Stop Loss: 3,650
• Take Profits:
TP1: 3,630
TP2: 3,620
TP3: 3,600
👉 Scalp opportunity if CPI spikes price into this supply zone.
🔻 Sell Setup – CPI Premium Sweep
• Entry: 3,688 – 3,691
• Stop Loss: 3,696
• Take Profits:
TP1: 3,680
TP2: 3,670
TP3: 3,660
TP4: 3,650
Open: 3,625
👉 Expect engineered CPI move into premium liquidity before reversal.
🔺 Buy Setup – CPI Discount Sweep
• Entry: 3,595 – 3,592
• Stop Loss: 3,587
• Take Profits:
TP1: 3,615
TP2: 3,625
TP3: 3,635
TP4: 3,645
Open: 3,685
👉 Ideal entry if CPI drives gold into deep discount demand before expansion.
________________________________________
🔑 Strategy Note
CPI will dictate volatility and smart money may sweep liquidity both sides. Key bias favors:
• Scalp sells at 3,643–3,645
• Deeper swing sells at 3,688–3,691
• High R:R buys at 3,595–3,592
Risk management is essential — expect fake-outs before expansion.

116.15K is the next BTC TARGETMorning folks,
So, after two solid pullbacks out of 113.5K resistance area, BTC is decided to break it on a background of 50bp cut from the Fed next week. So, both Thu setups has worked nice. You either hold longs or out at breakeven with shorts that we have taken last week...
Anyway, we consider 116.15K as the most probable target for now, because price shape doesn't show signs of acceleration and looks more like AB=CD pullback out from 105-108K support area.
Thus, for short entry we prefer to wait when this target will be met. Long entry now theoretically could be possible, but we do not see good stop order placement that let us to turn probability in our favor. That's why, if you have longs - keep it, but price possession is not perfect for a new one, especially at the eve of CPI release...

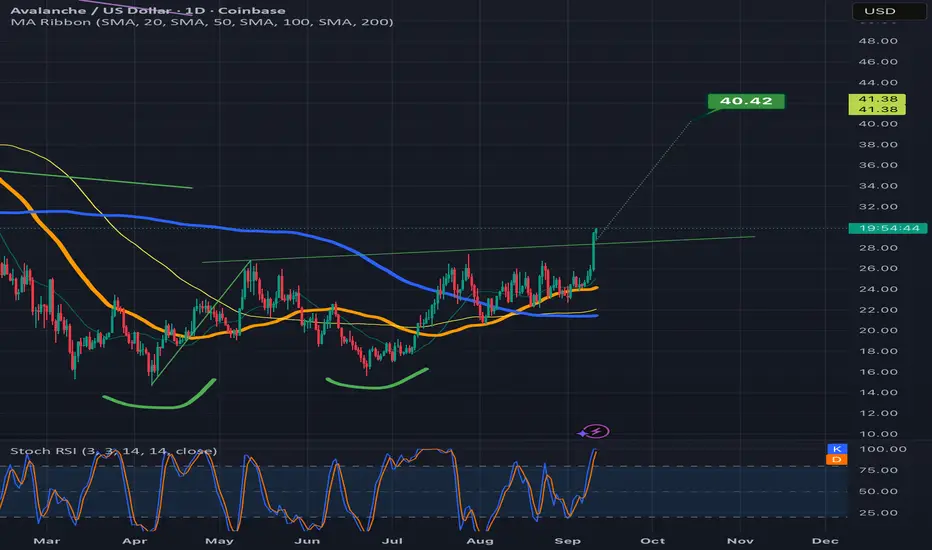
Avalanche with a close above the double bottom necklineNot sure whether it will validate the breakout here or go back below the neckline, but that was a very convincing bullish candle close above the neckline on the previous daily candle so it should give it some reasonable probability. *not financial advice*