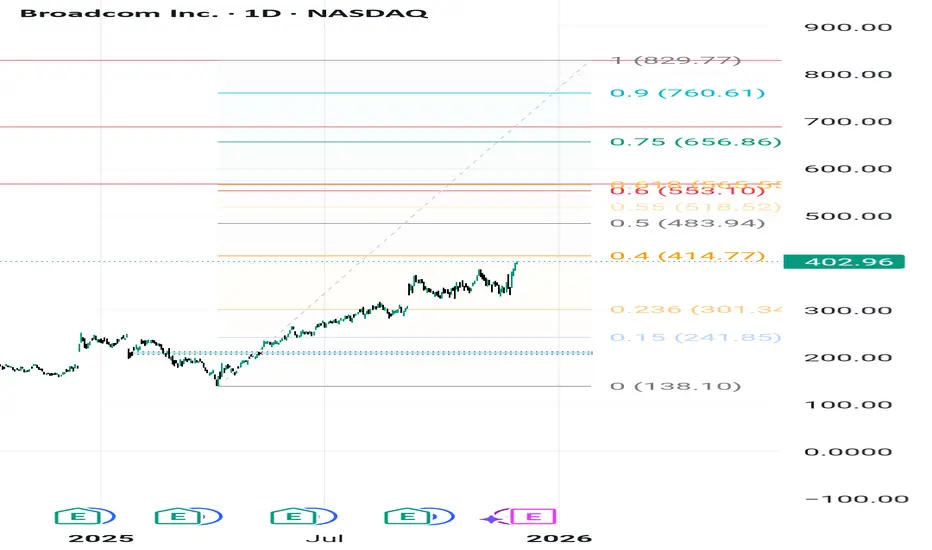
AVGO: Path to $829.77 – Navigating Critical Fibonacci Zones1. Overall Thesis and Price Structure
Broadcom Inc. (AVGO) exhibits a strong underlying bullish trend, fundamentally driven by demand for its AI chips and the successful integration of VMware. The technical objective targets a final high of $829.77. However, the path requires breaking through significant resistance levels defined by the Fibonacci structure. The current price is \mathbf{\$402.96}, maintaining the bullish momentum.
2. Crucial Resistance and Volatility Points
The analysis identifies two critical intermediate targets. The first and most significant hurdle is at $567.10, which aligns closely with the \mathbf{0.618} Fibonacci Golden Ratio. This zone is expected to trigger major volatility, profit-taking, and consolidation. The price action at $567.10 is the key test for trend continuity. Should the price break this level decisively, the next primary resistance target is $688.63, paving the way for the ultimate goal.
3. Key Support and Trend Invalidation
The long-term structural support, or the "Invalidation Point" for the bullish scenario, is the Key Zone at \mathbf{\$206.00}. As long as AVGO trades above this level, the multi-year uptrend remains valid. In the short term, the stock needs to overcome immediate resistance near $414.77 to gather momentum and continue its push towards the intermediate Fibonacci targets.
Dailyanalysis
TradeCityPro | Bitcoin Daily Analysis #235👋 Welcome to TradeCity Pro!
Let’s move on to the Bitcoin analysis. Today is Saturday, it’s the weekend, and market volume and volatility have dropped significantly.
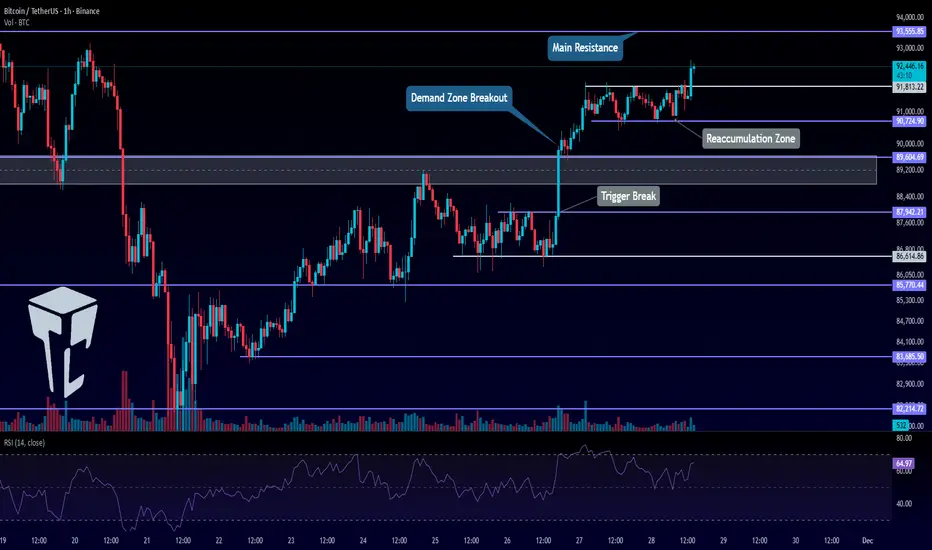
⏳ 1-Hour Timeframe
The long trigger we had yesterday on Bitcoin was broken, but the market didn’t continue upward, instead, it turned into a fake breakout.
⚖️ The main resistance on Bitcoin remains 93,555, and the price didn’t reach this level. Sellers entered the market earlier than expected and took control before price could reach the resistance.
💫 After this fakeout and with the weekend arriving, trading volume has decreased sharply, the difference in volume before and after the fakeout is very noticeable.
🔭 This low volume has caused the price to slowly drift downward with a very weak slope, and it’s currently fluctuating around the 90,724 zone.
📊 Additionally, because volume is so low, the price is not reacting cleanly to levels and is not respecting them, which is normal when market depth decreases.
✅ At the moment, I don’t think the market is in a good condition to open new positions.
💡 The main resistance zone on Bitcoin is still 93,555, and breaking this level will turn the trend bullish.
✨ As long as the price is above 89,000, I do not consider the trend bearish, but this does not mean the market is bullish either.
🎲 Right now, Bitcoin has no clear trend, and for a new trend to form, we must wait for a confirmed breakout either above 93,555 or below 89,000.
❌ Disclaimer ❌
Trading futures is highly risky and dangerous. If you're not an expert, these triggers may not be suitable for you. You should first learn risk and capital management. You can also use the educational content from this channel.
Finally, these triggers reflect my personal opinions on price action, and the market may move completely against this analysis. So, do your own research before opening any position.

TradeCityPro | Bitcoin Daily Analysis #234👋 Welcome to TradeCityPro!
Let’s move on to the Bitcoin analysis. The market is continuing the upward movement it started earlier.
⏳ 1-Hour Timeframe
Yesterday, after breaking the resistance zone, Bitcoin entered a small ranging box, and now the price has managed to stabilize above this box.
🔔 This range allowed the price to rest, and with new momentum entering the market, Bitcoin is now ready to move toward the 93,555 level.
💥 The RSI oscillator has formed a new momentum low around the 50 level.
✔️ This shows increased bullish momentum compared to the previous leg, because in the previous leg, RSI’s support was at 21.
✨ If this new RSI low holds, the market’s momentum will remain bullish, allowing the price to continue its upward movement.
📊 The triggers we previously had 87,942, 89,000, and 91,813 all activated and are currently in profit.
The next trigger for Bitcoin is at 93,555.
⭐ When the price reaches 93,555, there is a high probability that the market will begin ranging again or enter a correction.
⚡️ So if I see signs of exhaustion or reversal at that level, I will manage risk and take profits on my positions.
❌ Disclaimer ❌
Trading futures is highly risky and dangerous. If you're not an expert, these triggers may not be suitable for you. You should first learn risk and capital management. You can also use the educational content from this channel.
Finally, these triggers reflect my personal opinions on price action, and the market may move completely against this analysis. So, do your own research before opening any position.
TradeCityPro | Bitcoin Daily Analysis #233👋 Welcome to TradeCity Pro!
Let’s dive into today’s Bitcoin analysis. The market is moving upwards today, and yesterday, the long triggers we discussed were activated.
⏳ 1-Hour Timeframe
In yesterday’s analysis, I mentioned that Bitcoin was sitting at its momentum support zone in RSI. I also pointed out that if the RSI was supported at this level, the bullish momentum would be revived in the market.
⭐ This is exactly what happened. With the RSI support, buying volume entered the market, and after breaking the 87,942 level, we had our first long entry trigger.
✔️ The reason for this early entry, as mentioned in yesterday's analysis, was that we had confirmation of momentum from the RSI. This allowed us to enter the position earlier than waiting for the 89,000 level to break.
💥 The second main trigger for Bitcoin was the break of the 89,000 level, which happened with a strong bullish candle. If you didn’t have a stop buy order, you likely missed the chance to open the position.
💡 Currently, after breaking this level, the price has shown some weakness and reacted to the 91,581 zone, with the RSI moving out of the overbought zone.
📊 The volume during the last few green candles was low, and now, with the red candles, the volume is increasing.
⚖️ If the correction continues and becomes deeper, the price might pull back to the 89,000 zone. However, as long as the price remains above 89,000, I believe the short-term market trend will remain bullish, and a deeper downward leg is not expected on higher cycles.
💫 We can use the 89,000 level as a short trigger for the next bearish wave in the market.
🎲 In this case, the main support zones to watch are 86,614 and 82,214.
📈 For long positions, today, if Bitcoin breaks above 91,581, we can open a position. However, there is a very important resistance at the 93,555 level, which is the main trigger for confirming the bullish trend. It’s better to wait until this level is broken before actively pursuing a long position.
❌ Disclaimer ❌
Trading futures is highly risky and dangerous. If you're not an expert, these triggers may not be suitable for you. You should first learn risk and capital management. You can also use the educational content from this channel.
Finally, these triggers reflect my personal opinions on price action, and the market may move completely against this analysis. So, do your own research before opening any position.

TradeCityPro | Bitcoin Daily Analysis #232👋 Welcome to TradeCityPro!
Let’s dive into the Bitcoin analysis. This week has been a range-bound week for Bitcoin, and this range still continues.
⏳ 1-Hour Timeframe
The market conditions haven’t changed much compared to yesterday. Bitcoin has simply continued its range-bound movement.
⚡️ We had a resistance zone at 89,000, which the price had previously touched. In the subsequent move, the price has not been able to reach this level again, indicating a lack of buying strength.
🧩 Considering the decrease in volume and the weakening of the red candles, the chances of reaching 89,000 in this leg are quite low.
💥 The RSI oscillator has reached the momentum support zone for the price at 41.31.
🎲 If this level is broken, we can say that the bullish momentum will completely disappear, and the market will need to form a new structure.
✅ The loss of bullish momentum does not necessarily mean the end of the uptrend or the beginning of a downtrend. It simply means that the market’s momentum has faded, and we will need to wait and see what happens in the new structure.
💡 If the RSI stabilizes below this level, we can open a short position after breaking 85,770 and a long position after breaking the 89,000 level.
📊 However, if the RSI maintains its momentum and gets supported, we can enter a position earlier with the trigger at 87,942.
✨ The 87,942 trigger is considered risky, so I recommend paying attention to the volume. If the volume confirms the move, you can open the position after the breakout.
❌ Disclaimer ❌
Trading futures is highly risky and dangerous. If you're not an expert, these triggers may not be suitable for you. You should first learn risk and capital management. You can also use the educational content from this channel.
Finally, these triggers reflect my personal opinions on price action, and the market may move completely against this analysis. So, do your own research before opening any position.

TradeCityPro | Bitcoin Daily Analysis #231👋 Welcome to TradeCity Pro!
Let’s dive into the Bitcoin analysis. The market is currently in an upward correction phase.
⏳ 1-Hour Timeframe
Yesterday, Bitcoin was supported at the 85,770 level and made another upward move.
✨ Currently, the price has reached the 89,000 level and has been rejected from there. This zone is a very strong PRZ (Potential Reversal Zone).
✔️ As long as the price doesn’t break below the 85,770 support, the possibility of breaking the 89,000 resistance still exists. Breaking this level, as mentioned in previous analyses, will be the first sign of a trend reversal for Bitcoin.
📊 The selling volume in the red candles has decreased a bit. Now, if the buying volume increases with the green candles, the likelihood of breaking the resistance increases.
⭐ However, if the price moves downward and breaks the 85,770 support, we can expect Bitcoin to move back toward the 82,214 level.
🧮 Therefore, we can use the break of 85,770 as a trigger for opening a short position.
🎲 For confirmation on higher cycles, the confirmation for a bullish reversal will come after stabilizing above 93,555, and the confirmation for a bearish trend will come after stabilizing below 82,214.
❌ Disclaimer ❌
Trading futures is highly risky and dangerous. If you're not an expert, these triggers may not be suitable for you. You should first learn risk and capital management. You can also use the educational content from this channel.
Finally, these triggers reflect my personal opinions on price action, and the market may move completely against this analysis. So, do your own research before opening any position.

TradeCityPro | Bitcoin Daily Analysis #230👋 Welcome to TradeCity Pro!
Let’s move on to today’s Bitcoin analysis. A new week has finally begun, and Bitcoin may once again start a strong momentum-driven trend.
⏳ 1-Hour Timeframe
Yesterday, Bitcoin continued its corrective upward move and retraced up to the 0.5 Fibonacci level.
✨ This level is extremely important — both in Fibonacci analysis and across many technical styles — and it can determine how the next major price wave forms.
✔️ For now, the price has been rejected from this level and has made a small downward move.
If the bearish movement continues, we can consider opening a short position on Bitcoin.
💥 Breaking 85,209 will be the first confirmation of a bearish trend.
Breaking 82,214 will be the main confirmation that a new downward trend has begun.
📊 If the market continues deeper corrections to the upside, the main resistance zone remains 89,000.
🔔 A stabilization above 89,000 will be the first confirmation of a new bullish trend beginning.
The full confirmation of a bullish reversal will come only after the 93,555 level is broken.
❌ Disclaimer ❌
Trading futures is highly risky and dangerous. If you're not an expert, these triggers may not be suitable for you. You should first learn risk and capital management. You can also use the educational content from this channel.
Finally, these triggers reflect my personal opinions on price action, and the market may move completely against this analysis. So, do your own research before opening any position.

TradeCityPro | Bitcoin Daily Analysis #229👋 Welcome to TradeCityPro!
Let’s dive into the Bitcoin analysis. Today, the market has made a deeper upward correction and is moving towards higher resistance levels.
⏳ 1-Hour Timeframe
After the downward move to the 82,214 zone, Bitcoin started a range and correction phase, and yesterday, it ranged between 82,214 and 85,209.
✨ After the price began to correct, a higher low was formed at 83,680, which allowed buyers to show some strength, and now the price has stabilized above 85,209.
✔️ This upward move continued to the 0.382 Fibonacci level, which I consider to be the first resistance level Bitcoin has reacted to.
⭐ If the price starts to drop from here and can stabilize below the 85,209 level, bearish momentum will return to the market, and we can get the first confirmation of a new downward wave.
🧮 The main confirmation for the start of this new wave will come after breaking the 82,214 level. Until then, any short position we open will be an early trigger.
🎲 Overall, Bitcoin has a very large support zone on the weekly timeframe, and this zone is between 75,000 and 90,000, where the price is currently located.
🔭 As long as the price is in this range, all positions are risky. Personally, I will reduce my risk, as traders’ win rates tend to decrease in such range-bound areas.
📊 For long positions, it’s still too early. I will wait until the price stabilizes above 89,604. This will be the first sign of buyer strength. The main confirmation for the bullish trend will come after stabilizing above 93,555.
❌ Disclaimer ❌
Trading futures is highly risky and dangerous. If you're not an expert, these triggers may not be suitable for you. You should first learn risk and capital management. You can also use the educational content from this channel.
Finally, these triggers reflect my personal opinions on price action, and the market may move completely against this analysis. So, do your own research before opening any position.

TradeCityPro | Bitcoin Daily Analysis #228👋 Welcome to TradeCity Pro!
Let’s move on to the Bitcoin analysis. After the sharp drop we had throughout the week, the market has finally calmed down today and is moving sideways.
⏳ 1-Hour Timeframe
After the strong downward move earlier this week, the market has made a small correction today.
✔️ This correction came after reaching the 82,214 support level, and as you can see, the buying volume during this correction is extremely low.
✨ This shows that buyers are very weak.
On the other hand, as you can see, the red candles are starting to show increasing volume again, and if this continues, we can open short positions using short triggers from the lower timeframes.
💥 The RSI oscillator bounced from its support yesterday and is now below the 50 level.
A rejection from this zone can introduce new bearish momentum.
🔔 The main short trigger right now is 82,214.
However, this trigger is very risky because it is close to a very strong support zone, and there is a high probability that buyers may attempt to enter the market there.
📈 For long positions, there is currently nothing to discuss, the market needs to form a proper bullish structure first.
Our confirmation for a bullish trend comes only after price stabilizes above 89,000, which is still very far from the current level.
💡 Right now, the price hasn’t even corrected up to the 0.382 retracement of the previous wave.
This alone shows that buyers have not entered the market yet.
So for long setups, we must wait until buyers return, show strength, and take control, and then we follow them.
❌ Disclaimer ❌
Trading futures is highly risky and dangerous. If you're not an expert, these triggers may not be suitable for you. You should first learn risk and capital management. You can also use the educational content from this channel.
Finally, these triggers reflect my personal opinions on price action, and the market may move completely against this analysis. So, do your own research before opening any position.

TradeCityPro | Bitcoin Daily Analysis #226👋 Welcome to TradeCity Pro!
Let’s dive into today’s Bitcoin analysis. Our new short triggers have activated, and the market is continuing its downward movement.
⏳ 1-Hour Timeframe
After Bitcoin made a fake downward move yesterday, today it formed a lower high below 93,555, and after breaking the 90,489 and 88,825 levels, it is now continuing strongly to the downside.
⭐ A very large amount of selling volume has entered the market, giving full control to the sellers. The downtrend is continuing with strong momentum.
✨ The next support levels are 85,846 and 83,333.If you already have open short positions, you can use these levels for partial profit-taking.
✔️ The RSI oscillator is currently in the oversold zone, around 21.53.Breaking this level could push the bearish move even further.However, if RSI gets supported here, momentum may weaken, and a correction could begin.
💡 If a correction happens, the resistance zones to watch are 88,825 and 90,489.Our main confirmation for a trend reversal will still come after breaking 93,555.
❌ Disclaimer ❌
Trading futures is highly risky and dangerous. If you're not an expert, these triggers may not be suitable for you. You should first learn risk and capital management. You can also use the educational content from this channel.
Finally, these triggers reflect my personal opinions on price action, and the market may move completely against this analysis. So, do your own research before opening any position.

SIGN Analysis (4H)We currently have strong bullish momentum on the chart, and we already had a bullish CH as well as two bullish BOS signals. The price has also been consolidating in a favorable area for some time, and bearish momentum has nearly dropped to zero.
We will wait for the price to return to the marked demand zone, and within that area we will look to open a buy/long position with proper capital management and risk control.
The targets have been marked on the chart.
A 4-hour candle closing below the invalidation level will invalidate this analysis.
Do not enter the position without capital management and stop setting
Comment if you have any questions
thank you

TradeCityPro | Bitcoin Daily Analysis #225👋 Welcome to TradeCity Pro!
Let’s jump into today’s Bitcoin analysis. After the pullback to 93,555, Bitcoin has moved into a ranging phase.
⌛️ 1-Hour Timeframe
Yesterday, after reaching its support zone, Bitcoin made a corrective upward move and pulled back to 93,555.
💡 Right now, after completing that pullback, the price has dropped back down to 90,489 and has shown a reaction to this level.
✔️ As you can see, selling volume has been increasing during this move, and we haven’t seen any significant buying volume enter the market yet.
✨ Today’s trigger for opening a position is the break of 90,489.This is a suitable trigger for a short position, and breaking it could be the start of the next bearish leg.
⭐ If the move toward 90,489 comes with increasing volume, we can even enter earlier using a candle setup, before the full break happens.
📊 For a long position, it’s still too early.We first need to see the price stabilize above 93,555, and only then we can look for long triggers.
❌ Disclaimer ❌
Trading futures is highly risky and dangerous. If you're not an expert, these triggers may not be suitable for you. You should first learn risk and capital management. You can also use the educational content from this channel.
Finally, these triggers reflect my personal opinions on price action, and the market may move completely against this analysis. So, do your own research before opening any position.

TradeCityPro | Bitcoin Daily Analysis #224👋 Welcome to TradeCityPro!
Let’s dive into the Bitcoin analysis. The market has continued its downward movement and has reached its next support level.
⏳ 1-Hour Timeframe
Yesterday, after breaking the 93,965 zone, Bitcoin started a downward move, which extended to 89,603.
⚡️ The main support zone for the price, in my opinion, is 88,262, which the price hasn't yet reached, and it was supported at 89,603.
✨ Currently, the price is making a bullish correction and has retraced to around the 0.382 Fibonacci level.
✔️ The 91,608 zone is very important, and if the price can stabilize above it, the likelihood of forming a V-pattern increases significantly.
🔔 If the price moves sharply upwards and stabilizes above 95,766, we will get confirmation of the activation of this pattern, but currently, the price is still far from it.
📊 For today’s long position, we can consider entering if the 89,603 level breaks, but with very low risk, as the price has already made its move, and I believe we are in a correction phase now.
🎲 If the upward move continues, I think we could open a long position tomorrow. Otherwise, the next trigger is 95,766.
❌ Disclaimer ❌
Trading futures is highly risky and dangerous. If you're not an expert, these triggers may not be suitable for you. You should first learn risk and capital management. You can also use the educational content from this channel.
Finally, these triggers reflect my personal opinions on price action, and the market may move completely against this analysis. So, do your own research before opening any position.

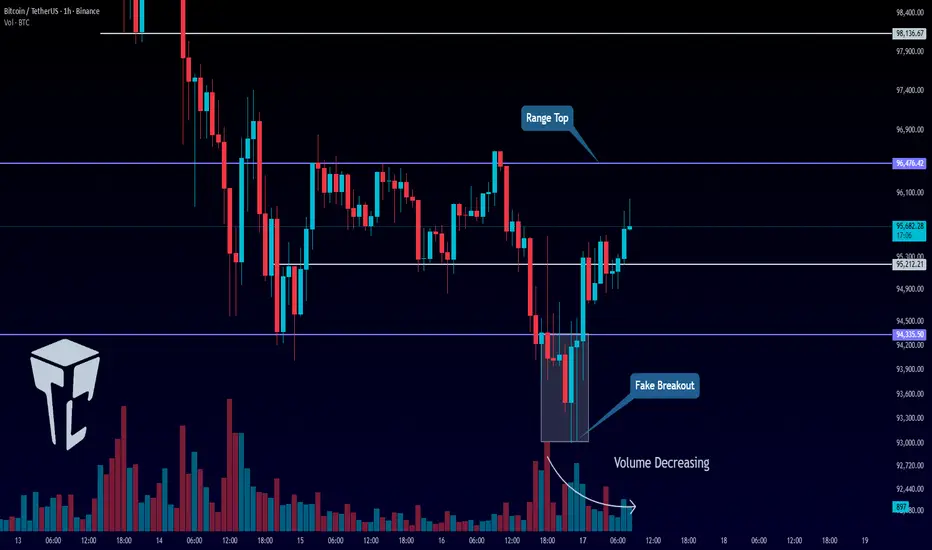
TradeCityPro | Bitcoin Daily Analysis #223👋 Welcome to TradeCity Pro!
Let’s dive into the Bitcoin analysis. Yesterday, Bitcoin made a fake downward move and is now back in its range box.
⏳ 1-Hour Timeframe
Yesterday, the short triggers we had at 95,212 and 94,335 were activated, and the price moved slightly downward. However, this bearish move turned out to be a fakeout, and the price started moving upwards again.
✅ Currently, the price has moved above 95,212 and managed to stabilize above this level. The next resistance zone for Bitcoin is at 96,476.
⚡️ The 96,476 zone was faked yesterday, and after a candle closed above it, the price moved downward. Now, we need to wait for the price’s next reaction to this level to refine the exact breakout point.
✨ After this encounter, we can open a risky long position if the level breaks on the next attempt. The next target above this level is 98,136.
📊 For a short position, since the price faked the bottom of the range, the chart is a bit messy. I personally prefer to wait for the price to establish more structure and for a new trigger to form. We can then open a new position upon the breakout of the next trigger.
💼 For previously opened short positions, we can move the stop loss above the 96,476 level.
❌ Disclaimer ❌
Trading futures is highly risky and dangerous. If you're not an expert, these triggers may not be suitable for you. You should first learn risk and capital management. You can also use the educational content from this channel.
Finally, these triggers reflect my personal opinions on price action, and the market may move completely against this analysis. So, do your own research before opening any position.
XAUUSD – Intraday Liquidity Map(Smart Money Playbook for Nov 17, 2025)
🌐 MARKET CONTEXT
XAUUSD is trading inside a tightening intraday range as the market awaits new U.S. economic cues and volatility from the NY session.
Recent Drivers:
Gold rebounded early in Asia after Friday’s demand surge, but price is still capped beneath key premium levels that attracted heavy sellers last week.
Sentiment:
Mixed risk-on / risk-off conditions as investors balance USD strength with geopolitical uncertainty. This creates sharp intraday sweeps on both sides.
Session Expectations:
London: Expect engineered liquidity hunts above intraday highs.
NY: Strong directional expansion after liquidity sweep.
Bias Connection:
Strong supply remains above 4243–4245, while high-quality demand exists below 4121 and near 4040.
→ Intraday bias: Sell high – Buy deep liquidity.
📉 TECHNICAL ANALYSIS (SMC + LIQUIDITY STRUCTURE)
Market Structure (M30):
Short-term trend remains bearish with lower highs forming since last week.
Multiple liquidity pools lie beneath 4120 and 4040, suggesting potential bullish runs from deep discount areas.
Premium pricing clearly sits above 4240, where prior bearish imbalance remains unfilled.
Key SMC Signals:
Price has created liquidity buildup above 4243 → perfect for NY session sweep.
Buy-side liquidity beneath 4121 aligns with unmitigated OB.
Deep liquidity zone at 4042–4040 matches M30 FVG + higher TF demand.
🔑 KEY PRICE ZONES (M30)
4245–4243 ▶️ Premium Sell Zone – Liquidity Grab Area
A high-quality supply zone containing:
Equal highs liquidity
Old unmitigated M30 supply
Ideal premium range for institutional sells
Most powerful short-term rejection zone.
4170–4168 ▶️ Intraday Sell Scalping Zone
A shallow supply area perfect for quick scalps:
Internal liquidity sweep
micro OB alignment
Expected London fakeout zone
Fast reacting → best for short-duration trades.
4123–4121 ▶️ Intraday Buy Scalping Zone
Strong reaction area with:
Short-term SSL sweep
M30 imbalance fill
Good for London → NY continuation
Short-term bounce expected.
4042–4040 ▶️ Deep Discount Buy Zone (Major Buy Zone)
The most attractive demand zone on the chart:
Higher timeframe OB
Massive liquidity pool
Deep discount pricing
Long-term unmitigated zone
If price hits this area → extremely high probability reversal.
⚙️ TRADE SETUPS (M30)
✅ SELL SCENARIO – Premium Supply Rejection
Entry: 4245–4243
Stoploss: 4251
TP1: 4220
TP2: 4180
TP3: 4125
Logic:
NY liquidity sweep setup. Expect price to hunt liquidity above 4240 before reversing strongly.
✅ SELL SCALPING – Internal Supply Reaction
Entry: 4170–4168
Stoploss: 4176
TP1: 4155
TP2: 4140
Logic:
Quick reaction zone following intraday retracement.
Ideal for scalpers using M5 confirmation.
✅ BUY SCALPING – Intraday Demand Tap
Entry: 4123–4121
Stoploss: 4129
TP1: 4140
TP2: 4160
Logic:
Internal liquidity sweep + OB retest.
Short-term rebound expected before deeper move.
⚠️ BUY SCENARIO – Deep Discount Gold Reversal (Highest Probability)
Entry: 4042–4040
Stoploss: 4034
TP1: 4080
TP2: 4120
TP3: 4160
Logic:
Alignment of:
higher TF demand
deep liquidity sweep
unmitigated order block
This is the strongest buy zone of the day.
🧠 SESSION NOTES & TRADE PLAN
Expect fake breaks above highs before real move begins.
Best sells occur only in premium zones (4170 & 4245).
Best buys occur only in deep discount zones (4121 & 4040).
Always wait for M5/M1 confirmation: sweep → CHoCH → mitigation.
Avoid trading in mid-range consolidation.
🏁 CONCLUSION
XAUUSD today favors a clear Smart Money pattern:
Sell premium zones at 4245–4243 and 4170–4168
Buy deep liquidity at 4121 and especially 4040
Expect volatility increases during London–NY overlap.
Trade with confirmation and respect liquidity.

TradeCityPro | Bitcoin Daily Analysis #222👋 Welcome to TradeCity Pro!
Let’s dive into the Bitcoin analysis. Today is Sunday, the last day of the week. Let’s go over the triggers and scenarios for the upcoming week.
⏳ 1-Hour Timeframe
On the 1-hour timeframe, after a bearish leg, Bitcoin has now reached the 94,335 level and formed a range box between 94,335 and 96,476.
📊 Volume has naturally decreased over the past few days due to the weekend and the price correction.
🔭 Today, the market could make a move during the New York session, and we can better assess this by looking at volume trends.
🧮 If, near the New York session or during it, volume starts to increase, we can expect the market to make a move.
📉 For a short position:
The first trigger is at 95,212. The main trigger for the start of a new bearish wave is 94,335.
⚖️ If you already have an open position and your account is in profit, it might be worth taking the risk and entering earlier with the break of 95,212. However, if your account is at a loss, I recommend waiting for the 94,335 trigger to activate.
🚀 For a long position:
It’s better to wait for the current bearish momentum to subside and for the market to become bullish. But, if you want to make an early entry, the 96,476 trigger might be a decent option.
💡 Personally, I will wait for the price to form a higher high and higher low above 96,476 before pursuing a long position.
❌ Disclaimer ❌
Trading futures is highly risky and dangerous. If you're not an expert, these triggers may not be suitable for you. You should first learn risk and capital management. You can also use the educational content from this channel.
Finally, these triggers reflect my personal opinions on price action, and the market may move completely against this analysis. So, do your own research before opening any position.

TradeCityPro | Bitcoin Daily Analysis #221👋 Welcome to TradeCity Pro!
Yesterday, Bitcoin’s bearish movement continued once again, and the price has now reached a very important support level.
⏳ 4-Hour Timeframe
On the 4-hour timeframe, Bitcoin is in its second bearish wave. After correcting up to 10,6644, it started a fresh downward move.
✔️ Yesterday, the price interacted with the 99,827 zone, which overlaps with the 0.5 Fibonacci level. After this zone was broken, the bearish move extended down to 94,355.
⚡️ The 94,355 level overlaps with the 0.786 Fibonacci retracement, and so far, the price has shown a reaction to it and is currently ranging near this support.
💫 If the 94,355 level breaks, we will have confirmation of a continued downtrend, and we can open a short position on the breakout.
💡 For previously opened short positions, you can move your stop-loss above 97,021, and if the price stabilizes above that level, you can take profit and secure your gains.
📊 For long positions, it’s better to wait until bullish momentum returns to the market.
❌ Disclaimer ❌
Trading futures is highly risky and dangerous. If you're not an expert, these triggers may not be suitable for you. You should first learn risk and capital management. You can also use the educational content from this channel.
Finally, these triggers reflect my personal opinions on price action, and the market may move completely against this analysis. So, do your own research before opening any position.

TradeCityPro | Bitcoin Daily Analysis #220👋 Welcome to TradeCity Pro!
Let’s move on to the Bitcoin analysis. The market continues its downward movement, and yesterday it recorded another bearish leg.
⏳ 1-Hour Timeframe
If you remember, yesterday we drew a bearish structure for Bitcoin with a bottom at 10,1302, which we could use as a trigger for a short position.
⭐ After that level was broken, a new downward move began, and the RSI entering the oversold zone added even more bearish momentum to the market.
✔️ As a result, the price managed to drop below the 9,9631 level in its first move. After a pullback to this zone, Bitcoin has now started another downward leg.
📊 Volume has been increasing throughout this bearish movement, and the RSI is once again approaching the oversold area, meaning that if it enters this zone, the current leg is likely to continue.
⚡️ We can also draw a curved trendline on Bitcoin’s chart, from which the price was rejected yesterday. The price is currently far from that line, but if a correction occurs, this trendline could act as a dynamic resistance. The static resistance zone is at 9,9631.
🎲 For today’s trading setup, the short trigger is at 9,7117, though it’s quite risky and has a high chance of being a fakeout. However, if market momentum remains bearish, this trigger can still be suitable for a short entry.
💡 If you already have open short positions, there’s no need to open new ones using this trigger — your entry is already at a good point. For profit-taking, you can use Dow Theory’s trend reversal signals to guide your exits.
❌ Disclaimer ❌
Trading futures is highly risky and dangerous. If you're not an expert, these triggers may not be suitable for you. You should first learn risk and capital management. You can also use the educational content from this channel.
Finally, these triggers reflect my personal opinions on price action, and the market may move completely against this analysis. So, do your own research before opening any position.

TradeCityPro | Bitcoin Daily Analysis #219👋 Welcome to TradeCityPro!
Let’s dive into the Bitcoin analysis. A bearish structure has formed in the market, so let’s review today’s key triggers together.
⏳ 1-Hour Timeframe
Yesterday, Bitcoin made another bearish leg after being rejected from the 10,5043 level, dropping all the way down to 10,1302.
🔔 The corrections during this downtrend that started from 10,6644 have been quite deep, and yesterday, after reaching the 10,1302 zone, the price made a short-term correction up to 10,3855.
✔️ Today, after reaching that level again, Bitcoin has started forming red candles and is now moving back toward the 10,1302 support.
💡 If the 10,1302 level breaks, we can open a short position.The main confirmation of a continued bearish trend will come with the break of 10,0308.
📊 For a long position, the first trigger is at 10,3855, and the main long trigger is at 10,5043.The main confirmation of a bullish reversal will come with a break above 10,6644.
❌ Disclaimer ❌
Trading futures is highly risky and dangerous. If you're not an expert, these triggers may not be suitable for you. You should first learn risk and capital management. You can also use the educational content from this channel.
Finally, these triggers reflect my personal opinions on price action, and the market may move completely against this analysis. So, do your own research before opening any position.

TradeCityPro | Bitcoin Daily Analysis #218👋 Welcome to TradeCity Pro!
Let’s dive into the Bitcoin analysis. Today, the market has started another upward move.
⏱ 1-Hour Timeframe
Yesterday, after breaking the support zone, Bitcoin made a downward move to the 10,2489 level. Now, it has started another upward movement.
The price is currently facing resistance at the 10,5020 level, and as you can see, it has experienced a strong rejection from this level, which has caused the bullish momentum to fade from the market.
This rejection at the 10,5020 level makes it a very important zone. If this level is broken, it will act as a strong trigger for a long position.
The first trigger for a long position:
The first trigger for a long position is the 10,5020 level. The next main trigger, which is our primary long trigger, is at 10,6644.
For a short position:
If the downward momentum continues, we can open a short position when the 10,2489 level is broken.
However, as long as the price is ranging between 10,2489 and 10,5020, I prefer not to open any new positions.

TradeCityPro | Bitcoin Daily Analysis #217👋 Welcome to TradeCity Pro!
Let’s dive into the Bitcoin analysis. The market has finally started an upward move, and the triggers we set yesterday have been activated.
⏳ 1-Hour Timeframe
Yesterday, Bitcoin created a smaller range box between the 10,601 and 10,2489 levels, and after breaking the upper range of the box, the price moved up to the upper boundary of the main box at 10,3855.
📊 Volume increased throughout this move, and the strength of the green candles grew significantly. The 10,3855 resistance was also broken, and with the RSI entering the overbought zone, a sharp upward move began.
⚡️ This upward move continued to 10,6412, and after reaching this level, momentum started to slow down, and RSI exited the overbought zone. The price is now ranging below 10,6412.
📈 Today’s trigger:
The key trigger for Bitcoin today is breaking the 10,6412 level. If this level is broken, the upward move will continue.
✔️ In case of a correction, if the price forms a higher low above 10,3855, the bullish trend will remain intact, and the next upward leg could start.
🔽 For a short position, I don’t think we should pursue it yet. We should wait for the trend to turn bearish again. The confirmation for a bearish trend will come if the price stabilizes below 10,3855.
❌ Disclaimer ❌
Trading futures is highly risky and dangerous. If you're not an expert, these triggers may not be suitable for you. You should first learn risk and capital management. You can also use the educational content from this channel.
Finally, these triggers reflect my personal opinions on price action, and the market may move completely against this analysis. So, do your own research before opening any position.

TradeCityPro | Bitcoin Daily Analysis #216👋 Welcome to TradeCity Pro!
Let’s dive into the Bitcoin analysis. The market has finally started an upward move, and the triggers we set yesterday have been activated.
⏳ 1-Hour Timeframe
Yesterday, Bitcoin created a smaller range box between the 10,601 and 10,2489 levels, and after breaking the upper range of the box, the price moved up to the upper boundary of the main box at 10,3855.
📊 Volume increased throughout this move, and the strength of the green candles grew significantly. The 10,3855 resistance was also broken, and with the RSI entering the overbought zone, a sharp upward move began.
✅ This upward move continued to 10,6412, and after reaching this level, momentum started to slow down, and RSI exited the overbought zone. The price is now ranging below 10,6412.
🚀 Today’s trigger:
The key trigger for Bitcoin today is breaking the 10,6412 level. If this level is broken, the upward move will continue.
🔽 In case of a correction, if the price forms a higher low above 10,3855, the bullish trend will remain intact, and the next upward leg could start.
⚖️ For a short position, I don’t think we should pursue it yet. We should wait for the trend to turn bearish again. The confirmation for a bearish trend will come if the price stabilizes below 10,3855.
❌ Disclaimer ❌
Trading futures is highly risky and dangerous. If you're not an expert, these triggers may not be suitable for you. You should first learn risk and capital management. You can also use the educational content from this channel.
Finally, these triggers reflect my personal opinions on price action, and the market may move completely against this analysis. So, do your own research before opening any position.

TradeCityPro | Bitcoin Daily Analysis #215👋 Welcome to TradeCity Pro!
Let’s move on to Bitcoin analysis. Today is Sunday, and the price is ranging inside a new box it has formed. The breakout from this box is critical and could be the start of the next move.
⏳ 1-Hour Timeframe
On the 1-hour timeframe, Bitcoin has formed a large ranging box between the 100,308 and 103,855 levels, and the price has already faked out once to the downside.
🔔 After this fakeout, a bullish move began, pushing the price up to 103,855.
✅ However, since this move happened on Friday and we entered the weekend afterward, the market's momentum has faded, and now, the price is ranging within a much smaller box.
🎲 This range is forming between 101,601 and 102,489, and breaking either of these levels could give us a position.
💡 A key point to remember is that volume must increase in the direction the price breaks. If volume diverges from the price, the move is likely to be a fakeout.
☘️ The main triggers are still 100,308 and 103,855. Breaking either of these zones will set off the next major move in the market.
❌ Disclaimer ❌
Trading futures is highly risky and dangerous. If you're not an expert, these triggers may not be suitable for you. You should first learn risk and capital management. You can also use the educational content from this channel.
Finally, these triggers reflect my personal opinions on price action, and the market may move completely against this analysis. So, do your own research before opening any position.
