TradeCityPro | Bitcoin Daily Analysis #213👋 Welcome to TradeCity Pro!
Let’s dive into the Bitcoin analysis. The market has been calm for a few days, but we need to stay alert in case a new move starts, so we don’t miss out.
⏳ 1-Hour Timeframe
After reacting to the 0.382 Fibonacci level, Bitcoin started to drop again and reached the 100,308 support.
✨ Currently, after a minor bullish correction, the price is heading back towards the 100,308 support.
✅ Breaking this support still seems like a strong trigger for a short position. Even yesterday, when the price briefly reached this zone with a shadow, we saw clear buying interest in this area, with a significant increase in buying volume as the price touched the support.
🔑 The key point is that every time the price reacts to this level, the buying pressure is getting weaker. Fewer and fewer buyers are willing to buy at this level.
🎲 If this pattern continues, the psychological level of 100,000 will lose its impact, and breaking it will become easier.
⚖️ So, if the price touches this support a few more times, I anticipate a higher chance of the level breaking.
⭐ However, if the buyers show more strength at this level and can push the price above 104,000 with significant volume, we could expect Bitcoin to turn bullish.
📝 Final Thoughts
Stay calm, trade wisely, and let's capture the market's best opportunities!
This analysis reflects our opinions and is not financial advice.
Share your thoughts in the comments, and don’t forget to share this analysis with your friends! ❤️
Dailyanalysis

TradeCityPro | Bitcoin Daily Analysis #212👋 Welcome to TradeCity Pro!
Let’s dive into the Bitcoin analysis. The market has entered a corrective phase and is preparing for the next wave of movement.
⏳ 1-Hour Timeframe
On the 1-hour timeframe, Bitcoin started correcting after reaching the support at 100,308 and has now retraced to the 0.382 Fibonacci level.
📊 Market volume significantly increased around the 100,308 support, indicating that this zone is very sensitive and important, with price reacting to it.
✨ Currently, volume has decreased slightly, and the price is in a corrective phase. If this correction continues, the next resistance zones will be at the 0.5 and 0.618 Fibonacci levels.
⭐ However, if the price continues its downward movement, we can open a position with a candlestick setup when the volume increases towards 100,308, or wait for the break of the 100,308 support to open a position.
✅ For a long position, if buying volume increases, the break of the 0.382 Fibonacci level would be a good trigger for a long entry.
❌ Disclaimer ❌
Trading futures is highly risky and dangerous. If you're not an expert, these triggers may not be suitable for you. You should first learn risk and capital management. You can also use the educational content from this channel.
Finally, these triggers reflect my personal opinions on price action, and the market may move completely against this analysis. So, do your own research before opening any position.

TradeCityPro | Bitcoin Daily Analysis #211👋 Welcome to TradeCity Pro!
Let’s dive into the Bitcoin analysis. The market is still in a downtrend and has reached its next support!
⏳ 4-Hour Timeframe
Bitcoin finally broke the important support at 106,396 yesterday, and with a very high selling volume, it managed to start its new downward wave.
💥 The RSI oscillator also entered the oversold zone at the same time as the 106,396 break, which was another reason for the market's drop.
⚡️ This downward move has reached the 100,308 support, and the price has calmed down a bit now.
✅ The psychological level of 100,000 is extremely important. Despite the massive selling volume and bearish momentum in the market, buyers haven’t allowed the price to stabilize below this level, and now the market is in a corrective phase.
🧩 After the price reacted to this zone, the volume has significantly decreased, which favors the sellers. If the buying volume remains low, the price will likely start falling again with the entrance of new selling volume.
🔔 However, since the RSI has faked the 30 level and the market momentum could turn bullish, we could see a reversal. If the volume starts to increase and considering the bullish trend on higher timeframes like the weekly chart, we could open a position.
🔍 For now, the first long trigger we have in this timeframe is 111,789. If the price can sharply recover to this level, a very strong bullish trend could begin.
💡 The main resistance zone we have is 115,771, and breaking this level will confirm the start of Bitcoin's new upward wave. We can look to enter the trend after breaking 111,789. If the price builds further structure, we can enter earlier with smaller triggers.
❌ Disclaimer ❌
Trading futures is highly risky and dangerous. If you're not an expert, these triggers may not be suitable for you. You should first learn risk and capital management. You can also use the educational content from this channel.
Finally, these triggers reflect my personal opinions on price action, and the market may move completely against this analysis. So, do your own research before opening any position.

TradeCityPro | Bitcoin Daily Analysis #210👋 Welcome to TradeCity Pro!
Let's dive into the Bitcoin analysis. The bearish movement of Bitcoin has begun, so it's best to analyze the market together.
⏳ 1-Hour Timeframe
On the 1-hour timeframe, Bitcoin is in a downtrend, and after breaking the 105,780 level yesterday, it continues its downward movement.
📈 The next low point the price reached was 104,488, which has also been broken, and the price is still moving downward.
💥 The RSI oscillator is at a very important support level around 30, and from both a momentum and candlestick perspective, we can say there is no weakness in the trend.
✨ Therefore, a break below the 30 level and into the oversold zone significantly increases the likelihood of a sharp downward move.
✔️ Currently, we don’t have a short trigger because the price has moved very sharply, and no specific trigger has been formed. However, once RSI enters the oversold zone, we can use candlestick setups for entries.
🎲 As long as the price doesn’t create a lower low and lower high below 104,488, I won’t consider the break of this level valid, and there’s a possibility of this bearish move being a fakeout.
🧮 If the price stabilizes above 105,780, it would confirm the fakeout. However, if the price stabilizes below 104,488, the next wave of the drop will begin.
❌ Disclaimer ❌
Trading futures is highly risky and dangerous. If you're not an expert, these triggers may not be suitable for you. You should first learn risk and capital management. You can also use the educational content from this channel.
Finally, these triggers reflect my personal opinions on price action, and the market may move completely against this analysis. So, do your own research before opening any position.

TradeCityPro | Bitcoin Daily Analysis #209👋 Welcome to TradeCity Pro!
Let's dive into the Bitcoin analysis. The market momentum is bearish, so it's better we make a proper price analysis together.
⏳ 1-Hour Timeframe
Yesterday, Bitcoin made a downward move and was rejected from the peak it created at the 111,365 zone.
📈 The long trigger we had at 111,365 didn’t get activated, and now the price has started its downward movement after breaking the 108,844 level.
🔔 The support level that the price has reacted to is 105,780. The price has hit this level with a very large volume and is reacting to it.
💥 If this level breaks, a huge sell volume will enter the market, and a new downward wave could start.
✨ We will confirm the start of this new wave with a break below the 104,488 level. We can also use the 105,780 and 104,488 triggers as entry points for positions.
✔️ As for a long position, I am currently waiting for this bearish momentum to dissipate before looking for a long trigger.
❌ Disclaimer ❌
Trading futures is highly risky and dangerous. If you're not an expert, these triggers may not be suitable for you. You should first learn risk and capital management. You can also use the educational content from this channel.
Finally, these triggers reflect my personal opinions on price action, and the market may move completely against this analysis. So, do your own research before opening any position.

TradeCityPro | Bitcoin Daily Analysis #208👋 Welcome to TradeCity Pro!
Let's take a look at Bitcoin's analysis — the market is still ranging.
⏱ 1-Hour Timeframe
In the 1-hour timeframe, Bitcoin is still below the 111365 level. Today, it moved close to this level once, but it is currently still trading below it.
⛏ Good buying volume has entered the market, while the volume of red candles has been decreasing. In case 111365 is broken, we can open a long position.
🧮 If the price gets rejected from this level, the first short trigger we have is 108844. The next support levels are 107486 and 106319.
📊 Overall, I still believe that as long as the price is between 106319 and 115808, the market movements are temporary and not very exciting. As long as the price stays in this zone, I will open short-term positions and take profit quickly.
❌ Disclaimer ❌
Trading futures is highly risky and dangerous. If you're not an expert, these triggers may not be suitable for you. You should first learn risk and capital management. You can also use the educational content from this channel.
Finally, these triggers reflect my personal opinions on price action, and the market may move completely against this analysis. So, do your own research before opening any position.

TradeCityPro | Bitcoin Daily Analysis #207👋 Welcome to TradeCity Pro!
After a short break, let's get back to the daily Bitcoin analysis. The market is still in a very large range box.
⏳ 1-Hour Timeframe
Currently, Bitcoin is recovering after the drop to the 106319 level and has moved up to 110803.
✅ Today is Saturday, and as you can see, the market volume has dropped significantly. It seems that the market may range until tomorrow afternoon and won't move much upwards, with the main movement starting next week.
⚡️ The triggers we have for opening positions right now are:
For long: 110803
For short: 108844 and 106319
💥 Overall, Bitcoin is in a very large range box between 106319 and 115808, and as long as the price stays between these two levels, I will open my positions with very low risk.
❌ Disclaimer ❌
Trading futures is highly risky and dangerous. If you're not an expert, these triggers may not be suitable for you. You should first learn risk and capital management. You can also use the educational content from this channel.
Finally, these triggers reflect my personal opinions on price action, and the market may move completely against this analysis. So, do your own research before opening any position.

TradeCityPro | Bitcoin Daily Analysis #206👋 Welcome to TradeCity Pro!
Let’s move on to Bitcoin’s analysis, the market is still moving upward, so let’s review it together.
⏳ 1-Hour Timeframe
Yesterday, Bitcoin formed a resistance zone around 111463, which it touched once, and on the next attempt, it managed to break through this level.
⭐ In this bullish leg that started after the fake-out of 107486, the RSI is strongly supporting the trend and is now close to the Overbought area.
✔️ However, volume is still very low and doesn’t confirm the trend, which isn’t ideal. Since today is Saturday, overall market volume is weak, and there’s a high chance that with the start of the new weekly candle, this entire upward move could turn out to be a fake-out in the next couple of days.
✨ Still, I believe it’s worth the risk to keep the positions open that were entered at 108943 and 111463, because if the 113429 level breaks, price could start a very strong bullish move.
💥 If this upward move turns out to be fake and price stabilizes below 111463, we can consider that as a temporary bearish confirmation — in that case, price could again drop back down toward the 107486 level
📝 Final Thoughts
Stay calm, trade wisely, and let's capture the market's best opportunities!
This analysis reflects our opinions and is not financial advice.
Share your thoughts in the comments, and don’t forget to share this analysis with your friends! ❤️

TradeCityPro | Bitcoin Daily Analysis #205👋 Welcome to TradeCity Pro!
Let’s analyze Bitcoin today, as the market is making an upward move, so it's important to have a solid analysis to stay ahead of future movements.
⏳ 1-Hour Timeframe
Bitcoin's upward movement continues, and after yesterday's correction, the price is now moving upwards again toward the 111645 level.
This movement is accompanied by weak momentum, and the volume is decreasing, so opening a long position right now is a bit risky.
However, if 111645 breaks, we can open a long position with a very low risk. The break of this level will be our next trigger for a long position.
The main long trigger is 113429. Breaking this resistance can initiate the next upward movement for Bitcoin.
But the volume needs to increase. Any movement accompanied by decreasing volume is a strong sign of trend weakness and won’t last long.
If you already have a long position from 108943, you can take profits if the trend confirms and the price gets rejected at 111645.
For short positions, we should wait for the market structure to change and for a short trigger to appear.
❌ Disclaimer ❌
Trading futures is highly risky and dangerous. If you're not an expert, these triggers may not be suitable for you. You should first learn risk and capital management. You can also use the educational content from this channel.
Finally, these triggers reflect my personal opinions on price action, and the market may move completely against this analysis. So, do your own research before opening any position.

TradeCityPro | Bitcoin Daily Analysis #204👋 Welcome to TradeCity Pro!
Let’s go over today’s Bitcoin analysis, Bitcoin is still ranging, so let’s take a close look at the market together.
⏳ 1-Hour Timeframe
Yesterday, Bitcoin had a short position trigger at the 107,486 zone, which was activated.
🔔 The break of this level created a short-term bearish move, and if you had opened a position on Bitcoin, you probably hit your stop-loss by now.
✨ However, considering the dominance charts, short positions on altcoins made more sense — and if you had opened them, they likely hit their targets.
✔️ Currently, after the fake-out of this zone and the breakout above 108,943, price has made a bullish move up to the next resistance area at 110,213.
💥 Now, price has returned again to the 108,943 level. Volume has decreased along this move, and overall, this drop in volume shows that the market isn’t in a great condition — so the best move for now is to stay without a position.
📊 For short-term trades, if price breaks 110,213, we can open a continuation long position.
💡 For short positions, the current trigger is still 107,486, but since this level has already been faked once, we should wait for another reaction to it — and only open a position if it breaks again on the next attempt.
❌ Disclaimer ❌
Trading futures is highly risky and dangerous. If you're not an expert, these triggers may not be suitable for you. You should first learn risk and capital management. You can also use the educational content from this channel.
Finally, these triggers reflect my personal opinions on price action, and the market may move completely against this analysis. So, do your own research before opening any position.

TradeCityPro | Bitcoin Daily Analysis #203👋 Welcome to TradeCity Pro!
Let’s get into today’s Bitcoin analysis. The market is really uncertain right now and is showing a lot of random, irrational volatility. It’s very important to stay closely updated in these kinds of situations — so let’s dive into the chart.
⏳ 1-Hour Timeframe
Yesterday, Bitcoin made an upward move and managed to reach the 113,429 zone.
⭐ However, after this move, the price faced a strong rejection from that level, completely retraced the entire upward move, and is now back around the 107,486 support zone.
✔️ We can say that this move was a Dead Cat Bounce (DCB) because heavy bearish momentum has now entered the market, and Bitcoin is currently fluctuating around 107,486.
✨ A break of this level will give us the main confirmation of a bearish continuation, and the next bearish leg of Bitcoin could begin.
🧩 For now, it’s better not to rely on momentum oscillators like RSI, since the market lacks clear momentum. However, the volume shows that buyers have been trying to defend the 107,486 support — but as long as the price stays below 113,429, those efforts won’t have much impact.
💥 I’ll open a short position if 107,486 breaks. The next zones that the price might react to are 106,319 and 104,488.
🔔 For long positions, there’s currently no valid trigger — we’ll need to wait until a proper structure forms.
❌ Disclaimer ❌
Trading futures is highly risky and dangerous. If you're not an expert, these triggers may not be suitable for you. You should first learn risk and capital management. You can also use the educational content from this channel.
Finally, these triggers reflect my personal opinions on price action, and the market may move completely against this analysis. So, do your own research before opening any position.

TradeCityPro | Bitcoin Daily Analysis #202👋 Welcome to TradeCity Pro!
Let's dive into the Bitcoin analysis. The market has dropped again today. Let's review today's entry points together.
⏳ 1-Hour Timeframe
Yesterday, Bitcoin was rejected from the resistance it created at 111645, and with the bearish structure it formed, it made a bearish move after breaking 110213.
💥 The reason I removed the zone is that the price no longer reacts to it, and it seems that a box has formed between 111645 and 106319.
✅ The trigger that the price is currently on is the 107486 zone. Breaking this zone can give us a very risky and short-term short position.
✨ The RSI oscillator is near the Oversell zone, and with stabilization below this zone, there is a higher chance of a more significant bearish move with more momentum.
🔍 However, I can't rely much on momentum oscillators like RSI in these market conditions since there isn't a clear trend, and we don't have significant momentum to analyze the market with.
🧩 In these conditions, I believe the best tool to use is volume. Right now, selling volume is higher in the market, and in this bearish correction, the volume is decreasing. So, by breaking 107486, we can open a short position.
⚡️ If the market forms more structure and a long trigger appears, we can also open a long position after breaking the trigger.
💡 But the main triggers for long are breaking 111645, and for short, it's breaking 106319. The triggers between these two zones are very risky positions, and I won’t open a position with them. I prefer to wait for the main triggers.
❌ Disclaimer ❌
Trading futures is highly risky and dangerous. If you're not an expert, these triggers may not be suitable for you. You should first learn risk and capital management. You can also use the educational content from this channel.
Finally, these triggers reflect my personal opinions on price action, and the market may move completely against this analysis. So, do your own research before opening any position.

TradeCityPro | Bitcoin Daily Analysis #201👋 Welcome to TradeCity Pro!
Let’s dive into Bitcoin analysis—its bullish trend seems to have started again, so it’s very important to analyze it well for the new week.
⏳ 1-Hour Timeframe
Yesterday, Bitcoin formed a range box between 106319 and 107301, and by breaking the top of this box, it began an upward move.
📊 After breaking this box, buying volume increased sharply, and after a pullback to this area, the move continued up to 111645.
✔️ Now the price has returned above the 109000 zone, but it still hasn’t managed to hold above this area.
⭐ With a break of 111645, we can confirm that price has stabilized above the 109000 zone.
🔍 In that case, we can enter a long position on the break of 111645; and at the same time, we’ll confirm that the break of 109000 was a fake-out.
💥 The trigger on the RSI is the 74.53 level. With RSI entering Overbought and breaking 74.53, the next bullish leg can begin.
❌ Disclaimer ❌
Trading futures is highly risky and dangerous. If you're not an expert, these triggers may not be suitable for you. You should first learn risk and capital management. You can also use the educational content from this channel.
Finally, these triggers reflect my personal opinions on price action, and the market may move completely against this analysis. So, do your own research before opening any position.

TradeCityPro | Bitcoin Daily Analysis #199👋 Welcome to TradeCity Pro!
Let's move on to the Bitcoin analysis—finally, the support zone that Bitcoin had has been broken. Let’s review what has happened in the market.
⏳ 1-Hour Timeframe
Yesterday, Bitcoin was in a consolidation range between 110,420 and 111,714.
✔️ Bearish signals, such as Dow Theory structure and high volume on bearish candles, were visible on the chart. Eventually, this led to a break of the consolidation from the bottom, and the support zone was lost.
🔍 After breaking this area, the price retraced and, with a consolidation below 107,790, confirmed the breakdown.
⭐ Currently, the price is at 104,483 and has reacted to it. The RSI oscillator has also reacted to its support area at 22.19 and has been holding near this support for several candles.
📉 If the price continues to drop, this 104,483 level serves as a suitable trigger for the next entry point. Breaking this level could push the price toward the next support zones.
🔔 However, if the price moves upward and fully fakes this drop, a consolidation above 111,714 would confirm a bullish reversal for Bitcoin, allowing us to open long positions with much higher momentum.
💡 I personally opened a short position at the break of 110,420 and am not taking profit yet because it’s a good entry point. In the future, if the market drops, it will provide strong support for subsequent positions.
💥 If the market moves upward and this short gets stopped, strong bullish momentum will enter, making the long positions we open in the next leg very attractive.
❌ Disclaimer ❌
Trading futures is highly risky and dangerous. If you're not an expert, these triggers may not be suitable for you. You should first learn risk and capital management. You can also use the educational content from this channel.
Finally, these triggers reflect my personal opinions on price action, and the market may move completely against this analysis. So, do your own research before opening any position.

TradeCityPro | Bitcoin Daily Analysis #198👋 Welcome to TradeCity Pro!
Let’s move on to the Bitcoin analysis. The price is in a very sensitive area, so it’s important to have a proper analysis.
⏳ 1-Hour Timeframe
Bitcoin is still near its support zone and is ranging around 110,420.
⭐ The top of the range is 111,714, and the price is forming a compression.
✨ At the same time, the RSI has formed a range between 30 and 50 and is oscillating.
📊 If 110,420 breaks, the probability of breaking the range increases significantly, and this level can serve as a good early short trigger.
📈 For long positions, we can open the first position on a break of 111,714. The next entry points would be 113,218 and 115,698.
🔔 Currently, market volume is very important and decisive; the volume favors sellers, which increases the probability of a bearish scenario. If this volume persists, Bitcoin’s support zone could break.
💥 However, if we see a change in volume and buying volume exceeds selling volume, we can expect Bitcoin to be supported in this area and move upwards.
❌ Disclaimer ❌
Trading futures is highly risky and dangerous. If you're not an expert, these triggers may not be suitable for you. You should first learn risk and capital management. You can also use the educational content from this channel.
Finally, these triggers reflect my personal opinions on price action, and the market may move completely against this analysis. So, do your own research before opening any position.

Gold Analysis - Can Buyers Push the Price to $4,250?OANDA:XAUUSD is currently moving within a clearly defined upward channel, with prices consistently adhering to both the upper and lower boundaries of the channel. The recent bullish momentum indicates that the buyers are in control, creating a strong possibility for the uptrend to continue in the near future.
Recently, the price broke through a key resistance level and is now retracing to test it again. If this level holds as support, it will further reinforce the bullish structure, and the next target of 4,250 will become attainable, aligning with the upper boundary of the channel.
As long as the price remains above this support zone, the bullish outlook will remain intact. However, if the support is broken, the bullish scenario could be invalidated, increasing the likelihood of a deeper pullback.
Remember, before making any trading decisions, always confirm your setups and ensure you are managing risk effectively.

TradeCityPro | Bitcoin Daily Analysis #197👋 Welcome to TradeCity Pro!
Let’s go over the Bitcoin analysis; today Bitcoin is still in a downtrend, so let’s review the market together.
⏳ 1-Hour Timeframe
After the double top that was activated yesterday near the 0.5 Fibonacci level, Bitcoin entered a corrective phase after reaching the double top target.
✨ The double top peaks formed around 115,698, but after completing the downward move and starting the correction, the price created lower highs around 113,218, and now with the break of 111,975, a new high-volume downward move has started.
📊 The price is moving back toward the supply zone it had, and reaching this area is not a good sign for the upward trend we see on higher timeframes.
🔽 The more the price approaches this zone and reacts to it, the weaker the zone becomes, and the probability of it breaking increases in subsequent attempts.
✔️ Currently, this is the third time the price is approaching this zone, and each time it comes with higher volume and a stronger bearish structure; if this pattern repeats several times, the zone could break.
🔍 Whether the price breaks or finds support at this zone can determine the market’s direction for the upcoming period.
⚡️ If the zone breaks, Bitcoin could enter a corrective and range-bound phase for weeks or even months, and we wouldn’t be able to open positions effectively in that environment.
📈 If the zone holds as support, with a break above 115,698, we would get confirmation of Bitcoin’s bullish trend and could expect the next upward move to begin.
❌ Disclaimer ❌
Trading futures is highly risky and dangerous. If you're not an expert, these triggers may not be suitable for you. You should first learn risk and capital management. You can also use the educational content from this channel.
Finally, these triggers reflect my personal opinions on price action, and the market may move completely against this analysis. So, do your own research before opening any position.

Gold (XAU/USD) Bullish Continuation After RetracementThe chart shows a **bullish market structure** for XAU/USD following a strong upward move and a current corrective phase. Price formed a **weak high** near the 4,175 level after breaking structure (BOS) to the upside. It is now retracing toward a **demand zone** around 4,100–4,105, highlighted in purple, which could act as a **potential reversal area**. Equal highs (EQH) suggest liquidity resting above, indicating that after a possible short-term dip, the market may rebound strongly to target the **previous high** and possibly break above the weak high zone. Overall, the projection favors a bullish continuation after a retracement.

TradeCityPro | Bitcoin Daily Analysis #196👋 Welcome to TradeCity Pro!
Let’s go over Bitcoin's analysis. The price is moving down again, so let’s review Bitcoin's movement together.
⏳ 1-Hour Timeframe
Yesterday, we had a trigger at the $115,698 zone, but the price couldn't sustain above this level, and Bitcoin's downward movement has started again.
✔️ A double top pattern has formed in this timeframe, and the trigger for this pattern activation was $113,991, which has now been activated. With the large volume, the price has managed to stabilize even below the $111,278 zone.
💥 The RSI oscillator has once again entered Oversell, and the price has reached near our support zone.
⚡️ If this support zone is broken, we can open a short position. Otherwise, I won’t be opening any short positions with other triggers.
📈 For a long position, we need a very strong reaction and significant bullish momentum at the support zone. In this case, the main trigger for a long would be $115,698, but we can also use earlier triggers if they form.
📊 For now, I will wait to see how the price reacts to the zone and then look for the trigger. The only trigger I have at the moment is $115,698.
❌ Disclaimer ❌
Trading futures is highly risky and dangerous. If you're not an expert, these triggers may not be suitable for you. You should first learn risk and capital management. You can also use the educational content from this channel.
Finally, these triggers reflect my personal opinions on price action, and the market may move completely against this analysis. So, do your own research before opening any position.

TradeCityPro | Bitcoin Daily Analysis #195👋 Welcome to TradeCity Pro!
Let’s move on to Bitcoin analysis. Yesterday, price started an upward move, so let’s see what triggers we have today.
⌛️ 1-Hour Timeframe
Yesterday, price found support at our key zone and also activated the 112,420 risk trigger we had identified.
✨ If you opened a position, it’s not a bad time to take profits, since this was a risky setup, and such positions should be managed quickly.
🧮 Currently, a resistance high has formed around 115,698. If this level breaks, price could continue its upward movement.
💫 As long as price stays above 112,420, this trigger remains active and can be used to open positions.
✔️ For shorts, I personally won’t be taking any until price breaks below 107,000 and stabilizes under that zone.
❌ Disclaimer ❌
Trading futures is highly risky and dangerous. If you're not an expert, these triggers may not be suitable for you. You should first learn risk and capital management. You can also use the educational content from this channel.
Finally, these triggers reflect my personal opinions on price action, and the market may move completely against this analysis. So, do your own research before opening any position.

TradeCityPro | Bitcoin Daily Analysis #194👋 Welcome to TradeCity Pro!
Let’s analyze Bitcoin today, the market has calmed down a bit, and we can perform some analysis.
⏳ 1-Hour Timeframe
In the 1-hour timeframe, Bitcoin has reached a support level around $109,000 and has shown a reaction to this level.
⭐ After the heavy drop that occurred two days ago, the open interest and market volume have decreased significantly, which clearly indicates that market participants are currently indecisive.
✨ Yesterday, the price reacted to the support zone on Bitcoin, and a significant resistance was created around $112,420, which it has now reached again.
💥 The RSI oscillator has finally moved out of the Oversell zone, and it’s currently below the 50 level.
🧮 Although there’s still fear and a bearish momentum in the market, breaking the $112,420 resistance could be a very risky long trigger.
✔️ Personally, I’m waiting and observing. However, for those who like to open positions every day, breaking this resistance is the only long trigger I can provide.
💡 For a short position, we could enter after the price breaks below the level. I’m passing on this position for now and will wait for a confirmation to search for a short trigger after the price stabilizes below this zone.
❌ Disclaimer ❌
Trading futures is highly risky and dangerous. If you're not an expert, these triggers may not be suitable for you. You should first learn risk and capital management. You can also use the educational content from this channel.
Finally, these triggers reflect my personal opinions on price action, and the market may move completely against this analysis. So, do your own research before opening any position.

TradeCityPro | Bitcoin Daily Analysis #193👋 Welcome to TradeCity Pro!
Let’s analyze Bitcoin, yesterday, a phenomenon called a Flash Crash occurred, and the market experienced a massive drop. Let’s review what happened and where the market stands now.
⏳ 4-Hour Timeframe
Before diving into the chart, let’s first understand what happened in the broader market.
🔍 Yesterday, the U.S. restricted the sale of certain computer chips to China,
and in response, China halted exports of five rare elements to the U.S.
📰 Then, the U.S. reimposed heavy tariffs on China, and China raised duties on American ships.
✨ These escalating tensions severely impacted global markets — and we witnessed the largest Flash Crash in Bitcoin’s history.
📉 A total of $19 billion worth of positions were liquidated, marking the highest figure ever recorded in crypto history.
To put that into perspective, during the COVID crash, only about $3 billion was liquidated — a massive difference.
🔔 Interestingly, Bitcoin dropped less compared to most altcoins and managed to recover partially.
However, altcoins like TON, AVAX, ARB, and SUI (each with their own networks) saw brutal crashes, many with wicks of 60–70% downward.
📊 Now, looking at the chart, yesterday, Bitcoin was ranging above the $120,835 zone.
🧮 Once the geopolitical tension began, the price started a strong downward move, breaking below its key support.
🔽 After two large red candles and a close below support, the third candle formed a 12% wick, dropping as low as $102,000.
✔️ Following that, the price quickly recovered and is now consolidating above the $109,000 support zone.
💡 At the moment, in such a highly volatile environment, finding valid triggers and opening new positions isn’t ideal.
🔑 The price action has been driven mostly by news and panic, so it’s best to wait until the market stabilizes and the effects of these developments fade away.
❌ Disclaimer ❌
Trading futures is highly risky and dangerous. If you're not an expert, these triggers may not be suitable for you. You should first learn risk and capital management. You can also use the educational content from this channel.
Finally, these triggers reflect my personal opinions on price action, and the market may move completely against this analysis. So, do your own research before opening any position.

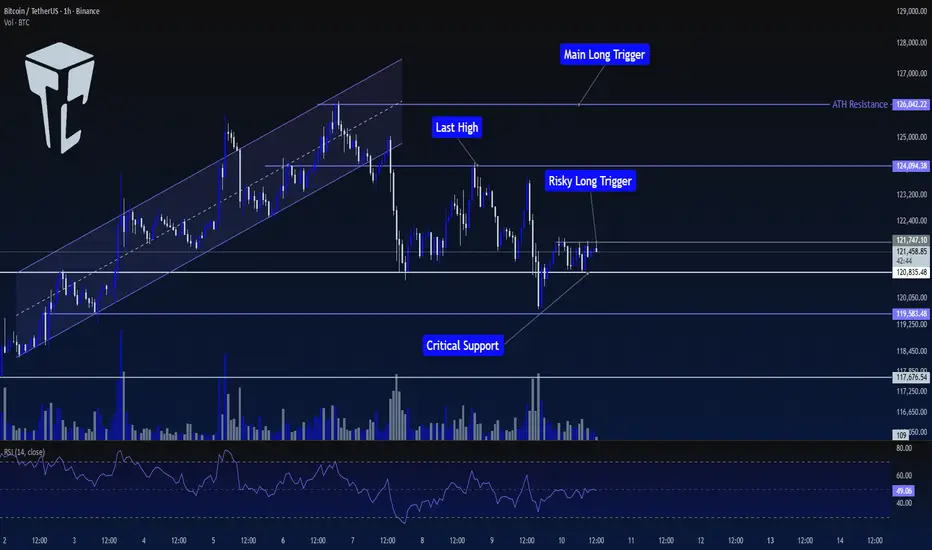
TradeCityPro | Bitcoin Daily Analysis #192👋 Welcome to TradeCity Pro!
Let's dive into Bitcoin analysis. Today, Bitcoin is still in a consolidation and range-bound phase. Let’s take a look at the current market conditions.
⏳ 1-Hour Timeframe
In yesterday’s analysis, Bitcoin was in the process of breaking the $120,835 level. I mentioned that I wasn't opening any short positions yet, but a rejection of this downward movement could be a good sign for a potential upward move.
⭐ This scenario played out, and the price has now moved back above $120,835, which gives us an opportunity to look for long triggers.
✔️ One trigger that has formed is $121,747, which can be used as a risky trigger for a long position.
📊 Market volume has decreased slightly, so it’s better to wait for an increase in volume when this level is broken, as that would raise the likelihood of an upward move.
📈 The next reliable long triggers we have are $124,094 and $126,042. These triggers are more reliable for a position, but they are currently farther from the price, so the chance of them activating today is lower.
💥 For short positions, I'm still not focusing on them and prefer to focus on long positions. Therefore, I currently don’t have any short triggers to provide.
❌ Disclaimer ❌
Trading futures is highly risky and dangerous. If you're not an expert, these triggers may not be suitable for you. You should first learn risk and capital management. You can also use the educational content from this channel.
Finally, these triggers reflect my personal opinions on price action, and the market may move completely against this analysis. So, do your own research before opening any position.