Gold (XAU/USD) Short-Term Bullish Setup After RetracementThe XAU/USD (Gold vs U.S. Dollar) 15-minute chart shows a potential bullish setup after a short-term pullback. Price is currently reacting from a bearish order block in the red supply zone around 4040–4045, suggesting a possible retracement. The projected move anticipates a decline toward the blue demand zone near 4009 before a strong upward reversal targeting the weak high area around 4055–4060. The chart also highlights a change of character (CHoCH) confirming a shift in short-term momentum, implying that buyers may regain control after the corrective dip.
Dailyanalysis

TradeCityPro | Bitcoin Daily Analysis #190👋 Welcome to TradeCity Pro!
Let’s dive into today’s Bitcoin analysis. The market, after experiencing a decline, is now ready to resume its primary bullish trend.
⏳ 1-Hour Timeframe
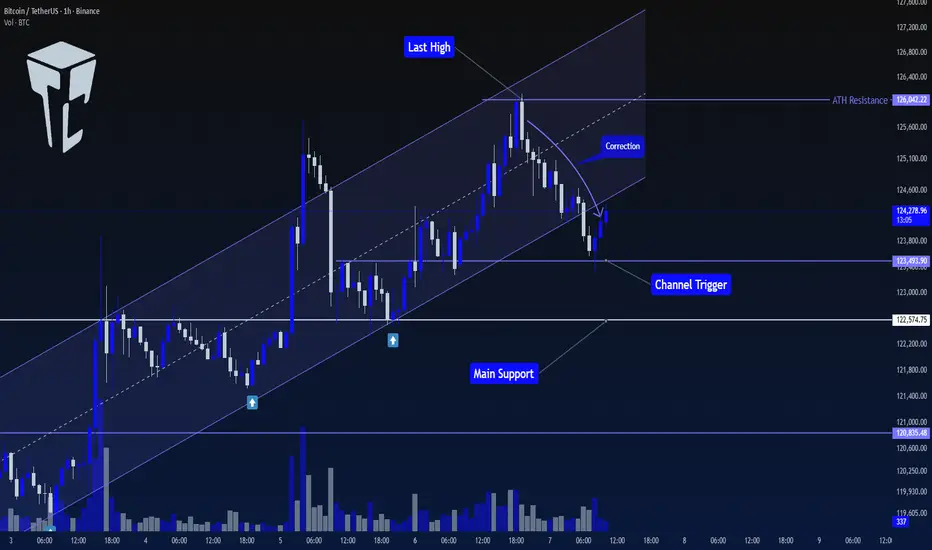
Yesterday, after Bitcoin confirmed a break below the channel, it retested the channel and activated the trigger at 123493, leading to a brief bearish movement.
📊 The first support zone was 122574, but the price didn't react to it, resulting in a break below. The next key support zone was 120835, where the price reacted and formed a low.
✨ After the price found support at 120835, a peak formed at 122084, creating a compression between 120835 and 122084.
📈 Currently, after breaking above the compression range, a bullish movement has started, and the price has reached back above 123491.
⚡️ The good thing about the correction to 120835 is that many long positions that hadn’t taken profit were now closed, reducing selling pressure in the market. This provides Bitcoin a chance to continue its bullish trend with a more structured approach.
🚀 However, if the price fails to break the previous high of 126042, a lower high would form, which is a sign of weakness in the bullish trend.
🎲 If that happens, and if the price stabilizes below 120835, we’ll get confirmation of a bearish shift in this timeframe. But for now, this hasn’t happened, and the market momentum remains bullish.
🔍 For a new position, if you haven’t opened a position after breaking 122084, there is no valid trigger at the moment, and we should wait for the market to create a proper structure for entry. Otherwise, the only trigger we have right now is breaking 126042.
🔽 For a short position, I am waiting for the trend change scenario to unfold before considering any short triggers.
❌ Disclaimer ❌
Trading futures is highly risky and dangerous. If you're not an expert, these triggers may not be suitable for you. You should first learn risk and capital management. You can also use the educational content from this channel.
Finally, these triggers reflect my personal opinions on price action, and the market may move completely against this analysis. So, do your own research before opening any position.

TradeCityPro | Bitcoin Daily Analysis #189👋 Welcome to TradeCity Pro!
Let’s move on to the Bitcoin analysis. Yesterday, after setting a new ATH, Bitcoin began its correction — let’s review the market together.
⏳ 1-Hour Timeframe
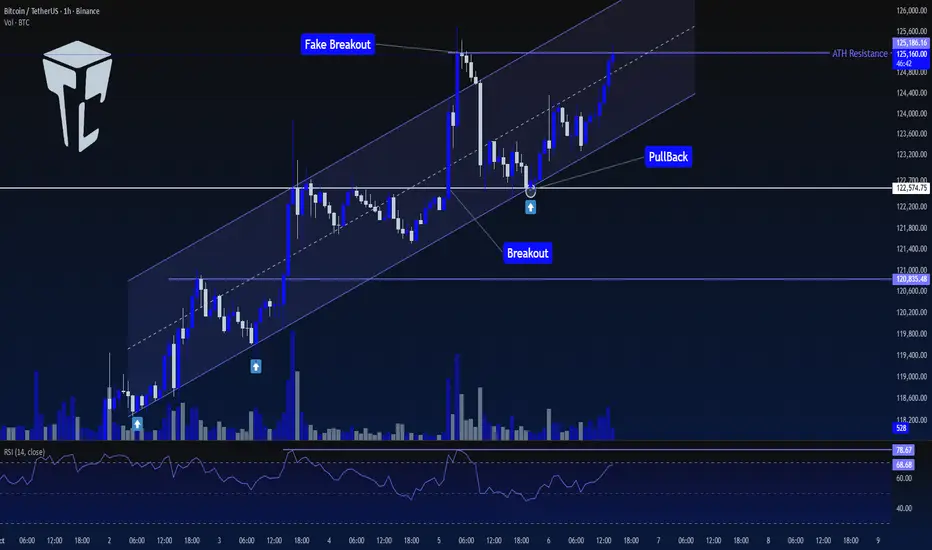
On the 1-hour timeframe, Bitcoin had been moving inside an ascending channel that had provided multiple supports. However, after being rejected from 126042, the price experienced a downward move and broke the channel to the downside.
⭐ The channel breakout trigger is at 123493, where the price has already reacted once, and it’s now moving slightly upward with very low volume.
📊 If this low-volume bullish movement continues, the likelihood of trigger activation will increase, and in that case, the price could move toward 122574.
🔍 For now, none of these triggers are suitable for short positions, as the market still looks too bullish to consider shorting.
✨ For long positions, the current trigger is 126042. However, if the market consolidates longer and forms a new structure, we might find an opportunity to enter earlier.
❌ Disclaimer ❌
Trading futures is highly risky and dangerous. If you're not an expert, these triggers may not be suitable for you. You should first learn risk and capital management. You can also use the educational content from this channel.
Finally, these triggers reflect my personal opinions on price action, and the market may move completely against this analysis. So, do your own research before opening any position.
TradeCityPro | Bitcoin Daily Analysis #188👋 Welcome to TradeCity Pro!
Let’s move on to the Bitcoin analysis. Today, after pulling back to its previous resistance, Bitcoin is ready to start its next move.
⏳ 1-Hour Timeframe
On the 1-hour timeframe, Bitcoin continues its upward trend. Yesterday, after a pullback to the 122574 area and support from the channel’s bottom, it is once again ready to begin its next leg upward.
✨ The top formed at 125186 is Bitcoin’s new ATH resistance, and breaking this level would lead to further bullish continuation.
✅ Today, if this level breaks, we can have a long position on Bitcoin. If you already have an open position, there’s no need to re-enter at this point — it’s better to look for opportunities in other coins.
🎲 Since Bitcoin’s dominance trend is generally declining, if the next bullish leg begins, altcoins could also become attractive options. Therefore, it’s best to hold one position on Bitcoin and another on selected altcoins.
❌ Disclaimer ❌
Trading futures is highly risky and dangerous. If you're not an expert, these triggers may not be suitable for you. You should first learn risk and capital management. You can also use the educational content from this channel.
Finally, these triggers reflect my personal opinions on price action, and the market may move completely against this analysis. So, do your own research before opening any position.
TradeCityPro | Bitcoin Daily Analysis #187👋 Welcome to TradeCity Pro!
Let’s go over Bitcoin’s analysis — today, Bitcoin has recorded a new ATH. Let’s review the market conditions together.
📅 Daily Timeframe
In the daily timeframe, Bitcoin is moving inside an ascending channel with a steady upward slope.
⭐ After a corrective move from the top of the box, the price made a fake breakdown of the channel’s bottom and then, with the bullish momentum that followed, moved upward and managed to set a new ATH.
✔️ During the correction, the volume was decreasing, but after the price was supported at the key support zone and the fake breakdown occurred, buying volume entered the market.
✨ The main confirmation of the bullish continuation could be taken after breaking above 117056. Currently, the next confirmation trigger is a price stabilization above 123433.
💥 In my opinion, since RSI is getting rejected from the 70 level and the price has reached a strong resistance zone, there’s a high chance that the market will range below this resistance for a few days to test it.
🧩 At the moment, the main RSI resistance level seems to be 75.38 — if this level breaks, the main market momentum could start, leading to a sharp move upward.
📊 It’s completely normal for the trend to show weakness after reaching an ATH, because this level is Bitcoin’s largest supply zone. These wicks hitting the resistance zone don’t necessarily mean trend weakness — it’s typical for the price to form such candles when testing its all-time high.
🔑 What really matters is how the price reacts in the next few attempts at this zone, which will tell us whether we have an actual trend weakness or not.
💫 Right now, the most important support Bitcoin has built is around 107000. If a bearish move begins, the first confirmation of a downtrend will be breaking this area. However, the main confirmation of a full bearish reversal would be the break of 100961.
🎲 Overall, since the price is currently at the top of the market, finding precise triggers on Bitcoin is difficult. But considering Bitcoin dominance has the potential to drop, altcoins could provide excellent trading setups in the coming days if that dominance decline begins.
❌ Disclaimer ❌
Trading futures is highly risky and dangerous. If you're not an expert, these triggers may not be suitable for you. You should first learn risk and capital management. You can also use the educational content from this channel.
Finally, these triggers reflect my personal opinions on price action, and the market may move completely against this analysis. So, do your own research before opening any position.

XAUMO GOLDEN REPORT – The Golden Analysis for XAUUSD (Footprint)XAUMO GOLDEN REPORT – The Golden Analysis for XAUUSD (Footprint 15m/60m/240m/1D)
🗓️ Date/Time: 3 October 2025 — 08:15 UTC+3
📊 Prices now: Ask 3851.77 / Bid 3851.47
Today’s levels from the footprint: 3863/3859 = intraday resistance — 3855 = Pivot — 3848/3840 = trading support — 3819 = deeper support.
15 Minutes (Scalping)
Price action: A quick buying thrust to 3851.7 then a sharp pullback; positive-delta candles at the top followed by negative-delta blocks = failed buying and quick distribution.
Volume: A volume explosion on the brief breakout, then calm with a negative tilt — the seller is holding the reins for the moment.
Range: 3859 ↔ 3848; every rise to 3855–3859 is met with offers (absorption).
60 Minutes
Internal trend: Down/sideways below 3860; a sequence of negative blocks on the minor highs.
VWAP/Fibo: Price is below the 3855 pivot and near the 50–61.8% retracement of yesterday’s wave, which favors an extension lower toward 3840 if the bounce fails.
4 Hours (240m)
Structure: After a weekly high, an orderly correction from the 3890s; the nearest important low is 3819.3, and a mid-balance zone is 3840–3828.
Momentum: Tilted to the downside with short-term lower highs.
Daily (General Trend)
Larger trend: Up, but with two clear days of profit-taking.
Candles/Volume: Longer upper wicks + elevated volume at the highs = distribution. Holding below 3860 keeps the corrective scenario open toward 3828–3819.
XAUMO’s Plan (Educational only, not advice)
The preferred scenario today: sell the pullback to the pivot.
Order Type Entry Stop Loss Take Profit Confidence
Main Trade Sell Limit 3855.20 3863.60 3838.00 🔥 81%
Reason (focused and straight):
3855–3859 is a repeatedly offered area (absorption + negative delta after a failed 15m thrust).
Staying below VWAP/Pivot 3855 = bearish bias toward 3840/3838.
60m structure is short-term down; any rise toward 3859 is likely just a pullback.
Alternative plan (if it rips upward):
Buy Stop 3864.20 → TP 3878.50 → SL 3856.80 only if a 15m candle closes above 3864 (price acceptance above resistance).
Invalidating the bearish scenario:
A steady close above 3864 cancels the short and shifts thinking to buying the breakout as above.
Risk management:
Risk ≤ 0.6% of capital; no chasing — keep your entry pending at the specified zone.
Conclusion: Today the market tends toward a corrective decline below 3860. Sell the pullback from 3855–3859 and target 3838; give new highs their due only if there is acceptance above 3864 — otherwise, the plan is bearish.

TradeCityPro | Bitcoin Daily Analysis #186👋 Welcome to TradeCity Pro!
Let’s move on to Bitcoin analysis. Bitcoin is still pushing upward, so let’s review the market conditions together.
⌛️ 4-Hour Timeframe
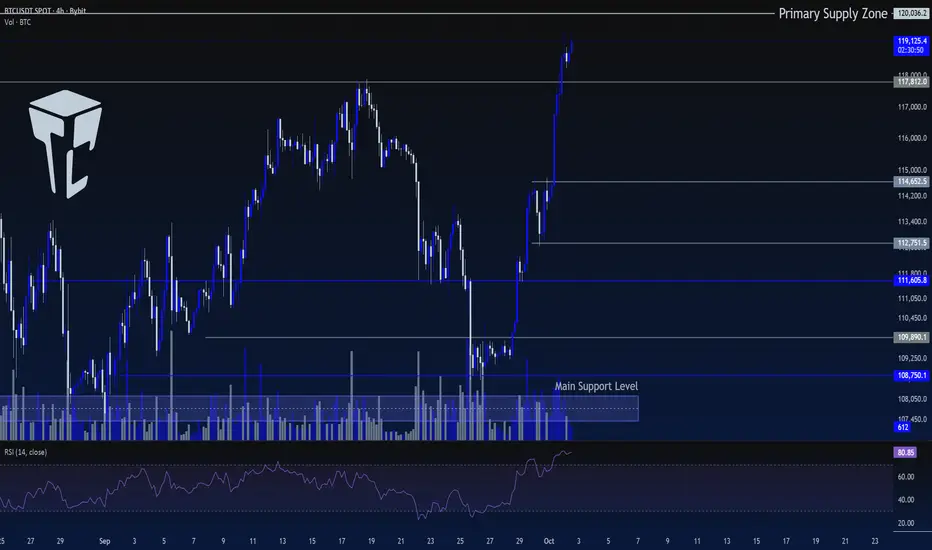
Yesterday, Bitcoin reached the next resistance level at 117,812.
🔍 On the lower timeframes, there was a small rejection from this zone, but on the 4-hour chart, price managed to hold above it and is now moving toward the 120,036 level.
🔔 Given the strong buying power and the heavy volume in the market, I believe the probability of continuation to the upside is very high, and price could push to even higher zones.
💥However, the RSI oscillator is currently deep in the overbought zone, sitting around 80. That’s quite an extreme level, and a correction in RSI is almost certain soon.
✔️ This doesn’t necessarily mean the uptrend is over. Price can still continue upward while RSI corrects.
⚡️ As long as RSI remains above 70 and stays in overbought territory, I expect the bullish leg to continue. Once RSI stabilizes below 70, price may enter a corrective phase.
⭐ In that case, we can look for long triggers during the price correction to catch the next bullish wave.
📊 If Bitcoin keeps rallying, the next zone to watch as a potential trigger will be 120,036. A reaction at this level could give us a new long setup.
💫 That said, on the first touch of 120,036, I personally won’t be opening a position—even if it breaks. I’ll wait for more structure to form before making an entry.
❌ Disclaimer ❌
Trading futures is highly risky and dangerous. If you're not an expert, these triggers may not be suitable for you. You should first learn risk and capital management. You can also use the educational content from this channel.
Finally, these triggers reflect my personal opinions on price action, and the market may move completely against this analysis. So, do your own research before opening any position.
XAUUSD 30-Minute Chart Analysis Potential Bullish Reversal The chart shows a technical analysis of the XAUUSD (Gold vs. US Dollar) on the 30-minute timeframe, using Smart Money Concepts (SMC). Key elements include areas marked as "Orderblocks," "CHoCH" "BOS" and "Equi" suggesting institutional trading behavior. The blue zone represents a demand area where price previously reversed, hinting at potential bullish activity if price revisits it. The projected price movement (illustrated by the blue arrow) suggests a short-term dip into this demand zone, followed by a bullish move towards a weak high at the 3,891.093 level. Overall, the analysis implies a potential long (buy) setup if price reacts positively in the highlighted demand area.

TradeCityPro | Bitcoin Daily Analysis #185👋 Welcome to TradeCity Pro!
Let’s move on to the Bitcoin analysis. Bitcoin’s bullish trend is still continuing, and today during the London session it made another upward move. Let’s review today’s triggers together.
⏳ 1-Hour Timeframe
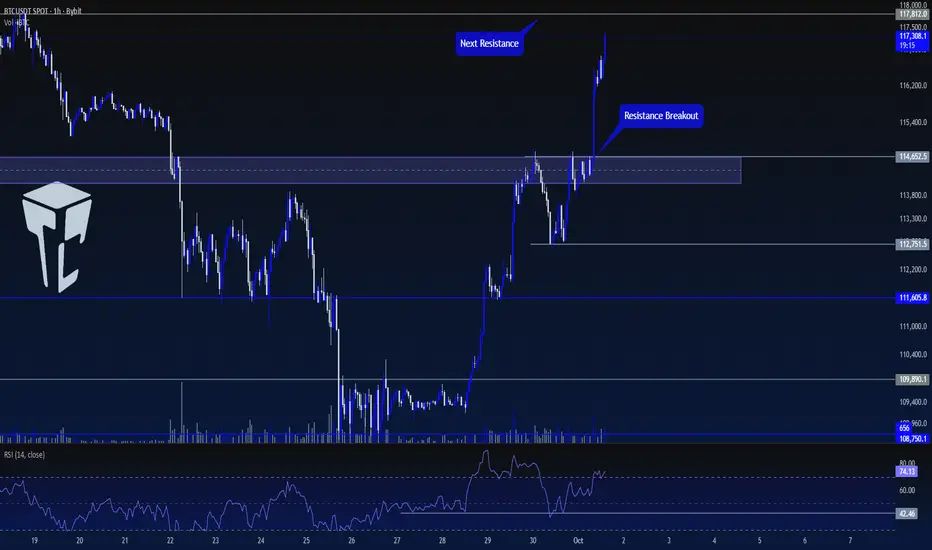
Yesterday, after the correction, Bitcoin formed a bottom at 112751 and with the RSI being supported at 42.46, the upward move started.
🔔 The trigger we had yesterday for opening a position was the breakout of the resistance zone, with the exact trigger forming at 114652. After the breakout, the price started its second upward wave.
💥 The RSI oscillator has also entered the Overbuy zone, and the market momentum is fully bullish. The next resistance we have is at 117812.
💫 If the price reaches 117812 and the RSI exits the Overbuy zone, we can take profit on the position.
✅ For a new position, no fresh trigger can be given right now because the price is moving sharply upward, and opening any new position here would be considered risky with a high chance of hitting stop-loss.
📊 The area I expect the price to react to is 117812, but I will wait for the price to first build a structure before opening a position.
❌ Disclaimer ❌
Trading futures is highly risky and dangerous. If you're not an expert, these triggers may not be suitable for you. You should first learn risk and capital management. You can also use the educational content from this channel.
Finally, these triggers reflect my personal opinions on price action, and the market may move completely against this analysis. So, do your own research before opening any position.
XAUUSD Eyes Bullish Reversal After Retracement to Key DZThe 30-minute chart for XAUUSD (Gold vs US Dollar) illustrates a potential bullish scenario following a recent market structure shift. Price has shown a strong recovery from previous demand zones, marked by bullish order blocks. The current outlook suggests a short-term dip into the blue demand zone around $3,835–$3,840, followed by a possible rally targeting the "Weak High" near $3,865. This move could be driven by liquidity grabs below recent lows before a bullish continuation, making it a key level to watch for intraday traders.

TradeCityPro | Bitcoin Daily Analysis #184👋 Welcome to TradeCity Pro!
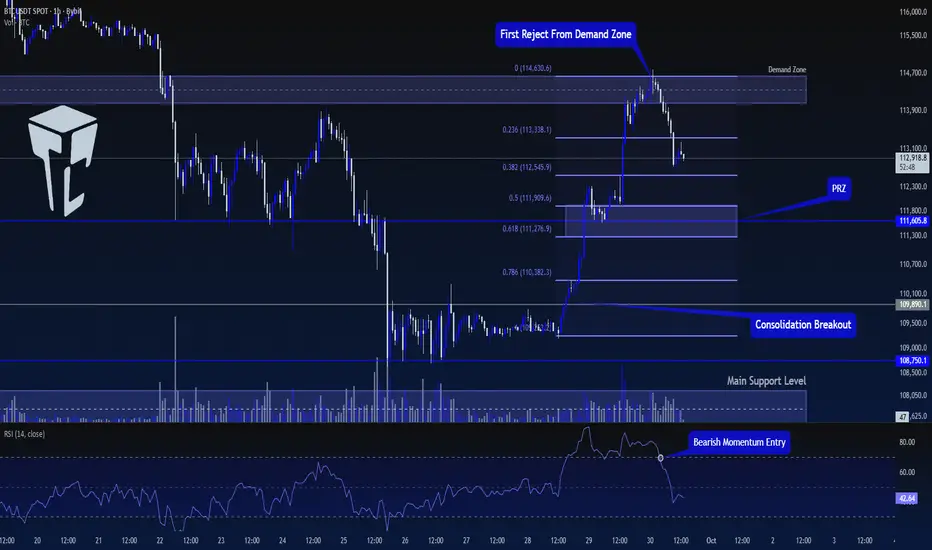
Let's go over the Bitcoin analysis. Yesterday, the price got rejected from a resistance zone, and today, it has started a corrective downward movement. Let's review the market together.
⏳ 1-Hour Timeframe
Yesterday, after the price reached the resistance zone, I mentioned that if the RSI exits the Overbuy zone, we could take profits.
📊 This is exactly what happened. After the price was rejected from the zone, the RSI moved out of the Overbuy zone and started heading downward.
⭐ Currently, the price correction has continued towards the 0.382 Fibonacci level. The trading volume during this correction has not decreased, which indicates that sellers are still active in the market, and their trading volume is not significantly lower than buyers.
🎲 If the price continues its correction and the volume increases at the same rate, the likelihood of a trend reversal and the start of a new downward trend becomes much higher. However, if the volume decreases simultaneously with the correction, the range between the 0.5 and 0.618 Fibonacci levels will be a very important support zone, and the price could find support there.
🔼 For a long position, the trigger we currently have is the breakout of the resistance zone. If we wait for the price to touch this zone a few more times, we can draw the exact numbers for the range and open our position upon its breakout.
⚡️ For a short position, it's better to wait and get confirmation of a bearish trend before looking for triggers. We will confirm the bearish trend if the selling volume increases and lower highs and lows are made.
❌ Disclaimer ❌
Trading futures is highly risky and dangerous. If you're not an expert, these triggers may not be suitable for you. You should first learn risk and capital management. You can also use the educational content from this channel.
Finally, these triggers reflect my personal opinions on price action, and the market may move completely against this analysis. So, do your own research before opening any position.
XAU/USD Bullish Continuation Setup Based on SMCThe chart for XAU/USD (Gold vs. U.S. Dollar) on the 30-minute timeframe shows a bullish market structure with a strong upward trend. A clear Break of Structure (BOS) has occurred, followed by price expansion. Two key supply and demand zones are marked with purple rectangles, indicating possible areas of interest for future price action. The price is currently hovering near 3,867, with an anticipated short-term pullback to the demand zone around 3,850 before a continuation to the upside. The projected bullish path (illustrated by the blue arrow) suggests a higher high targeting above the current resistance area, where a weak high has been identified. This setup aligns with smart money concepts and order block trading strategies, suggesting a potential buying opportunity upon retracement.

TradeCityPro | Bitcoin Daily Analysis #183👋 Welcome to TradeCity Pro!
Let's dive into today's Bitcoin analysis. The market has had an upward movement. Let's see what's ahead in the market.
⏳ 1-Hour Timeframe
Yesterday, I mentioned that there was a high probability of movement and that it would be a good idea to keep an eye on the chart during the New York session as the market could move.
📊 With the start of the New York session, good buying volume entered the market, and after breaking 109890, Bitcoin started an upward wave.
🔑 The first area where the price could have faced resistance was 111605, which was broken on the first attempt. After a pullback, the next leg started.
🚀 The break of 109890, along with RSI entering Overbuy and the entry of buying volume, was a good trigger for a long position, and we could have opened a position with it.
⭐ Now, the price has reached a very important resistance zone, and the probability of a correction starting is high. For taking profit, I suggest you lock in profits whenever RSI exits the Overbuy zone, as this will reduce the upward momentum and increase the chances of a correction.
📈 For new positions, no triggers are available yet, and it's better to wait until the market gives us a clearer structure. However, if the price reacts several times to the level, we can open a long position in subsequent attempts if it breaks.
❌ Disclaimer ❌
Trading futures is highly risky and dangerous. If you're not an expert, these triggers may not be suitable for you. You should first learn risk and capital management. You can also use the educational content from this channel.
Finally, these triggers reflect my personal opinions on price action, and the market may move completely against this analysis. So, do your own research before opening any position.

TODAY XAUUSD M30 BEST MOVE SETUP
Gold (XAU/USD) has shown a strong bullish rally, breaking previous highs and reaching a weak high resistance zone near 3,815. The projection suggests a potential short-term pullback after testing the resistance, with price likely to retrace toward the demand zones around 3,770–3,760. This indicates a possible shift from bullish momentum to a corrective move before the next trend direction is confirmed.

TradeCityPro | Bitcoin Daily Analysis #182👋 Welcome to TradeCity Pro!
Let’s move on to Bitcoin analysis. Today the weekly candle closes, and from tomorrow the market can start moving again.
⌛️ 4-Hour Timeframe
On the 4-hour chart, Bitcoin has started a downward move from the 117,570 high, dropping in two bearish legs down to the 108,750 zone.
✨ After reaching this area, volume began to decrease—both because the market is ranging and because it’s the weekend.
✔️ Yesterday, in my analysis, I highlighted a range box on the 1-hour chart. This same box is still visible now on the 1-hour timeframe, spanning 108,750 to 109,890.
🧩 Today’s New York session is very important, since this session often drives weekend market moves. So watch the market carefully,our triggers might get activated.
🔑 If strong volume enters today and 108,750 breaks, we can look to open a short position. However, keep in mind there’s an important support area just below this level that could prompt a reaction and halt further decline.
⭐ For a long position, the first trigger we have is a breakout of 109,890. But note that the short-term trend is still bearish, so it’s better to wait for bullish confirmation first. A clean break of 109,890, followed by a higher high and higher low above this level, would be a solid confirmation for a potential upward move.
❌ Disclaimer ❌
Trading futures is highly risky and dangerous. If you're not an expert, these triggers may not be suitable for you. You should first learn risk and capital management. You can also use the educational content from this channel.
Finally, these triggers reflect my personal opinions on price action, and the market may move completely against this analysis. So, do your own research before opening any position.

TradeCityPro | Bitcoin Daily Analysis #181👋 Welcome to TradeCity Pro!
Let's dive into Bitcoin analysis, today is Saturday, and it's part of the weekend, so the market is relatively quiet. Bitcoin has shown some bearish movement, and now is a critical moment for decision-making.
⏳ 1-Hour Timeframe
After breaking 111,605, Bitcoin dropped and reached 108,750.
✔️ During the downward move, volume increased, indicating strong selling pressure. However, as the price reached the 108,750 support and formed a range box, volume decreased, and with the start of the Saturday candle, the volume has dropped to its lowest level.
🎲 This box is formed above a very important support level, so breaking this box is crucial.
🔔 If the price breaks the box to the downside, the likelihood of breaking the support increases. However, one important thing to note is that shorting after breaking 108,750 is not an ideal trigger because the price might bounce from the support, causing a stop-loss.
📊 On the other hand, if the box breaks to the upside, we can assume that the price is correcting the downward move and could potentially retrace back to 111,605.
💥 If the price stabilizes above 111,605 or forms a higher high and low above 109,890, we can take this as the first sign of a bullish reversal.
🧩 Overall, neither shorting nor longing seems ideal at the moment, so I believe the best choice is to wait and see if the price either stabilizes below the support and moves downward or moves upward again, in which case we can consider entering a long position.
❌ Disclaimer ❌
Trading futures is highly risky and dangerous. If you're not an expert, these triggers may not be suitable for you. You should first learn risk and capital management. You can also use the educational content from this channel.
Finally, these triggers reflect my personal opinions on price action, and the market may move completely against this analysis. So, do your own research before opening any position.
XAU/USD 15-Minute Supply and Demand Zone AnalysisThis chart shows the price action of **Gold Spot (XAU/USD)** on the 15-minute timeframe with Smart Money Concepts (SMC) analysis applied. Key supply and demand zones are highlighted, with a supply zone marked around the **3745–3750 range** and a strong demand zone (strong low) near the **3710–3715 level**. The chart indicates multiple **Break of Structure (BOS)** and **Change of Character (CHoCH)** points, showing shifts in market momentum. The projection drawn suggests a possible short-term downward move into the demand zone before a strong bullish reversal toward the upside, targeting the weak high area above **3760–3770**. This implies a bullish outlook once the price retests lower support levels.

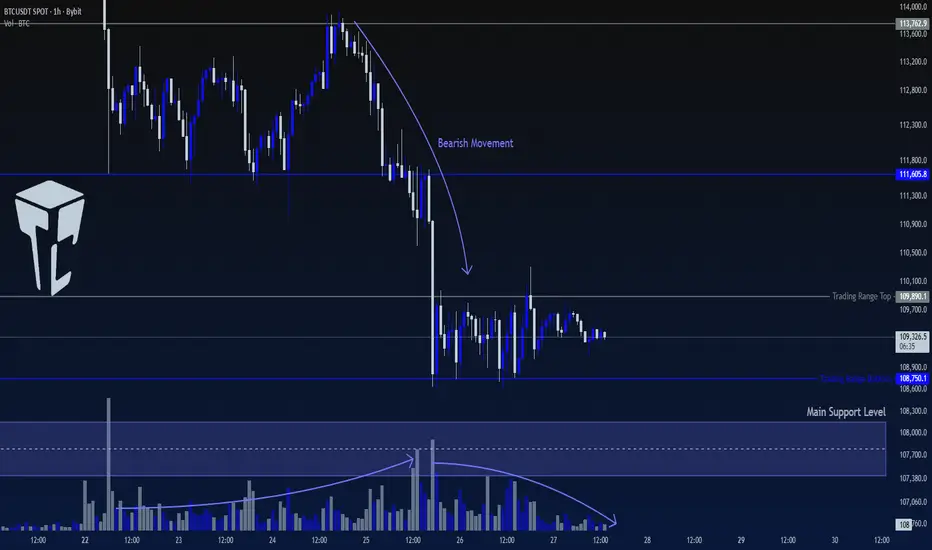
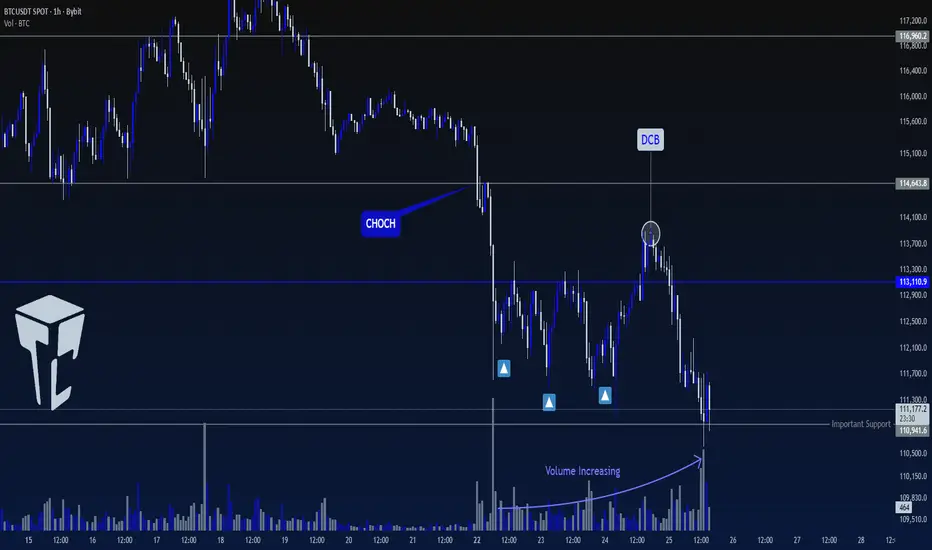
TradeCityPro | Bitcoin Daily Analysis #180👋 Welcome to TradeCity Pro!
Let’s move on to Bitcoin analysis. Yesterday Bitcoin continued its drop and made another downward move. Let’s check the market together.
⏳ 1-Hour Timeframe
Bitcoin in the 1-hour timeframe started a downward move and, with consolidation below the 114643 area, turned bearish in lower cycles.
⭐ After finishing the first bearish leg, the price formed a top around the 113110 area and made a deep correction up to above this area, which can be called a DBC, because after that a new downward move started.
✔️ At the moment the price is on the 110941 support, and during this downward move that happened after the break of 114643, the volume has completely increased and the volume of bearish candles has been much higher than bullish candles.
🔑 Breaking the 110941 area can start the next bearish leg. In this case the next move can be much longer and the price can move down with more bearish momentum.
✨ On the other hand, if this area holds as support, we can get the first sign of a trend change, but for now I don’t think the market is giving us any specific position because there is not a proper structure for a long and at the same time there isn’t enough bearish momentum for a short position either.
❌ Disclaimer ❌
Trading futures is highly risky and dangerous. If you're not an expert, these triggers may not be suitable for you. You should first learn risk and capital management. You can also use the educational content from this channel.
Finally, these triggers reflect my personal opinions on price action, and the market may move completely against this analysis. So, do your own research before opening any position.
Gold Price Outlook Demand Zone Reversal PotentialThis XAUUSD (Gold vs USD) 30-minute chart shows a recent bearish move after multiple change-of-character (CHoCH) signals, pushing price back toward the highlighted blue demand zone. The projection suggests a potential bounce from this demand area, with buyers expected to step in and drive price upward toward the red supply zone above. If the demand holds, the bullish move could target levels around 3,760–3,780, aligning with the marked liquidity and fair value gap (FVG) zones.

Gold (XAU/USD) Short-Term Bullish OutlookThis gold (XAU/USD) 30-minute chart shows a recent price recovery after a bearish move, with support forming around the 3,722 zone. A change of character (CHOCH) suggests a potential bullish shift, supported by the rejection from the demand zone. The projection indicates a possible pullback before price continuation toward the 3,770 supply area, aligning with the weak high above. Overall, the chart signals short-term bullish momentum unless support breaks.

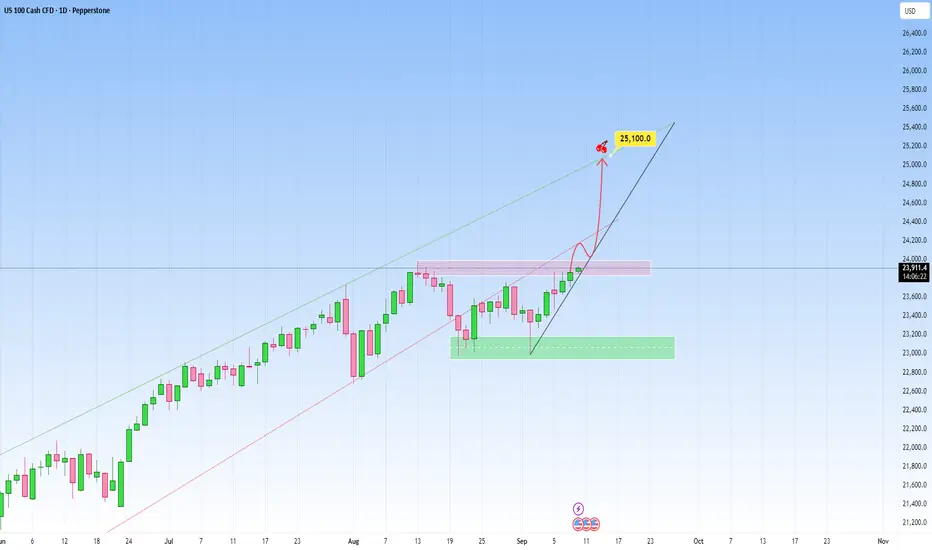
NAS100 Outlook: Recent rise has been steady!Market context on NAS100 remains bullish clearly. The most recent move saw a steady recovery, heading towards the upper boundary of the newly projected channel. And this right here is another great opportunity to get involved.
The market is likely in the early stages of a new impulsive leg to the upside right here.
We could also have short-term consolidation or pullback, then a continuation toward the upper boundary but I believe the latter is more plausible.
My target will be at 25,100.
TradeCityPro | Bitcoin Daily Analysis #179👋 Welcome to TradeCity Pro!
Let’s move on to Bitcoin analysis. After a few days, it’s time to resume our updates.
⌛️ 4-Hour Timeframe
After breaking the 116,960 zone, Bitcoin failed to hold above it and the upward move turned out to be a fake breakout.
⚡️ Following that, a corrective move began. After consolidating below 114,819, the price continued its correction down to 111,524.
✔️ So far, the reaction to this level has been positive, with several green candles forming off this support.
🔑 However, the key point is that volume hasn’t increased, which is not a good sign for buyers.
🔍 If 111,524 breaks, the downtrend could extend toward the main support floor below.
💥 On the other hand, if price manages to create higher highs and higher lows above 111,524 and volume starts to pick up, a confirmed close above 114,819 could offer a long entry setup.
📈 A breakout of 116,960 will remain the primary long trigger. A clean break above that level will confirm the start of a new bullish leg.
❌ Disclaimer ❌
Trading futures is highly risky and dangerous. If you're not an expert, these triggers may not be suitable for you. You should first learn risk and capital management. You can also use the educational content from this channel.
Finally, these triggers reflect my personal opinions on price action, and the market may move completely against this analysis. So, do your own research before opening any position.

Gold Maintains Bullish Momentum with Upside PotentialGold is currently trading around \$3,783 after maintaining a strong bullish momentum. The chart shows a clear upward trend with price creating higher highs, and a fair value gap (FVG) zone marked as a potential retracement area for buyers to re-enter. As long as price holds above this support, the outlook remains bullish, with expectations of continuation toward higher levels.
