ETHUSDT in Strong Uptrend: What's Next?Hey everyone, what do you think about ETHUSDT?
ETHUSDT is currently moving in a strong upward channel, hovering around 4427 USD, with a 1.85% increase on the day. This rally is driven by strong institutional inflows, favorable monetary policies, and the continuous development of the Ethereum ecosystem. Technical indicators such as the EMA 34 and EMA 89 continue to support the uptrend, especially as ETH breaks through short-term resistance levels.
With the current momentum, ETH could aim for a target of 5400 USD in the near future, if the buying pressure remains steady. If you're watching ETH, this is an ideal time to consider potential trading opportunities.
What do you think about ETHUSDT? Is this upward trend sustainable? Feel free to share your thoughts and join the discussion on ETH's potential moving forward!
Dailyanalysis

Gold Bulls in Full ControlHi everyone, it’s Ken here!
XAUUSD is maintaining a strong uptrend, and based on my observation, the market is likely to continue moving toward the channel top marked on the chart.
The current zone plays a crucial role. It could act as a support level that allows price to bounce higher. However, if this zone breaks, a deeper corrective move may start to unfold.
While I lean toward the bullish scenario, actual price action will ultimately determine the next direction. A decisive break below the trendline would invalidate the bullish outlook and open the risk of a pause or even a short-term reversal.
This is only my personal view based on chart analysis, not financial advice.
Wishing you success!

Gold 1H – Buy the Dip, Watch 3,687 Premium SupplyGold on the 1H timeframe is trading above 3,650 after a clean break of structure. Price has left demand footprints around 3,636 and deeper at 3,594, while resistance stands near 3,670 and premium supply sits at 3,687–3,689. This suggests a possible engineered retracement into discount zones before a push toward liquidity at 3,688+.
________________________________________
📌 Key Structure & Liquidity Zones (1H):
• 🔼 Buy Zone 3,636 – 3,634 (SL 3,630): Fresh demand block, aligned with bullish order flow.
• 🔼 Buy Zone 3,594 – 3,592 (SL 3,587): Deeper discount demand, strong structural base.
• 🔽 Sell Zone 3,687 – 3,689 (SL 3,694): Premium supply zone, potential liquidity sweep.
________________________________________
📊 Trading Ideas (Scenario-Based):
🔺 Buy Setup – Demand Block Reaction
• Entry: 3,636 – 3,634
• Stop Loss: 3,630
• Take Profits:
• TP1: 3,650
• TP2: 3,665
• TP3: 3,680+
👉 Expect retracement into discount demand before resuming bullish move.
🔺 Buy Setup – Deeper Demand Test
• Entry: 3,594 – 3,592
• Stop Loss: 3,587
• Take Profits:
• TP1: 3,610
• TP2: 3,625
• TP3: 3,640+
👉 Ideal for swing buyers looking for higher R:R at deeper liquidity sweep.
🔻 Sell Setup – Premium Rejection
• Entry: 3,687 – 3,689
• Stop Loss: 3,694
• Take Profits:
• TP1: 3,670
• TP2: 3,655
• TP3: 3,640
👉 Short-term liquidity grab at premium levels before rotating lower.
________________________________________
🔑 Strategy Note
Bias remains bullish, but smart money may engineer a sweep into 3,636 or even 3,594 demand before expansion. Cleaner setups are buying dips; sells at 3,687 are only scalp plays with tight risk.

Market Tests Strong Support – Target 0.7984OANDA:USDCHF The market has dropped significantly recently and is now testing a strong support level, which I’ve been watching for a while. This support level seems to be causing some interesting price movements. As the price stabilizes in this area, I’m starting to think about the opportunities it might offer. This could be a good time to enter, using both candlestick patterns and volume behavior to guide the decision.
Target 0.79840
What do you think? Feel free to share your thoughts in the comments! Joining the TradingView community can help improve your trading skills.
This isn’t financial advice, just sharing my thoughts on the chart. Trade safely

TradeCityPro | Bitcoin Daily Analysis #173👋 Welcome to TradeCity Pro!
Let’s dive into Bitcoin analysis. Today and tomorrow are very important days, and it’s crucial to have the right outlook on Bitcoin. We’ve got some interesting triggers for opening positions that could potentially hit our trading targets for the next few weeks.
⌛️ 4-Hour Timeframe
Bitcoin has been moving upward along a trendline and is now sitting inside a resistance zone. How price reacts to this level is key—it could determine Bitcoin’s next major move.
🔍 If the resistance breaks, an upward rally could begin, as volume has been increasing strongly and the RSI is sitting just below 64.92. That’s an important resistance level, and breaking it could bring fresh momentum into the market.
💥 Rising momentum and strong buying volume are always good signs of a powerful uptrend, and as long as these two factors align with price action, the trend should continue.
⚡️ So, if you already have open positions, you might want to take profits if the price rejects from support and RSI plus volume show divergence with the price move.
✨ If you’re looking to open a new position, the breakout of 113,237 is currently the best trigger for a long entry, provided no divergence appears.
🔽 On the other hand, if price rejects this zone and breaks below the trendline, a short setup could form. However, keep in mind that in the current market, where higher cycles remain bullish, all short positions are risky. Personally, I don’t take shorts in this environment and prefer to stay aligned with the broader uptrend.
📰 Finally, tomorrow we have the U.S. inflation report—one of the most important releases of the month, and it will have a big impact on the market. Be extra careful with your positions, because sharp volatility is highly likely once the data comes out.
❌ Disclaimer ❌
Trading futures is highly risky and dangerous. If you're not an expert, these triggers may not be suitable for you. You should first learn risk and capital management. You can also use the educational content from this channel.
Finally, these triggers reflect my personal opinions on price action, and the market may move completely against this analysis. So, do your own research before opening any position.

XAUUSD: Consolidating the bullish momentumHi everyone, it’s Ken!
At this moment, gold is shining with strong appeal. The market is moving within a steep channel, and price action continues to respect its structure, forming higher highs without showing weakness.
Not long ago, gold broke a key resistance level and might come back to retest it. Interestingly, this area also aligns with the “golden zone” from the last breakout. If buyers defend it well, the bullish outlook remains valid, with the next target aiming toward 3,660 – the channel’s peak.
As long as price stays above the support and the rising trendline, the uptrend remains intact. However, if it slips below, chances of a deeper pullback will rise.
Stay patient, wait for confirmation before entering, and always protect your capital with proper risk management.
Wishing you success!

TradeCityPro | Bitcoin Daily Analysis #172👋 Welcome to TradersCity Pro!
Let’s move on to Bitcoin analysis. Yesterday, one of the triggers we had for a long position was activated. Let’s see which direction the market moves today and what other triggers we have.
⌛️ 1-hour timeframe
The trigger we had yesterday at the 111654 zone was activated, and good buying volume entered the market. The price is now moving toward the 113233 level.
✔️ If you opened a position with yesterday’s trigger, you can secure your profits when the price reaches 113233. A breakout of 113233 itself can also be the next trigger for another long position.
📊 If the volume does not decrease and continues to rise, the likelihood of this upward move continuing is much higher, and a new leg in higher cycles could form.
✨ However, if this upward move turns out to be fake and the price stabilizes below 111654, the probability of short triggers being activated and the start of a bearish wave increases significantly.
🎲 In that case, with a break of the 110473 zone, we can open a short position. These setups are among the trades that are better to open with a small stop-loss and low risk, so they can reach the target more quickly, and if stopped out, we won’t face a big loss.
❌ Disclaimer ❌
Trading futures is highly risky and dangerous. If you're not an expert, these triggers may not be suitable for you. You should first learn risk and capital management. You can also use the educational content from this channel.
Finally, these triggers reflect my personal opinions on price action, and the market may move completely against this analysis. So, do your own research before opening any position.

Gold 1H – Smart Money Plays Below 3,600Gold on the 1H timeframe is consolidating near 3,600 after sweeping short-term liquidity. Price is currently building imbalance around intraday highs, while demand sits lower at 3,565. This structure suggests engineered moves to trap both buyers and sellers before the next expansion.
________________________________________
📌 Key Structure & Liquidity Zones (1H):
• 🔼 Buy Zone 3,565 – 3,563 (SL 3,560): Discount demand block, aligned with bullish order flow.
• 📍 Scalp Sell Zone 3,594 – 3,596 (SL 3,601): Intraday rejection pocket; scalp opportunity.
• 🔽 Sell Zone 3,630 – 3,628 (SL 3,637): Premium supply zone, ideal for liquidity sweep reaction.
________________________________________
📊 Trading Ideas (Scenario-Based):
🔺 Buy Setup – Demand Block Reaction
• Entry: 3,565 – 3,563
• Stop Loss: 3,560
• Take Profits:
o TP1: 3,585
o TP2: 3,595
o TP3: 3,600+
👉 Expect liquidity sweep into discount demand before resuming bullish trend.
🔻 Sell Scalp Setup – Intraday Reaction
• Entry: 3,594 – 3,596
• Stop Loss: 3,601
• Take Profits:
o TP1: 3,592
o TP2: 3,590
o TP3: 3,585 → 3580 → 3570 → 3560
👉 Short-term liquidity pocket; scalp only with strict risk control.
🔻 Sell Setup – Premium Rejection
• Entry: 3,630 – 3,628
• Stop Loss: 3,637
• Take Profits:
o TP1: 3,610
o TP2: 3,600
o TP3: 3,590
👉 Targeting liquidity resting below intraday lows; best for quick shorts.
________________________________________
🔑 Strategy Note
Overall bias remains bullish, but smart money may engineer a sweep of 3,626 supply before driving price back into 3,565 demand. Cleaner setup is to buy dips, while sell scalps remain short-lived opportunities.

TradeCityPro | Bitcoin Daily Analysis #171👋 Welcome to TradersCity Pro!
Let’s move on to Bitcoin analysis. Yesterday, Bitcoin continued ranging. Let’s see what triggers the market gives us today.
⌛️ 1-hour timeframe
Yesterday, after Bitcoin’s volume dropped to the lowest possible level, the market made a downward move and faked around the 110473 zone, and now it’s back inside the box again.
📊 The top of the box is at the 111654 zone, and if it breaks, the price can move toward the 113233 zone.
✔️ I still believe volume is very important, and as long as no significant volume comes in, the market won’t move. Even if it does, like yesterday’s drop, the chance of it being fake is very low.
📉 For a short position, we can enter with the 110473 trigger, but in my opinion, considering the higher cycles, it’s still not logical to open shorts. However, if buying volume enters, we can enter a long position with the long triggers we have.
🔔 In market conditions like this, when the volume is so low, one thing that really helps avoid unnecessary stop-losses is to avoid opening positions for a while and miss the first leg of the next price move.
⚡️ In this case, it’s true that we miss one leg that could have given us a risk-to-reward opportunity, but on the other hand, it prevents us from getting stopped out inside the ranging box. It also keeps our mind free from open trades so we can open new positions in the next legs, which are more reliable and have a higher win rate.
❌ Disclaimer ❌
Trading futures is highly risky and dangerous. If you're not an expert, these triggers may not be suitable for you. You should first learn risk and capital management. You can also use the educational content from this channel.
Finally, these triggers reflect my personal opinions on price action, and the market may move completely against this analysis. So, do your own research before opening any position.

TradeCityPro | Bitcoin Daily Analysis #170👋 Welcome to TradeCity Pro!
Let’s dive into Bitcoin analysis. Yesterday, the U.S. unemployment rate was released. Let’s see how it impacted the market and what the conditions look like for the future.
⏳ 1-Hour Timeframe
Yesterday, after the U.S. unemployment rate report came out positive for the market, the price made an upward move and reached the 113233 resistance.
⚡️ But after hitting this level, it faced a heavy rejection and with a red candle, the price dropped back down to the 110561 support and is still ranging around this area.
✔️ After the daily candle closed, market volume dropped significantly and remains very low, which is why candle volatility has also decreased a lot.
📊 This low volume is natural because it comes after a sharp, high-volume move in the market, and also because it is the weekend—volume typically declines on Saturdays and Sundays.
⭐ It’s likely that today and tomorrow the volume will stay this low and price could continue ranging until then, with the next real move happening once the new weekly candle opens.
💥 Step by step, we are also approaching Jerome Powell’s speech and the U.S. interest rate decision on September 17, which will make the market even more indecisive as we get closer to that date.
❌ Disclaimer ❌
Trading futures is highly risky and dangerous. If you're not an expert, these triggers may not be suitable for you. You should first learn risk and capital management. You can also use the educational content from this channel.
Finally, these triggers reflect my personal opinions on price action, and the market may move completely against this analysis. So, do your own research before opening any position.

Gold 05/09: Ready to Scalp the Drop or Buy the Dip?🟢 Market Context
Gold is currently showing a short-term bearish setup after a ChoCH (Change of Character) near 3,536.556. The market is rejecting supply and forming liquidity sweeps around the 3,531–3,533 zone. Expecting price to pull lower toward demand areas before the next bullish leg.
________________________________________
📍 Key Levels & Trade Plan
🔴 Intraday Sell (Scalp Opportunity)
• Entry: 3,531 – 3,533
• Stop Loss: 3,535
• Target: 3,485
🟢 Swing Buy Zones
1. Buy Zone 1: 3,475 – 3,477
o Stop Loss: 3,470
o Target: 3,508 – 3,526
2. Buy Zone 2 (Deeper Discount): 3,441 – 3,443
o Stop Loss: 3,435
o Target: 3,500+
________________________________________
⚖️ SMC Bias
• Short-term: Bearish scalp from supply zone.
• Mid-term: Looking for liquidity grab and bullish reversal at demand zones.
• Long-term: Maintaining bullish order flow as long as deeper demand (3,441) holds.
TradeCityPro | Bitcoin Daily Analysis #169👋 Welcome to TradeCity Pro!
Let’s move on to analyzing Bitcoin. It has had a very important reaction to the resistance zone we had, and we need to see which direction its next move will be. So stay with me as we review it.
⏳ 4-Hour Timeframe
After breaking its descending trendline, Bitcoin made a short upward move and reached the resistance zone.
🔍 However, once it touched this zone, the price was rejected and corrected down to 109577. This correction can extend further as a pullback to the trendline or even to the 107467 zone.
💥 If this deeper correction occurs and selling volume increases at the same time, the probability of breaking 107467 rises. This would not be favorable for Bitcoin’s bullish trend, and it would be better for this zone not to be lost.
📊 In case 107467 breaks with higher volume, we can open a short position. This would be considered a very risky trade, and I would personally put very little risk into it.
📈 On the other hand, if an upward move resumes and the resistance zone breaks, the price could begin a new bullish move toward higher resistances such as 117048, 119096, or even 122545.
📰 Tomorrow, the U.S. unemployment rate report will be released, which can significantly affect the market. The probability of a new wave beginning after this news is high, so make sure you’re on alert to have an open position if the market decides to move.

Gold 04/09 – Smart Money Setup: Sell Scalp, Prep for Buy Zones🟢 Market Context
Gold is currently showing a short-term bearish setup after a ChoCH (Change of Character) near 3,536.556. The market is rejecting supply and forming liquidity sweeps around the 3,531–3,533 zone. Expecting price to pull lower toward demand areas before the next bullish leg.
________________________________________
📍 Key Levels & Trade Plan
🔴 Intraday Sell (Scalp Opportunity)
• Entry: 3,531 – 3,533
• Stop Loss: 3,535
• Target: 3,485
🟢 Swing Buy Zones
1. Buy Zone 1: 3,475 – 3,477
o Stop Loss: 3,470
o Target: 3,508 – 3,526
2. Buy Zone 2 (Deeper Discount): 3,441 – 3,443
o Stop Loss: 3,435
o Target: 3,500+
________________________________________
⚖️ SMC Bias
• Short-term: Bearish scalp from supply zone.
• Mid-term: Looking for liquidity grab and bullish reversal at demand zones.
• Long-term: Maintaining bullish order flow as long as deeper demand (3,441) holds.

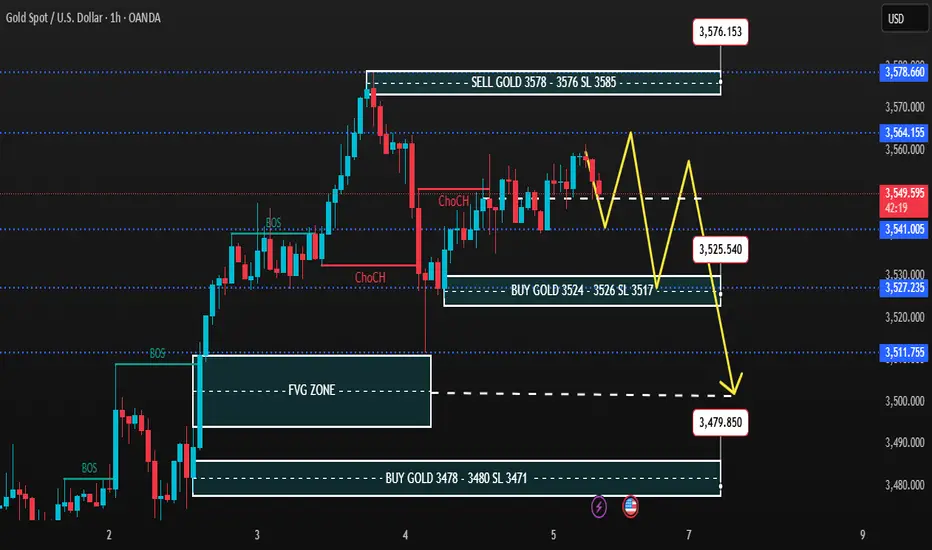
Gold 03/09 – Smart Money Playbook: Buy the Dip, Sell the High🟢 Market Context
Gold maintains a bullish order flow after multiple BOS (Break of Structure) and ChoCH (Change of Character) confirmations. Price is currently consolidating near the 3,533–3,540 zone, with a clear FVG (Fair Value Gap) below. The market shows potential for liquidity sweep before another leg upward.
________________________________________
📍 Key Levels
• Resistance (Sell Zones): 3564 | 3575–3576 | 3586 | 3595
• Support (Buy Zones): 3528 | 3508 | 3494 | 3480–3478 | 3468
________________________________________
🛠️ Trade Ideas
✅ Buy Zone (Intraday Swing)
• Entry: 3480 – 3478
• SL: 3473
• TP: 3485 – 3490 – 3500 – 3515 – 3520 – 3530
📌 Expectation: Price to mitigate FVG and react from demand zone before continuation upward.
✅ Buy Scalp (Quick Reaction)
• Entry: 3501 – 3503
• SL: 3491
• TP: 3510 – 3525 – 3545 – 3550
📌 Expectation: Short-term liquidity grab above 3500 psychological level leading to bullish push.
❌ Sell Zone (Countertrend Play)
• Entry: 3575 – 3573
• SL: 3582
• TP: 3565 – 3555 – 3545 – 3530 – 3520
📌 Expectation: Strong supply zone where smart money may hunt liquidity before reversal.
________________________________________
🔑 SMC Insights
• BOS confirms bullish bias, but price may retrace to fill imbalance (FVG).
• Liquidity likely resting around 3480–3500 before a push to test 3575+.
• High probability of buying dips at demand and selling extreme supply zones.

TradeCityPro | Bitcoin Daily Analysis #168👋 Welcome to TradeCity Pro!
Let’s move on to the Bitcoin analysis. Yesterday Bitcoin made an upward move and has now reached an important zone. Let’s see how the market wants to react to this resistance.
⏳ 1-Hour Timeframe
Yesterday Bitcoin briefly faked a breakout of its trendline but then broke it again and also activated its trigger.
🔍 Currently, the price has reached the resistance zone and is trying to penetrate it. The volume has increased throughout this upward move, which shows the strength of the buyers.
📊 If you opened a position with the triggers we had, now is not a bad time to take some profit and secure your position. But definitely leave a portion of it open so that in case the zone breaks, you won’t be left without a position.
🔔 Even with the breakout of this zone, a new long position can be opened. This zone has a lot of sell orders, and if the price manages to push through them, it can begin a sharp upward move.
💥 The RSI oscillator is stabilizing above the 64.09 level, which is a very good sign for buyers and increases the probability of breaking the zone.
✔️ However, if this RSI level fakes out, the chance of rejection from the zone rises, and in that case, the price correction can continue down to the 110721 and 109577 levels.
❌ Disclaimer ❌
Trading futures is highly risky and dangerous. If you're not an expert, these triggers may not be suitable for you. You should first learn risk and capital management. You can also use the educational content from this channel.
Finally, these triggers reflect my personal opinions on price action, and the market may move completely against this analysis. So, do your own research before opening any position.

TradeCityPro | Bitcoin Daily Analysis #167👋 Welcome to TradeCity Pro!
Let’s go for Bitcoin analysis, Bitcoin has finally broken out of the box it was in. Let’s see what positions it can give us today.
⏳ 1-Hour Timeframe
Yesterday Bitcoin broke the 109577 level and the trendline that it had in the higher timeframes, and now it has reached the resistance of 110721.
⭐ We have not yet received confirmation of the trendline breakout because no volume has entered the market, and the price has not made higher highs and higher lows, so it can still be said that the trendline is not yet broken.
📊 If volume starts to increase and the 110721 ceiling is broken, we get confirmation of the breakout of this trendline. If RSI also breaks the 64.09 level, we can take momentum confirmation from it.
💥 With the breakout of 110721, a long position can be opened on Bitcoin. If Bitcoin dominance continues its upward movement, this position can be very attractive, but if dominance starts to drop, altcoins will be a much better option.
🔽 For a short position, a fakeout of this upward movement and price stabilizing below the 109577 level would be a good trigger for a fakeout, and in the lower timeframes, we can open a short position with price stabilizing below 109577.
❌ Disclaimer ❌
Trading futures is highly risky and dangerous. If you're not an expert, these triggers may not be suitable for you. You should first learn risk and capital management. You can also use the educational content from this channel.
Finally, these triggers reflect my personal opinions on price action, and the market may move completely against this analysis. So, do your own research before opening any position.

GBPCAD: Pushing onto clear ResistanceWhat we’re looking at on GBPCAD is price getting close to a clear resistance, just the kind I love trading. That is because when there are strong upmoves like this one meeting with proper zones, it's when it can take a break and inverse short term.
If price gives us a confirmation as exhaustion or in candle structure and volume behavior, I have my eyes set on the target near 1.8500.
That’s achievable and where the move likely might exhaust and that’s where I’m out, before the reversal can bite.
If the structure continues, I’ll stay out. But until then, I will watch for the clues we get here.

TradeCityPro | Bitcoin Daily Analysis #166👋 Welcome to TradeCity Pro!
Today a new weekly candle has opened, so let’s analyze Bitcoin and review the trading conditions for the new week.
⏳ 1-Hour Timeframe
Bitcoin has formed a ranging box in the 1-hour timeframe, and with the start of the new week and month, the candle volumes have increased significantly.
✔️ The trendline we drew yesterday on the 4-hour timeframe can also have an impact here in the 1-hour chart, and if the price reaches it, a reaction is very likely.
✨ If the price reacts to the trendline and gets rejected, the downward move can continue. The trigger we currently have for a short position is the break of 107467.
⚡️ But if the trendline is broken, we can open a long position with the activation of the trendline trigger, which is the break of 109577. In this case, Bitcoin could start a bullish move that may continue towards resistance areas.
🧩 Yesterday was the last day of the month, and today is the first day of the new month. Many companies and funds are forced to open or close their positions due to accounting strategies. This has caused some unusual volatility.
🔍 Keep this in mind: I recommend not opening any major positions today. If you do, manage them with proper risk control until the market returns to normal conditions.
❌ Disclaimer ❌
Trading futures is highly risky and dangerous. If you're not an expert, these triggers may not be suitable for you. You should first learn risk and capital management. You can also use the educational content from this channel.
Finally, these triggers reflect my personal opinions on price action, and the market may move completely against this analysis. So, do your own research before opening any position.

Gold 01/09: FVG Retracement – Buy the Dip, Short 3515SMC Analysis for 01/09
Gold continues to maintain a bullish order flow after clear BOS and ChoCH confirmations. Price has created an FVG (Fair Value Gap) around 3463 and is currently moving toward the 3515 supply zone.
✅ BUY Scenarios
• Buy Zone 1: 3418 – 3422
o Demand zone aligned with trendline + liquidity sweep.
o SL 3410
o TP: 3430 – 3445 – 3455 – 3460+.
• Buy Scalp Zone: 3352 – 3350
o Deep liquidity grab area for quick scalp.
o SL 3344
o TP: 3360 – 3380 – 3400.
👉 All buy zones follow the dominant bullish structure. The best strategy is to wait for retracements to enter long.
❌ SELL Scenario
• Sell Zone: 3515 – 3517
o H1 supply zone overlapping resistance.
o SL 3522
o TP: 3500 – 3485 – 3475 – 3465 – 3450.
👉 Short trades are only for quick pullbacks. Larger bias remains bullish unless a strong bearish ChoCH develops.
________________________________________
📌 Conclusion:
• Main bias: Buy the dip at 3415–3422, 3442–3447, and scalp at 3352–3350.
• Secondary play: Sell 3515–3520 back to demand.
• Keep an eye on FVG 3463 as the key reaction level.

Will Gold Back Again To 3400 ?Market Context
• Price has shown multiple bullish break of structure, confirming short-term bullish order flow.
• A supply zone around 3449 – 3451 may provide liquidity for a reaction.
• The fair value gap between 3360 – 3310 remains unfilled and could attract price.
________________________________________
Key Levels
• Supply Zone: 3449 – 3451
• Buy Zone 1: 3396 – 3400 (SL 3390)
• Buy Zone 2: 3310 – 3315 (SL 3303)
• FVG Zone: 3360 – 3310
________________________________________
Trading Scenarios
Primary Buy Setup
• Entry: 3396 – 3400
• Stop Loss: 3390
• Target: 3449 – 3460 liquidity sweep
Secondary Buy Setup
• Entry: 3310 – 3315
• Stop Loss: 3303
• Target: 3396 – 3449
Counter-trend Sell
• Entry: 3449 – 3451 if rejection occurs
• Stop Loss: above 3458
• Target: 3400 demand
________________________________________
Summary
The main bias remains bullish with two buy zones identified: 3400 for a shallow entry and 3310 for a deeper liquidity sweep. Short positions at supply should only be considered as counter-trend scalps.

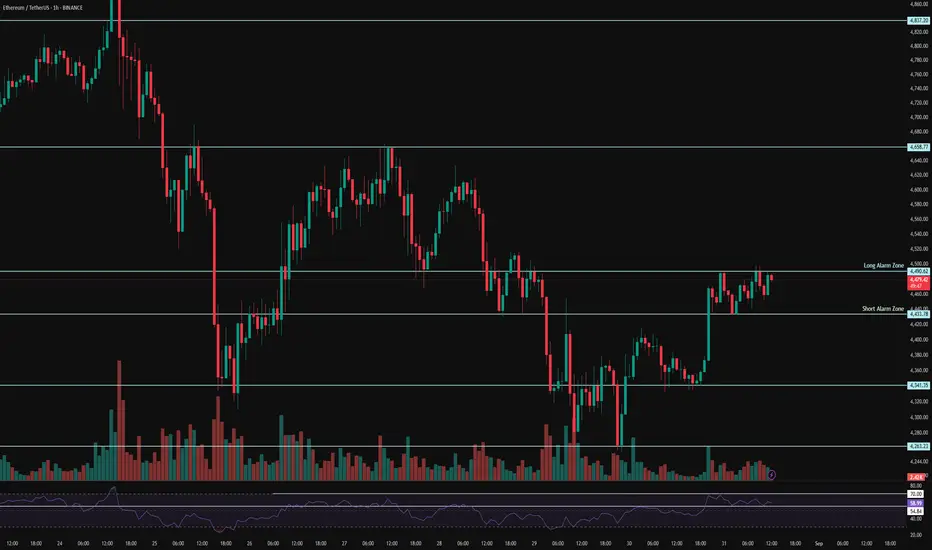
ETH 1H Analysis – Key Triggers Ahead | Day 8💀 Hey , how's it going ? Come over here — Satoshi got something for you !
⏰ We’re analyzing ETH on the 4-hour timeframe timeframe .
🔭 On the 1-hour timeframe of Ethereum, we can see that after a correction, Ethereum was supported at the $4263 area and moved upward. It had a resistance at the $4341 level which, after breaking and completing a pullback, pushed towards its next higher resistance. Currently, it is in a 1-hour or 15-minute multi-timeframe range, and with a breakout from this pattern, it can give us a trade opportunity.
⛏ Key RSI levels are at 70 and 55. If the fluctuation limit crosses these numbers, Ethereum can have significant volatility and start a new trend.
💰 The volume and number of green candles have increased, and their size also looks bigger. This can be a sign of Ethereum’s bias, showing that buyers are more willing to spend money compared to sellers. The volume and number of red candles have decreased, and they don’t create much selling pressure, although the market is currently in a holiday period.
🪙🪙 On the 1-hour ETHBTC timeframe, after breaking out of its box, Ethereum moved upward and also had a pullback to this box. Now there is resistance at the 0.04145 area, and with a breakout of this level, Ethereum can continue moving upward.
🔔 The alert zones considered for Ethereum are $4433, which is at the bottom of this range as the short alert zone, and $4490, which is at the top of this range as the long alert zone. With a breakout and confirmation above these levels, Ethereum can start its move in the new week. Note that this pattern has strong price action significance, and Ethereum’s monthly candle will also close tonight.
❤️ Disclaimer : This analysis is purely based on my personal opinion and I only trade if the stated triggers are activated .
TradeCityPro | Bitcoin Daily Analysis #165👋 Welcome to TradeCity Pro!
Let’s dive into Bitcoin analysis. Over the past few days, I unfortunately couldn’t provide updates, but starting today I’ll try to bring you daily analyses again.
⌛️ 4-Hour Timeframe
Bitcoin is still continuing its downward trend and has managed to consolidate below the supply zone we had marked.
📊 At the moment, a descending trendline has formed, and the price has reacted to it multiple times.
⭐ I currently don’t have any open positions on Bitcoin and won’t be opening new ones yet. For new entries, I’m waiting until my triggers are activated.
📈 For a long position, with a break of the trendline and activation of the 110183 trigger we can enter. But the main position will be after consolidation above the 113000 zone.
🔽 For a short position, with a break of 107853 the price could make another downward leg. The next support would be 105370.
✔️ There’s a strong chance Bitcoin will continue this corrective move, possibly until the next interest rate announcement. But we still need to watch the market daily, so that once triggers activate, we can open positions accordingly.
❌ Disclaimer ❌
Trading futures is highly risky and dangerous. If you're not an expert, these triggers may not be suitable for you. You should first learn risk and capital management. You can also use the educational content from this channel.
Finally, these triggers reflect my personal opinions on price action, and the market may move completely against this analysis. So, do your own research before opening any position.

Gold 29/08: Smart Money Targets 3444 or Sweeps 3395Market Context (SMC View):
• Gold rejected from 3423 liquidity zone and is retracing into discount.
• Demand sits at 3397–3395, which could provide a bounce if tapped.
• Premium supply zones above 3422 and 3442 remain attractive for shorts.
________________________________________
🔼 BUY SCENARIO
• Buy Zone: 3397 – 3395
• SL: 3389
• TP: 3405 → 3415 → 3425
________________________________________
🔽 SELL SCENARIO 1 (Price Action)
• Sell Zone: 3422 – 3424
• SL: 3430
• TP: 3412 → 3400
________________________________________
🔽 SELL SCENARIO 2 (Swing)
• Sell Zone: 3442 – 3444
• SL: 3452
• TP: 3425 → 3412 → 3400
________________________________________
📌 Conclusion & Notes
• Bias: Buy on dips at 3397–3395, then look for liquidity grab around 3422–3424 or extended sweep into 3442–3444 for short entries.
• 3422–3424 is the first intraday supply zone, while 3442–3444 is the major swing sell zone.
• Patience: wait for rejection/confirmation candles before selling.
• Protect capital: keep SL tight, as gold tends to hunt liquidity around round numbers.
