Gold 27/08: Smart Money Targets 3405 or Sweeps 3355?Gold SMC Daily Plan – 27/08
Market Context (SMC View):
• Price consolidates around 3378, respecting the liquidity trendline with multiple BOS and ChoCH, showing smart money activity.
• Key resistance: 3393–3406 (supply & liquidity pool).
• Key support: 3352–3358 (demand zone) with OB near 3325.
• Expect a liquidity sweep either above 3405 or below 3355 before trend confirmation.
________________________________________
📊 Key Liquidity Zones & Entries
✅ Sell Zone: 3402–3406
o SL: 3410
o TP: 3390 → 3380 → 3360
✅ Buy Zone 1: 3352–3358
o SL: 3345
o TP: 3360 → 3375 → 3385 → 3395
✅ Buy Zone 2 (intraday pullback): 3376–3380
o SL: 3370
o TP: 3385 → 3395 → 3405
________________________________________
SMC Scenarios for 27/08
Scenario 1 – Liquidity Grab at Resistance:
• If price sweeps 3402–3406, watch for fake breakout signs.
o Short from zone with TP as above.
Scenario 2 – Buy on Dip (Demand Zone):
• If price retraces deeper to 3352–3358, wait for bullish reaction to buy.
• If price respects trend and holds 3376–3380, look for intraday longs.
________________________________________
SMC Notes:
• Focus on buying dips unless liquidity grab happens first at 3402–3406.
• Watch price action near trendline & OB at 3325 for high-probability reversals.
Dailyanalysis

Smart Money Playbook: Where Will Gold Hunt Liquidity Next?Gold SMC Daily Plan – 26/08
Market Context (SMC perspective):
Price is consolidating near 3375 after an impulsive bullish move. There’s uncollected liquidity above 3385–3400, an FVG around 3354, and a deep buy zone at 3323–3327. Structure remains bullish unless 3327 is broken.
________________________________________
Key SMC Zones
• Liquidity Pool: 3385–3400 (potential sweep before reversal)
• FVG: 3354 region – watch for reaction
• Buy Zone: 3323–3327 (SL 3320)
• BOS/ChoCH: Upside confirmed above 3354; bearish shift if 3327 breaks
________________________________________
Trading Scenarios (SMC Logic)
1) BUY SCALP – Quick Liquidity Grab
• Entry: 3350–3352 (FVG support)
• SL: 3343
• TP: 3355 → 3360 → 3375 → 3385 → 3400+
Reason: Mitigation of FVG + bullish BOS continuation.
________________________________________
2) BUY ZONE – Swing Setup
• Entry: 3339–3336 (deep OB)
• SL: 3334
• TP: 3340 → 3350 → 3360 → 3365 → 3370 → 3380 → 3390 → 3400+
Reason: Possible liquidity sweep below 3340 before upside continuation.
________________________________________
3) SELL SCALP – Quick Reversal
• Entry: 3380–3383 (above intra-day liquidity)
• SL: 3385
• TP: 3378 → 3374 → 3370 → 3365 → 3360 → 3350
Reason: Sweep of local highs → BOS to downside.
________________________________________
4) SELL ZONE – High-Risk Liquidity Sweep
• Entry: 3400–3402
• SL: 3406
• TP: 3395 → 3390 → 3385 → 3380 → 3370 → 3360
Reason: Hunt major liquidity above 3400, then reversal.
________________________________________
SMC Flow for Today:
• Look for buy confirmations around FVG 3354 or deep buy zone 3327.
• If price sweeps 3385–3400 first, watch for sell setups with BOS confirmation.
• Structure bias flips bearish only if price closes below 3327.

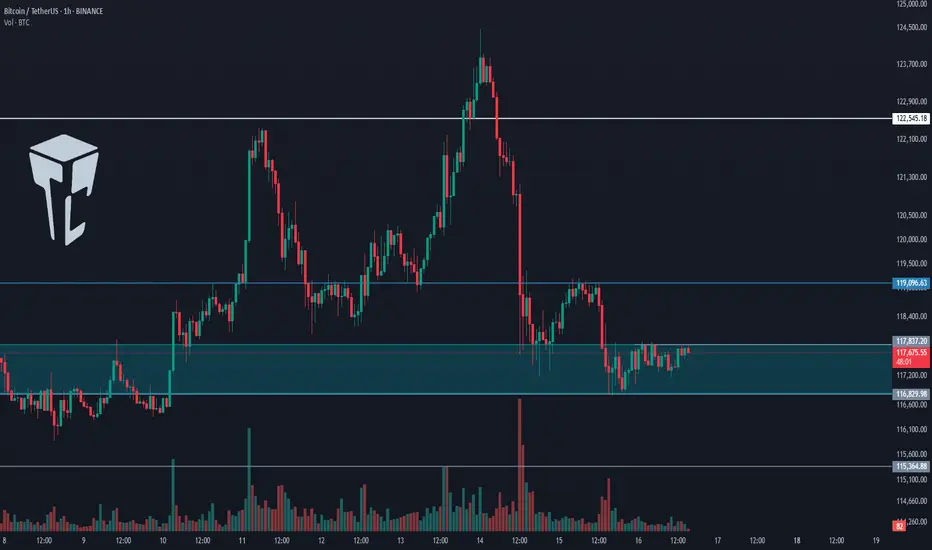
TradeCityPro | Bitcoin Daily Analysis #164👋 Welcome to TradeCity Pro!
Let’s analyze Bitcoin today. I want to take a different approach by analyzing Bitcoin with volume to get a fresh perspective on it.
⏳ 1-Hour Timeframe
Bitcoin is still continuing its bearish move and has reached an important support level at 109509.
📊 If we use the FRVP indicator, we have identified 3 key resistance zones that I have plotted for you. In case Bitcoin is supported at the 109509 zone and starts a bullish move, the price could react to these resistance levels.
✨ After the price was rejected from the 110000 range, the volume decreased, indicating a weakness in the bearish trend. If the volume doesn’t increase, the bearish movement won’t continue.
⚡️ However, if the selling volume increases and 109509 is broken, the price could move down to the next support at 107853.
💥 The RSI oscillator is still showing a bearish momentum and is range-bound between 30 and 50. A break of 30 and entering the Oversell zone will initiate Bitcoin’s main bearish movement, and the price could move towards lower levels.
❌ Disclaimer ❌
Trading futures is highly risky and dangerous. If you're not an expert, these triggers may not be suitable for you. You should first learn risk and capital management. You can also use the educational content from this channel.
Finally, these triggers reflect my personal opinions on price action, and the market may move completely against this analysis. So, do your own research before opening any position.

TradeCityPro | Bitcoin Daily Analysis #163👋 Welcome to TradeCity Pro!
Let’s analyze Bitcoin. Yesterday, Bitcoin made a bearish move. Let’s explore the reason behind it and what Bitcoin’s next move might be.
⏳ 4-Hour Timeframe
Yesterday, during the New York session, a large number of Bitcoin were sold by one of the whales, which caused Bitcoin to make a large red 4-hour candle with high volume.
✨ This candle caused the price to make a long shadow below the range, and afterward, the price started to gradually decline. With the break of 112233, the price is now heading towards the 110183 support.
🔔 The 110183 zone is a very important support, and the price’s reaction to this zone will significantly impact the future market trend.
🧩 Bitcoin’s dominance trend is still bearish, and if this continues, altcoins could provide excellent long positions as long as Bitcoin doesn’t experience a sharp decline.
✔️ However, Bitcoin itself is still experiencing a lot of selling pressure, and the volume is still increasing. If this increase in volume continues, the price could reach at least the 110183 support.
💥 The RSI oscillator has reached near the 30 zone again. A break of this zone and entering Oversell would increase the likelihood of further bearish movement.
⚡️ For now, I’m not opening any positions and I’m waiting for the right structure to form before entering a trade.
❌ Disclaimer ❌
Trading futures is highly risky and dangerous. If you're not an expert, these triggers may not be suitable for you. You should first learn risk and capital management. You can also use the educational content from this channel.
Finally, these triggers reflect my personal opinions on price action, and the market may move completely against this analysis. So, do your own research before opening any position.c

TradeCityPro | Bitcoin Daily Analysis #162👋 Welcome to TradeCity Pro!
Let’s analyze Bitcoin. Since yesterday, Bitcoin hasn’t made any significant moves, so today I’ll analyze it for you on the 1-hour timeframe.
⏳ 1-Hour Timeframe
Since yesterday, Bitcoin has been sitting on a support level around 114612 and has touched this zone twice in the 1-hour chart.
📊 The volume has dropped significantly, which makes sense because it’s the weekend, and traders are waiting to see where the market will move in the coming week.
✔️ In my opinion, given Powell’s speech was positive for the market, the probability of Bitcoin turning bullish is higher, and with long position triggers being activated, the chance of profit increases.
⚡️ If the 115497 zone is broken, we can open a risky long position. I recommend keeping an eye on Bitcoin dominance while this trigger is being activated — if it’s still in a downtrend, then it’s better to open the position on altcoins.
✨ On the other hand, if the price moves downward, we can open a short position by breaking 114612. Personally, I still don’t think shorting is logical, and until I get confirmation of a trend reversal in higher cycles, I won’t open short positions.
🔽 But if you want to short, it should be for a short-term trade down to the 112233 support zone.
❌ Disclaimer ❌
Trading futures is highly risky and dangerous. If you're not an expert, these triggers may not be suitable for you. You should first learn risk and capital management. You can also use the educational content from this channel.
Finally, these triggers reflect my personal opinions on price action, and the market may move completely against this analysis. So, do your own research before opening any position.

XAUUSD Daily AnalysisWe expect correction to highlighted support levels.
based on ichimoku 3166.5 is an important one.
after reaction to these levels, analysis will be updated.

TradeCityPro | Bitcoin Daily Analysis #161👋 Welcome to TradeCity Pro!
Let’s move on to Bitcoin’s analysis. Today, after yesterday’s upward movement, Bitcoin has entered a correction. Let’s see what triggers we have for trading today.
⏳ 4-Hour Timeframe
After yesterday’s bullish move that came following Powell’s speech, I mentioned that since the movement was news-based and also close to the weekend, the probability of a correction was high.
⚡️ That’s exactly what happened. Bitcoin itself did not continue upward today and was rejected from the 116829 resistance level. However, Bitcoin dominance remains in a downtrend, which has allowed some altcoins paired with Bitcoin to continue moving upward.
🔍 If Bitcoin dominance continues to decline while Bitcoin ranges or trends upward, altcoins can provide very good positions and it’s better to focus on them.
🧩 But if dominance begins to correct and forms green candles, we can shift our focus back to Bitcoin and open long positions.
🚀 In this case, the current trigger for a Bitcoin long position is the breakout of 116829. Breaking this trigger could push the price toward 122545.
💥 If the RSI bounces from the 50 level and moves upward, we can take it as momentum confirmation for this position. Additionally, if volume increases while the price approaches the 116829 resistance, we can use a candlestick setup to enter, or place a stop-buy order above the resistance.
❌ Disclaimer ❌
Trading futures is highly risky and dangerous. If you're not an expert, these triggers may not be suitable for you. You should first learn risk and capital management. You can also use the educational content from this channel.
Finally, these triggers reflect my personal opinions on price action, and the market may move completely against this analysis. So, do your own research before opening any position.

TradeCityPro | Bitcoin Daily Analysis #160👋 Welcome to TradeCity Pro!
Let’s move on to analyzing Bitcoin. Today, Powell gave a speech that had a big impact on the market. Let’s see what the market will do next.
⏳ 4-Hour Timeframe
Today, Jerome Powell delivered his speech at the Jackson Hole event and spoke about U.S. Federal Reserve policies.
🔔 His comments were in favor of the crypto market, raising expectations for an interest rate cut, and this caused Bitcoin to move upward.
🔍 As you can see, the current 4-hour candle is a very large green candle, and the price was supported by the zone we had marked.
📊 The buying volume that entered Bitcoin is very high, and the probability that the price ranges after this candle is high.
⚡️ Considering that we are close to the weekend, this ranging could continue until the weekly candle closes.
🚀 However, at the same time as this bullish candle in Bitcoin, its dominance dropped and declined. For this reason, altcoins like Ethereum moved upward even more strongly than Bitcoin.
📈 If the upward movement continues, we can use a candle setup or RSI entering the Overbuy zone as a long trigger.
❌ Disclaimer ❌
Trading futures is highly risky and dangerous. If you're not an expert, these triggers may not be suitable for you. You should first learn risk and capital management. You can also use the educational content from this channel.
Finally, these triggers reflect my personal opinions on price action, and the market may move completely against this analysis. So, do your own research before opening any position.

TradeCityPro | Bitcoin Daily Analysis #159👋 Welcome to TradeCity Pro!
Let’s dive into the Bitcoin analysis. Today, Bitcoin is sitting right on a very important support level. Let’s see what could happen in the market.
⏳ 4-Hour Timeframe
Today, I removed the old range we had on Bitcoin and added a support zone around 112000.
✔️ The reason for removing the old range was that the price had broken through it several times, both from above and below, so it could no longer be considered a Maker Buyer or Maker Seller zone.
🔔 The new zone I drew is a very strong support, and right now the price is fluctuating inside it.
✨ The 114790 trigger is a good entry signal for a long position, confirming that the price has been supported by the Maker Buyer zone. The important resistance levels above are at 116829 and 119096.
💥 If the 112233 level breaks, a sharp bearish leg could occur. But in my view, it is unlikely to happen today. If it does, it will probably come after Powell’s speech tomorrow.
🧩 Breaking the 30 level on RSI is still the momentum trigger for Bitcoin. If it enters the oversold zone, Bitcoin’s momentum will turn bearish, and the RSI could move down toward 24.60.
🔍 For today and tomorrow, I prefer not to open any new positions and wait until Powell’s speech at the Jackson Hole event to see when the market chooses its direction.
❌ Disclaimer ❌
Trading futures is highly risky and dangerous. If you're not an expert, these triggers may not be suitable for you. You should first learn risk and capital management. You can also use the educational content from this channel.
Finally, these triggers reflect my personal opinions on price action, and the market may move completely against this analysis. So, do your own research before opening any position.

TradeCityPro | Bitcoin Daily Analysis #158👋 Welcome to TradeCity Pro!
Let’s get into Bitcoin analysis. Yesterday, Bitcoin’s decline continued, and now, after finding support at its key support zone, it is showing an attractive entry point for opening a position.
⏳ 4-Hour Timeframe
Yesterday, Bitcoin made another bearish leg and dropped close to the 112233 zone.
✔️ The recently closed 4-hour candle shows market indecision since it came with high volume and left large wicks on both sides, signaling a battle between buyers and sellers.
💥 The RSI oscillator still hasn’t dropped below the 30 zone and was supported there. Breaking this level would trigger another bearish leg toward 110000.
📊 If 112233 breaks, we can open a short position. It’s not a bad trigger, and the break of this zone would be the first sign of a trend change.
⚡️ However, I personally am still waiting for confirmation of the main trend and won’t open any position yet. For shorts, I think it’s still too early, and for longs, the structure hasn’t formed properly.
🔍 If today Bitcoin makes a bullish leg and climbs above 114790, then tomorrow we can consider opening a long position. But for now, no suitable trigger has been formed yet.
❌ Disclaimer ❌
Trading futures is highly risky and dangerous. If you're not an expert, these triggers may not be suitable for you. You should first learn risk and capital management. You can also use the educational content from this channel.
Finally, these triggers reflect my personal opinions on price action, and the market may move completely against this analysis. So, do your own research before opening any position.

TradeCityPro | Bitcoin Daily Analysis #157👋 Welcome to TradeCity Pro!
Let’s move on to the Bitcoin analysis. Bitcoin is still in correction mode and moving toward the 110000 zone. Let’s see how the market looks today.
⏳ 4-Hour Timeframe
Yesterday, Bitcoin made a pullback to the 116829 zone and is now ready to continue its decline.
💥 First, let’s check the RSI. This oscillator is very close to the 30 zone, and if this zone breaks, market momentum can turn bearish.
📉 The next support for this oscillator is 24.60. Based on the chart’s history, the probability of RSI being supported at this zone is high, but the distance between this zone and 30 can also trigger a sharp drop.
✔️ The price zone that Bitcoin could reach if RSI moves downward is 112233. The trigger for this bearish move was 114790, which is already being broken with this 4-hour candle. Let’s switch to the 1-Hour timeframe to see more details.
⏳ 1-Hour Timeframe
As you can see in this timeframe, after the pullback to 116829, a trigger formed at 114790, and the price is now breaking this zone.
📊 Given that RSI was rejected from the 50 zone, the price set a lower high compared to 116829, and the selling volume in the current candle increased, the probability of a move toward 112233 has increased significantly.
⭐ For a short position, we can enter with the break of this zone. As usual, I won’t open any position as long as Bitcoin is above 110000, and I recommend you don’t open shorts for now either.
📈 For a long position, the first trigger we have is the break of 116289. In case the break of 114790 turns out to be fake, we can also open a long position by confirming a V-Pattern.
❌ Disclaimer ❌
Trading futures is highly risky and dangerous. If you're not an expert, these triggers may not be suitable for you. You should first learn risk and capital management. You can also use the educational content from this channel.
Finally, these triggers reflect my personal opinions on price action, and the market may move completely against this analysis. So, do your own research before opening any position.

EURNZD: High probability reversal, to not missI am expecting a reversal on EURNZD, with a downside target at around 1.9300.
This area is where it can become a decision point, either price bounces, or it breaks above and the move can start to extend higher.
My expectation is for the price to reverse.

TradeCityPro | Bitcoin Daily Analysis #156👋 Welcome to TradeCity Pro!
Let’s go for the Bitcoin analysis. The weekly candle finally closed, and the market’s first move was bearish. Let’s see what’s going on today and what positions can be opened.
⏳ 4-Hour Timeframe
Yesterday Bitcoin made a DCB move and then broke the support zone it had formed.
🔔 Currently, Bitcoin has made a bearish leg and is now around the 115,318 zone. The selling volume that entered Bitcoin has been very high, and if this volume continues to increase, the probability of a move toward 112,233 will be higher.
✔️ If you remember, in previous analyses I told you that if the new weekly candle of Bitcoin opened green, the price could continue moving upward this week and the next bullish leg could start. On the other hand, if the candle opened red, then Bitcoin would probably range the whole week and the market wouldn’t show crazy volatility.
🔽 The bearish scenario happened yesterday, and in my opinion, the market will enter a deeper correction this week. However, I still think as long as the price is above 110,000, the trend remains bullish and the probability of continuation is higher than the trend being over.
🔍 For now, I’m not opening any new positions because the market structure is not very interesting, and based on my strategy, it doesn’t provide attractive setups. That’s why I’m focusing on my other tasks like journaling and managing my previous positions, while keeping an eye on the market in case conditions improve.
❌ Disclaimer ❌
Trading futures is highly risky and dangerous. If you're not an expert, these triggers may not be suitable for you. You should first learn risk and capital management. You can also use the educational content from this channel.
Finally, these triggers reflect my personal opinions on price action, and the market may move completely against this analysis. So, do your own research before opening any position.

TradeCityPro | Bitcoin Daily Analysis #155👋 Welcome to TradeCity Pro!
Let’s move on to Bitcoin analysis. Bitcoin is still ranging with low volume. Let’s see what could happen to Bitcoin in the coming week.
⏳ 1-Hour Timeframe
Yesterday, Bitcoin rose from its support zone and, by breaking 117837, it managed to hold above this level.
📊 The volume is still very low and will probably remain so until the new weekly candle opens. But if the volume increases, with the break of the 119096 zone we can open a long position.
📈 For long positions, my preference is still on altcoins because Bitcoin dominance is falling and the money flowing into altcoins is more than into Bitcoin.
✔️ If 119096 is broken and dominance continues to fall, altcoins can once again have an upward move and I will open a new position on altcoins.
🔔 On the other hand, if with the start of the new weekly candle the price holds below 116829, it is very likely the market will go into correction and range for the whole week. But if its initial move is bullish and it breaks the 119096 high, a new bullish leg for the market can begin.
❌ Disclaimer ❌
Trading futures is highly risky and dangerous. If you're not an expert, these triggers may not be suitable for you. You should first learn risk and capital management. You can also use the educational content from this channel.
Finally, these triggers reflect my personal opinions on price action, and the market may move completely against this analysis. So, do your own research before opening any position.

TradeCityPro | Bitcoin Daily Analysis #154👋 Welcome to TradeCity Pro!
Let’s move on to Bitcoin analysis — today I’ll cover the 1-Hour timeframe since Bitcoin is ranging and there isn’t much signal on higher timeframes.
⏳ 1-Hour Timeframe
Currently, Bitcoin is sitting inside its support zone and hasn’t given a confirmed breakdown below this level yet.
📊 However, due to the lack of strong buyers and continuously decreasing volume, it looks like there’s still a chance for deeper corrections.
✔️ Of course, since it’s the weekend, lower volume can be expected. At the start of next week, we’ll need to see which direction price decides to move first.
🥸 Right now, Bitcoin has formed a box structure within the support zone. I believe the breakout of this box will be very important.
If the box breaks to the upside, Bitcoin could head back toward the 122545 resistance level.
If it breaks to the downside, the probability of another move toward 110000 will increase.
🔔 For now, I won’t be opening any new positions until the weekend is over. I’ll wait to see how the market reacts next week. Naturally, I won’t be giving any triggers for new positions until then.
❌ Disclaimer ❌
Trading futures is highly risky and dangerous. If you're not an expert, these triggers may not be suitable for you. You should first learn risk and capital management. You can also use the educational content from this channel.
Finally, these triggers reflect my personal opinions on price action, and the market may move completely against this analysis. So, do your own research before opening any position.
TradeCityPro | Bitcoin Daily Analysis #153👋 Welcome to TradeCity Pro!
Let’s move on to Bitcoin analysis — yesterday we saw Bitcoin’s reaction to the news, and now we’ll see what it plans to do today.
⏳ 4-Hour Timeframe
Yesterday, the 117,000 support level held, and Bitcoin managed to bounce from this area, preventing further decline.
✔️ As I mentioned before, if the price doesn’t close below this level, the overall trend remains bullish. As long as we stay above this zone, I’ll be looking for long triggers in the market, not shorts.
💥 Yesterday, with the news release, Bitcoin dominance saw an upward correction, but the overall trend remains bearish. If that continues, we can keep focusing more on altcoins.
🔔 Currently, there’s no trigger for opening a Bitcoin position, and personally, I’m not very eager to trade it now, because dominance is dropping, and as long as Bitcoin isn’t bearish, altcoins can keep moving up.
✨ Considering the sharp decline in volume in today’s candles, I think the chances are high that Bitcoin will range until the start of next week. If dominance continues its correction, the market won’t be giving us many trade setups over the next few days.
🔍 For now, it’s better to wait until our strategy’s structure and triggers form again, and then, once they’re activated, we can open our positions.
❌ Disclaimer ❌
Trading futures is highly risky and dangerous. If you're not an expert, these triggers may not be suitable for you. You should first learn risk and capital management. You can also use the educational content from this channel.
Finally, these triggers reflect my personal opinions on price action, and the market may move completely against this analysis. So, do your own research before opening any position.

TradeCityPro | Bitcoin Daily Analysis #152👋 Welcome to TradeCity Pro!
Let’s get into the Bitcoin analysis. Unfortunately, I couldn’t post the analysis yesterday, but starting today, it will once again be posted daily as part of our regular routine so you can benefit from it.
⏳ 1-Hour Time Frame
Yesterday, on the 1-Hour chart, Bitcoin made a strong upward move and set a new all-time high at the 124474 zone.
💥 However, today the US Producer Price Index (PPI) was released, showing an unusual figure of 0.9%. This news is very negative for Bitcoin because it means the Federal Reserve may not be able to lower interest rates, which is bearish for Bitcoin.
⭐ This negative news caused Bitcoin, after the fake breakout of the 122733 zone, to drop, and the price has now fallen back to the 117000 zone. The momentum of this drop has been quite strong.
⚡️ If the 117000 zone breaks, the probability of a decline toward the 110000 zone will increase significantly because a very important resistance has been faked out, which has weakened buyer strength considerably.
🔍 In my opinion, the likelihood of this happening is low because this large candle we see was triggered by news, and the effects of news are more important in the long term rather than immediately at the time of release. However, the news that was released is fundamentally negative for Bitcoin in the long run and could even be the starting point of a bearish trend for Bitcoin.
✔️ So, from a fundamental perspective, it’s better to wait for Powell’s September session.
📊 But if the 117000 zone holds as support, we can consider opening long positions when suitable triggers are activated because the trend is still bullish, and the price could retest the previous high again.
❌ Disclaimer ❌
Trading futures is highly risky and dangerous. If you're not an expert, these triggers may not be suitable for you. You should first learn risk and capital management. You can also use the educational content from this channel.
Finally, these triggers reflect my personal opinions on price action, and the market may move completely against this analysis. So, do your own research before opening any position.

TradeCityPro | Bitcoin Daily Analysis #151👋 Welcome to TradeCity Pro!
Let’s dive into today’s Bitcoin analysis. Earlier today, the highly anticipated U.S. inflation data was released — let’s see how it has impacted Bitcoin.
⌛️ 4-Hour Timeframe
Bitcoin continued its correction yesterday, and remained in a corrective phase until today’s U.S. inflation news hit the market.
✔️ The news came out in Bitcoin’s favor, and we are now seeing a bullish engulfing candle on the 4-hour chart with solid volume. If this candle can close with a slightly larger body, it would be a strong signal for a potential continuation of the uptrend.
📊 As long as the price holds above the 116,829 level, I consider Bitcoin’s trend in LWC to be bullish. On the MWC, we are still ranging, and on the HWC, Bitcoin remains bullish.
🔔 Currently, there’s a resistance level at 120,041, which was previously faked out from above. We need to wait for the next tests to identify the precise resistance line.
✨ If this resistance at 120,041 breaks, a long position could be considered. The main trigger for confirming an MWC uptrend would be a breakout above 122,733. However, I recommend aiming to enter on the 120,041 breakout instead, as waiting for 122,733 might be too late — the move would likely be sharp, with no ideal entry candle.
🔽 On the other hand, if the current candle turns into a wick and closes red, Bitcoin could enter a deeper correction toward the 116,829 and 115,364 zones.
💥 If RSI closes below 50, that would give a momentum-based confirmation of bearish conditions, increasing the likelihood of a corrective scenario as selling momentum builds in the market.
❌ Disclaimer ❌
Trading futures is highly risky and dangerous. If you're not an expert, these triggers may not be suitable for you. You should first learn risk and capital management. You can also use the educational content from this channel.
Finally, these triggers reflect my personal opinions on price action, and the market may move completely against this analysis. So, do your own research before opening any position.

AUDUSD – DAILY FORECAST Q3 | W33 | D12 | Y25 Daily Forecast 📊 AUDUSD – DAILY FORECAST
Q3 | W33 | D12 | Y25
Daily Forecast 🔍📅
Here’s a short diagnosis of the current chart setup 🧠📈
Higher time frame order blocks have been identified — these are our patient points of interest 🎯🧭.
It’s crucial to wait for a confirmed break of structure 🧱✅ before forming a directional bias.
This keeps us disciplined and aligned with what price action is truly telling us.
📈 Risk Management Protocols
🔑 Core principles:
Max 1% risk per trade
Only execute at pre-identified levels
Use alerts, not emotion
Stick to your RR plan — minimum 1:2
🧠 You’re not paid for how many trades you take, you’re paid for how well you manage risk.
🧠 Weekly FRGNT Insight
"Trade what the market gives, not what your ego wants."
Stay mechanical. Stay focused. Let the probabilities work.
FX:AUDUSD

EURCHF – DAILY FORECAST Q3 | W33 | D12 | Y25 📊 EURCHF – DAILY FORECAST
Q3 | W33 | D12 | Y25
Daily Forecast 🔍📅
📌 NOTE – Market Context Update
We’ve seen the daily candle close above the weekly 50 EMA, which suggests bullish intent... BUT 🧠⚠️
Let’s stay mindful — price is currently testing a major higher time frame level, and with 4 trading days left in the week, there’s still room for a rejection from the weekly 50 EMA.
🔍 Be smart with longs — don’t get caught chasing. Personally, I’ll be waiting for a 15-min BOS from my initial level to confirm intent. 🎯
📉 If price breaks back below the weekly 50 EMA, I’ll switch bias to shorts — then wait for a pullback to structure for continuation down.
Let the market show its hand. Stay sharp and trade what you see, not what you want to see. 🧘♂️📊
Here’s a short diagnosis of the current chart setup 🧠📈
Higher time frame order blocks have been identified — these are our patient points of interest 🎯🧭.
It’s crucial to wait for a confirmed break of structure 🧱✅ before forming a directional bias.
This keeps us disciplined and aligned with what price action is truly telling us.
📈 Risk Management Protocols
🔑 Core principles:
Max 1% risk per trade
Only execute at pre-identified levels
Use alerts, not emotion
Stick to your RR plan — minimum 1:2
🧠 You’re not paid for how many trades you take, you’re paid for how well you manage risk.
🧠 Weekly FRGNT Insight
"Trade what the market gives, not what your ego wants."
Stay mechanical. Stay focused. Let the probabilities work.
OANDA:EURCHF

TradeCityPro | Bitcoin Daily Analysis #150👋 Welcome to the 150th Bitcoin Analysis on TradingView by TradeCity Pro!
I am very happy that the number of daily Bitcoin analyses has reached 150. I hope the analyses have been useful so far and that you have been able to benefit from them. On this occasion, I want to present a complete and comprehensive analysis of Bitcoin.
📅 Weekly Timeframe
On the weekly timeframe, Bitcoin has been in a very strong uptrend since early 2023. After breaking the 24512 resistance, it made several sharp moves and, in multiple bullish waves, managed to register a new ATH in the 120000 zone.
✨ At the moment, it can be said that Bitcoin is in the seventh wave of its trend, which is quite a high number. The more waves a trend has and the more it shows signs of weakness, the higher the probability of a trend reversal.
📊 Regarding volume, there is not much to say because over time, Bitcoin’s trading volume on Binance has decreased. The reason is partly due to Binance exiting certain countries, and partly due to the growth of the DeFi space, where a significant percentage of trading now happens on DEXs, naturally reducing CEX volume.
⭐ However, if we compare the magnitude, slope, and candlestick size of the bullish waves, the trend weakness is clearly visible. But this does not mean the trend will reverse.
🧩 Many trends, even after showing weakness, continue for several more waves. If this happens for Bitcoin on the weekly timeframe, we can still take many long positions in futures during those waves.
💥 Therefore, this trend weakness is not a solid reason to avoid opening long positions for now. I still believe long positions in futures take priority over short positions.
🛒 For spot, if you have already bought Bitcoin, I suggest you keep holding for now. We can take profit after confirming the trend, but for now, it is better to hold.
🎲 However, for spot buying at current prices, I do not recommend it because it is not worth it. It is better to open futures positions to get a more reasonable profit.
🔔 Now that the 110000 resistance has been broken, the next targets are 128000 and 162000. If RSI enters the Overbought zone, these targets will be within reach.
📅 Daily Timeframe
In the last analysis I shared for this timeframe, the price was in a correction phase, and I mentioned that as long as the price is above 110183, the trend is bullish, and the probability of upward movement is higher than a drop.
🔑 That’s exactly what happened — the price formed a higher low above 110183, and RSI bounced from near the 38.21 support level and moved upward.
🔍 We had a Maker Seller zone between 120000 and 122000, and now the price has penetrated into it.
🔼 It seems to be getting rejected from the top of this zone and today failed to break it. Now we need to see what happens during the New York session.
✔️ In my opinion, it is unlikely that the price will break this top today. The market will probably wait for the U.S. inflation data release tomorrow before deciding on the next move.
📊 If inflation comes in higher than expected, the market will re-enter a correction phase, likely dropping back toward 110183.
📈 If inflation is lower than expected, Bitcoin can break the 122000 resistance and start a new bullish leg.
⏳ 4-Hour Timeframe
On this timeframe, Bitcoin finally broke through the Maker Seller zone it had formed, with a strong bullish candle. After RSI entered the Overbought zone, a Blow Off candle was printed near the 122733 resistance.
☘️ Currently, given the recent red candles, it appears that RSI’s entry into Overbought was a fake-out, and the price has pulled back to 120041.
⚡️ There is a possibility that the price could resume its upward movement from here, as the 120041 zone is an important level that can prevent further declines. In this scenario, the price would also have completed a pullback to the SMA7.
💥 If a deeper correction occurs, the next dynamic support is the SMA25, which is also an important momentum support.
📉 The lower static support levels for Bitcoin are currently 116829 and 115364.
❌ Disclaimer ❌
Trading futures is highly risky and dangerous. If you're not an expert, these triggers may not be suitable for you. You should first learn risk and capital management. You can also use the educational content from this channel.
Finally, these triggers reflect my personal opinions on price action, and the market may move completely against this analysis. So, do your own research before opening any position.

EURUSDMy Bias: cautiously bearish unless reclaimed.
Context: Price broke the daily structure (“day break”), retraced into a fair value gap and reacted.
Plan: I’ll wait for a clean LTF break of structure and displacement from that FVG before taking shorts on a pullback into fresh imbalance. If the FVG is reclaimed and we close back above it, I will reassess the bias. Be patient until next week’s session opens. NFA.

TradeCityPro | Bitcoin Daily Analysis #149👋 Welcome to TradeCity Pro!
Let’s move on to Bitcoin’s analysis. Today, Bitcoin has once again moved toward a certain range, and we need to see whether it can break this zone this time or not.
⏳ 4-Hour Timeframe
On the 4-hour timeframe, Bitcoin has once again moved toward the 117000 zone today, faced a rejection candle from this level, and now it seems to be heading for a correction.
✔️ Considering tomorrow is also a holiday, the likelihood of ranging and correcting is much higher than continuing the trend, because for the uptrend to continue, the price needs volume inflow — and today and tomorrow, significant volume is unlikely to enter Bitcoin. That’s why the probability of correction and ranging is higher.
📊 If, during the correction, the price can hold above 115364, then with the start of the new week, the probability of a new bullish wave increases significantly. In that case, we can open a long position upon breaking the 117000 zone.
✨ However, if the price breaks below 115364, the correction could extend down to 112233. This still won’t change the overall trend, but it would fake the entire move made during the week — which is not a good sign for the bullish trend.
🔍 As long as the price remains above 112233, I am still only looking for long triggers and will not open any shorts for now.
❌ Disclaimer ❌
Trading futures is highly risky and dangerous. If you're not an expert, these triggers may not be suitable for you. You should first learn risk and capital management. You can also use the educational content from this channel.
Finally, these triggers reflect my personal opinions on price action, and the market may move completely against this analysis. So, do your own research before opening any position.
