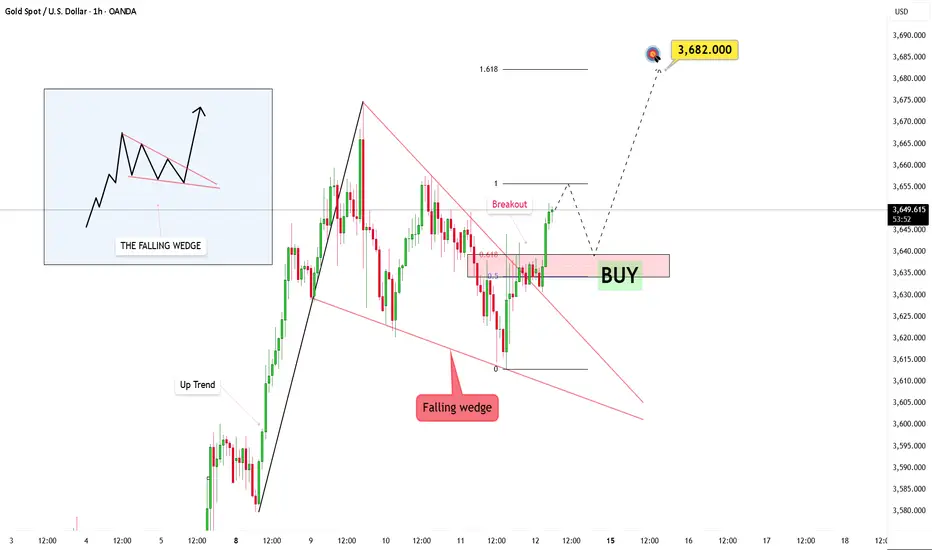
Gold Analysis: Falling Wedge Breakout and Bullish ForecastOANDA:XAUUSD The market is clearly forming a falling wedge, and recent price action suggests a potential shift is on the horizon. Price has begun breaking through this downward structure, which could be the early signs of a strong bullish move.
I’m waiting for the price to retrace back to the broken trendline. This will act as a confirmation, filtering out any false moves, while a retest of the structure will solidify the validity of the breakout. From here, my target is 3682.
The key now is to watch the pullback. If the market returns to the trendline with rising volume, it will add weight to the bullish case.
This trendline breakout is more than just a signal – it’s a story in the making. It represents a shift, and with the right volume, structure, and timing, this could be the start of a larger bullish phase.
Dalychart
Updated XRPUSD chart to more precisely show the breakout pointI decided to post an updated version of my current xrpusd daily chart to more accurately display the measured move line at the spot of the exact breakout so we can see it work its magnetism on price action and so far you can see here we had a perfect wick support bounce up from the dotted measured over line like clockwork. Let’s see if it climbs up the lne like it often does with other pattern breakouts. Target for this specific breakout is $4.86. II will post a link to the previous version of this chart below. I tired that one something along the lines of the 50ma is about to push price action out of the nest and force it to fly and as you can see that’s more or less exactly what it did. *not financial advice*

Digibyte looks like it’s validating the invh&s breakoutDigibyte shown here on the daily chart showing a nice bullish impulse firmly above the neckline of its inverse head and shoulders pattern. Already well on the way to the breakout target here so very likely validating the breakout. Also doing so a day or so before it has its golden cross. Once it reaches the full breakout target it’s likely to test the next potential resistance of the yellow horizontal trendline. That trendline is actually the neckline of a larger double bottom pattern. Wouldn’t be surprised with the golden cross so close by that whatever resistance that double bottom neckline provides doesn’t last very long *not financiala dvice*

Invh&S target on PEPE takes it slightly above its previous athPEPEUSD appears to be breaking up from its inverse head and shoulder target.

Ugly invh&s on XRPUSD already breaking above the necklineEven though this already now has a sizable candle breaching the neckline of this inv h&s pattern, we must remember that even bigger breaks above invh&snecklines in the past have still found a way to dip back below the neckline, and this candle currently has a decent top wick goin on it as XRP often likes to pull after a pump, so we haven’t validated the breakout of this pattern just yet. However, wanted to post a new updated version of this pattern to show that if we were to validate the breakout here which is a little earlier than where. Arbitrarily placed the measured move line of the breakout on the previous version of this chart, the target would then be slightly higher taking us to around 93-94 cents. Again, no guarantee we won’t find a way to dip back below the neckline here in which case I will ahve to readjust the measured mvoe line lower again but I still out of excitement wanted to post this update considering XRP has been playing it coy the ast few days that bitcoin has been pumping. *not financial advice*

Ugly invh&s on XRPUSD already breaking above the necklineEven though this already now has a sizable candle breaching the neckline of this inv h&s pattern, we must remember that even bigger breaks above invh&snecklines in the past have still found a way to dip back below the neckline, and this candle currently has a decent top wick goin on it as XRP often likes to pull after a pump, so we haven’t validated the breakout of this pattern just yet. However, wanted to post a new updated version of this pattern to show that if we were to validate the breakout here which is a little earlier than where. Arbitrarily placed the measured move line of the breakout on the previous version of this chart, the target would then be slightly higher taking us to around 93-94 cents. Again, no guarantee we won’t find a way to dip back below the neckline here in which case I will ahve to readjust the measured mvoe line lower again but I still out of excitement wanted to post this update considering XRP has been playing it coy the ast few days that bitcoin has been pumping. *not financial advice*
