Dash Signals Bullish Recovery After Deep CorrectionWe discussed Dash back on December 16, 2025, when we highlighted strong support within the wedge pattern, marking wave C of an ABC corrective structure. That area acted as a key technical floor, increasing the probability of a bullish reaction.
As we can see today, price is recovering strongly from that support, and the advance appears to be unfolding as wave (3) of a new five-wave bullish cycle within wave A/1. This type of impulsive price action typically reflects strengthening momentum and growing bullish participation. As a result, further upside is favored toward the 100 area and potentially higher levels.
That said, while the broader structure remains constructive, traders should remain mindful of a possible wave (4) pullback, which would be a normal corrective pause before another continuation higher into wave (5). As long as key support levels hold, the overall outlook remains bullish.
Dash

DASH price analysis💥 Just eight years in a downtrend — that’s the story of #DASH 😅
Following CRYPTOCAP:ZEC , it looks like privacy coin fans are trying to “wake up” #DASHUSDT — and price action is finally showing signs of life 📈
📊 If buyers can hold above $90–100, it will signal a true breakout from the long-term trendline and a solid consolidation above it.
That could open the door for a careful long entry, especially since we still have room for around x5 upside to reach the 2021 highs 💪
🤔 Do you believe #DASH can reclaim its former glory,
or has its time already passed?
______________
◆ Follow us ❤️ for daily crypto insights & updates!
🚀 Don’t miss out on important market moves
🧠 DYOR | This is not financial advice, just thinking out loud

$MONERO it was #Monero it is! One Legion - One Promise! ElliotWCRYPTOCAP:XMR is alive like never before.
Open Interest and funding rates remain healthy. Netflow is still trending outward, which strongly suggests that larger players are taking profits with the intention to re-enter at lower levels. What we are seeing right now is not weakness — it is a normal and expected corrective phase.
We are currently hunting liquidity on the long side, not breaking structure. This pullback was anticipated before the pump, as outlined in the original analysis:
Check it out! Elliot Wave 3 Prognose Monero
Elliott Wave Structure
There are two valid scenarios:
Scenario 1: Aggressive structure (1-2-1-2-1-2 at the start of Supercycle Wave 3)
In this case, Wave 4 is expected to be fast and sharp, correcting into the 0.236 – 0.5 Fibonacci zone.
We are already trading around the 0.382, which is completely healthy. Nothing abnormal here.
Scenario 2: Standard structure (1-2-3-4-5)
This would imply a longer consolidation range during Wave 4. Even in this scenario, the bias remains clearly bullish.
Regardless of how Wave 4 completes, there is no bearish signal. The fast dump is structurally normal and does not invalidate the trend.
Key Levels
Primary corrective target (Wave 4): ~ 609.91 USD
Invalidation level: 471.66 USD
Bearish scenario: Not active
After Wave 4 completes, we expect a sub-Wave 5 inside the larger Wave 3, developing over the coming days to weeks.
This cycle will not resemble previous ones. We are in Supercycle Wave 3, meaning Wave 5 should be comparable in strength to Wave 3 itself.
Targets
From the projected Wave 4 bottom around 610 USD, a +95–96% expansion is expected:
First major target: ~ 1081 USD
Psychological levels like 1000 USD are unlikely to act as strong resistance
First real resistance zone: ~ 1080 USD
From there, a gradual move toward 1200 USD
Following that, a Supercycle Wave 4 could develop and potentially extend into late 2026, before the final Wave 5 and the next macro bear cycle.
PS: On the #XMR/#BTC chart, Monero has reached the 2.618 extension after breaking all major structures. This is a very strong signal. A clean 2.618 hit is often the ideal level for continuation, especially when followed by a fast and aggressive pullback.
With multiple BOS (Breaks of Structure) confirmed on #XMR/BTC, the probability remains high that the broader uptrend will continue to expand.
This setup is not comparable to ZEC or other so-called “privacy coins.”
CRYPTOCAP:XMR stands alone structurally, fundamentally, and historically.
Monero remains the only real privacy coin.
Trust the structure. Trust the wave.
$Monero it was - #Monero it is.
Shinyflakes we hold until the end.

Dash, and it's historical Movements Good day fellow traders and investors,
Today I'm taking a deep dive into into DASH, an "OG" coin with privacy as it's utility.
Way back in 2022 in the depths of the bear market, I posted a chart stating how I was expecting or anticipating an alternating or lengthening ALT-COIN cycle. in that post I picked 6 "OG", dyno or boomer coins... Call them what you want.
XRP
LTC
XMR
BCH
DASH
DGB
These were coins , two are specifically designed as Privacy with one LTC has had an added option as a side chain through mimblewimble , the best privacy protocol hands down. Not included although fits the criteria is ZCASH . XRP & BCH was the first to show signs of this theory has some validity. Then in February of 2025 I made a post with XMR stating the upcoming privacy use case narrative and explosion that would inevitably come. As of right now XMR and DASH are showing signs of continuation and fruition of this thesis manifesting.
Concentrating on DASH and it's historic patterns, We can see a distinct pattern could be showing signs of early Bullish pattern. This is a one week chart of the entire history Dash on Kraken. Other than my markings it's a naked chart with only 2 indicators, the volume and the Gaussian channel. The key here is the Gaussian channel and the color and color change from red to green. When the Gaussian flips to green and DASH is above it this usually means it's in a bull trend. A bounce off the top of this channel is typically a confirmation, which we just received the last few weeks. Look at the respect if showed to this area and the bounce it took off of it just this week!! It exploded with a 150% move. This could only be the beginning of a 1 to 2 year uptrend with DASH that could prove to be another epic run.
Holding and staying above a GREEN Gaussian is the basic key to this move.
I have also done some math and Fibonacci calculations to a possible high 3 thousand low 4 thousand USD top, call it 4k.
Last but not least, the volume . It has had a massive spike, for me this is confluence and one more confirmation.
Please share your thoughts and comments down below.
If you like and agree with the Idea please give it a like and share. Also, follow me on my other socials and ask me how you could join my private Telegram group
Regards,
WeAreSat0shi

$DASH is consolidating inside a rising channel. As long as priceNASDAQ:DASH is consolidating inside a rising channel. As long as price holds above the 70–60 zone, this move looks like healthy consolidation rather than a top. A brief shakeout is possible, but the trend remains intact and higher levels are still in play.

#DASH/USDT – Bullish Breakout Setup | 1H Chart Analys#DASH
The price is moving in a descending channel on the 1-hour timeframe. It has reached the lower boundary and is heading towards breaking above it, with a retest of the upper boundary expected.
We have a downtrend on the RSI indicator, which has reached near the lower boundary, and an upward rebound is expected.
There is a key support zone in green at the 48 price level. The price has bounced from this zone multiple times and is expected to bounce again.
We have a trend towards consolidation above the 100-period moving average, as we are moving close to it, which supports the upward movement.
Entry price: 49.50
First target: 51.60
Second target: 54
Third target: 56.81
Don't forget a simple principle: money management.
Place your stop-loss below the support zone in green.
For any questions, please leave a comment.
Thank you.

DASHUSDT rally from support tests daily resistance Dash has shown significant growth, rising more than 75% from the daily support range of 37.30-38.65. The upward movement was accompanied by active participation from large volumes, indicating attempts by major players to defend the support and immediately exit accumulation.
The rally paused at the daily resistance zone of 65.70-69.56, where bears responded with volume to limit further upward movement. This shows that this area remains a key level for price control.
For bulls, it is now critical to break through the resistance and hold above it. Otherwise, bears could establish accumulation or even push the price back down using their volume.
Accumulation in the current situation appears more like a neutral scenario, with a balance established between the sides. However, bulls still hold the advantage, and bears will need significantly more volume to push the price lower.
Thus, Dash is caught between support and resistance, with the balance of power currently tilted toward bulls. The next move will depend on which side takes control of the key level first.

DASHUSDT : 8-Year Descending Wedge Breakout?Dash (DASH) is showing early signs of a macro trend reversal on the monthly timeframe after trading inside a descending wedge for over 105 months (~3,120 days).
Price has consistently made lower highs and lower lows since the 2017 peak, compressing within well-defined downward-sloping trendlines. This long-term structure appears to be resolving to the upside, with price reclaiming key levels and pressing into the wedge resistance.
Key Points:
- 105-month compression following the 2017 cycle top
- Well-respected descending wedge structure
- Bullish expansion from long-term support
- Historical context suggests mean reversion potential after extended underperformance
If DASH can confirm a monthly close above wedge resistance, it would signal a structural trend change and open the door for a multi-leg recovery toward higher macro levels. Long consolidations on higher timeframes often precede powerful expansion phases.
Cheers
Hexa


#DASH/USDT – Bullish Breakout Setup | 1H Chart Analys#DASH
The price is moving in a descending channel on the 1-hour timeframe. It has reached the lower boundary and is heading towards breaking above it, with a retest of the upper boundary expected.
We have a downtrend on the RSI indicator, which has reached near the lower boundary, and an upward rebound is expected.
There is a key support zone in green at 41.50. The price has bounced from this zone multiple times and is expected to bounce again.
We have a trend towards stability above the 100-period moving average, as we are moving close to it, which supports the upward movement.
Entry price: 42.50
First target: 43.52
Second target: 46.86
Third target: 46.34
Stop loss: Below the support zone in green.
Don't forget a simple thing: capital management.
For inquiries, please leave a comment.
Thank you.


Solana’s Not Done Yet — Hitting 136 Soon?🚀 Solana Update | TF 15M
Hey everyone! 👋
In my previous post, my targets were:
🎯 127.50 & 130
Before SOL reached the first target, it dipped slightly below my old cancellation zone. But that didn’t break the long picture it actually strengthened it 💪.
🔥🎯New targets:
➡️ 132
➡️ 135
➡️ 136 😎
❌New cancellation zone: 126.85
Two possible scenarios for this move:
🟢 Green arrow path
🟣 Purple arrow path
⚠️ Disclaimer: Not financial advice — just my personal view. Trade responsibly!
💖 If you like this, hit follow & react to support! Every ❤️ helps!

DASH - Falling Wedge Breakout Daily chart showing a breakout from this large falling wedge triangle
Falling Wedges are considered bullish reversal patterns
The upper line of the wedge is now seen as support rather than resistance.
Up on the Daily timeframe

#DASH/USDT – Bullish Breakout Setup | 1H Chart Analys#DASH
The price is moving in a descending channel on the 1-hour timeframe. It has reached the lower boundary and is heading towards a breakout, with a retest of the upper boundary expected.
We are seeing a bearish trend in the Relative Strength Index (RSI), which has reached near the lower boundary, and an upward bounce is expected.
There is a key support zone in green at 43.12, and the price has bounced from this level several times. Another bounce is expected.
We are seeing a trend towards stabilizing above the 100-period moving average, which we are approaching, supporting the upward trend.
Entry Price: 39.00
First Target: 40.24
Second Target: 41.56
Third Target: 43.12
Remember a simple principle: Money Management.
Place your stop-loss order below the green support zone.
For any questions, please leave a comment.
Thank you.

DASH - Dashing trade ideaDASH been epic this year, it's time to cashout those gains and trade this correction side.
We aren't too early for this trade and not too late either.
- Rejected and closed below 50DMA/200DMA
- Lower high formed
- Trend line broken
- Overhead gap filled and heading lower
- Volume vacuum zone
Short anywhere here
Target 1 - 200
Target 2 - 180
Target 3 - 140
Stop loss - 240

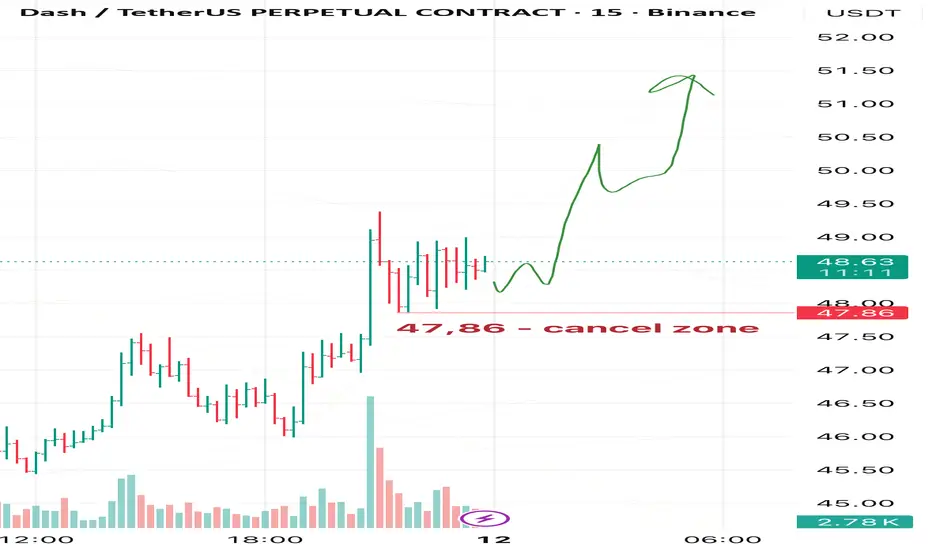
#DASHUSDT #4h (ByBit) Falling wedge breakout and retest [LONG]Digital Cash is pulling back to 50MA regained support where it seem likely to bounce towards 200MA resistance.
⚡️⚡️ #DASH/USDT ⚡️⚡️
Exchanges: ByBit USDT
Signal Type: Regular (Long)
Leverage: Isolated (2.0X)
Amount: 5.3%
Current Price:
48.22
Entry Targets:
1) 48.13
Take-Profit Targets:
1) 66.44
Stop Targets:
1) 38.97
Published By: @Zblaba
CRYPTOCAP:DASH BYBIT:DASHUSDT.P #4h #DigitalCash #Privacy dash.org
Risk/Reward= 1:2.0
Expected Profit= +76.1%
Possible Loss= -38.1%
Estimated Duration= 1-2 weeks
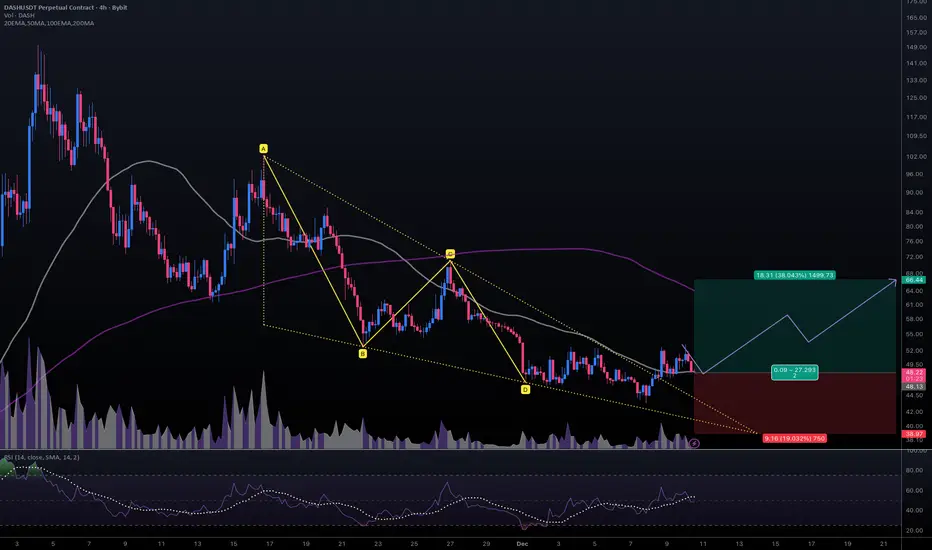
Dash Is Sitting At The Strong Support Within The Wedge PatternDash made a strong rally, as anticipated earlier, but the recent sharp decline suggests that the five-wave bullish impulse has likely been completed. As a result, price action now appears to be in a higher-degree three-wave corrective phase. This pullback fits well with a broader ABC corrective structure following the impulsive advance.
On the 4-hour chart, Dash seems to be trading within wave C of this higher-degree correction. Moreover, price action suggests that the market may be in the final stages of wave (5) within a wedge pattern. This setup often signals trend exhaustion, especially when combined with strong historical support. In this case, the 40 area stands out as a key support zone where buyers could step back in and stabilize the price.
Given this technical structure, traders should be alert for a potential rebound and the early stages of a new rally, particularly if price manages to recover and hold above the 53.50 level. However, it’s important to remain cautious, as the first meaningful bullish evidence would only be seen on a breakout above the 71 area. A decisive move above 105 would then serve as full bullish confirmation, signaling that a larger upside continuation is back in play.
Until those levels are reclaimed, price action should be monitored closely, as volatility may remain elevated near the current support zone.

DASH - YOU CAN'T FIGHT PHYSICS! CORRECTIONS ARE INEVITABLE!📣 Hello everyone!
1. DASH currently has an ideal bull market structure.
Microphases of growth are impulsive and lightning-fast: In September, in 6 days +95%, in October in 5 days + 115%, in November in 5 days +263%
The correction microphases grow proportionally over time, which is the absolute norm: 6 days, 17 days, and the current correlation can probably stretch to 21-28 days!
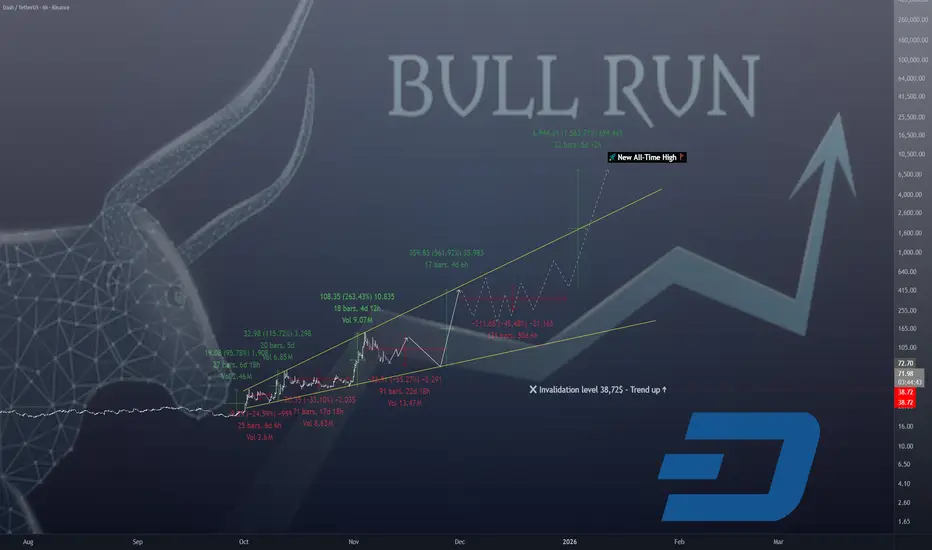
2. If the bull market structure is maintained until the end of 2025, the DASH price may test the 2021 maximum in the region of $476!!
_________________________________________
Total: while the minimum of the last consolidation of $ 38.72 has not been violated, I believe that we should remain cautiously optimistic about DASH and give the bulls time to prove themselves once again. I believe that this time we are dealing with a breakdown of the 8-year bearish trend and now is the earliest phase of the long-term bull market in this coin.
That's all for today, I wish you good luck in making independent trading decisions and profit. Please analyze the information you receive from me, always think only with your head!
Goodbye! ✊
#DASH/USDT – Bullish Breakout Setup | 1H Chart Analys#DASH
The price is moving in a descending channel on the 1-hour timeframe. It has reached the lower boundary and is heading towards a breakout, with a retest of the upper boundary expected.
We are seeing a bearish bias in the Relative Strength Index (RSI), which has reached near the lower boundary, and an upward bounce is expected.
There is a key support zone in green at 44.40, and the price has bounced from this level several times. Another bounce is expected.
We are seeing a trend towards stabilizing above the 100-period moving average, which we are approaching, supporting the upward trend.
Entry Price: 45.00
First Target: 45.68
Second Target: 46.81
Third Target: 48.30
Remember a simple principle: Money Management.
Place your stop-loss order below the green support zone.
For any questions, please leave a comment.
Thank you.

Dash: Assessing a Potential Trend ReversalThe extended downtrend in Dash appears to be losing strength, and the recent price action shows signs of a potential shift toward a bullish structure. The current upward movement may represent the early phase of a broader trend reversal — although it is equally possible that this is only a corrective advance before another leg down.
At this stage, Dash is technically positioned for continuation to the upside, but the overall structure still leaves open the question:
Has the downtrend truly ended, or will Dash revisit new lows after the expected upward move completes?
For now, I am leaning toward a short-term bullish scenario, with the following upside levels in focus:
• Target 1: 51.20
• Target 2: 53.00
• Target 3: 56.00
The invalidation level remains at 47.86 — a break below this support would indicate a failure of the emerging bullish structure and potentially open the path for a deeper continuation of the prior downtrend.
Until then, Dash maintains a constructive setup, but with important uncertainty about the long-term trend direction.
DASH/USDT Is Testing the Downtrend Wall — Major Move Incoming?DASH/USDT is approaching a critical decision point that could define its next major trend.
Price has been suppressed under a dominant descending trendline since early November, and now the market is once again testing this structure — a technical barrier that has repeatedly rejected buyers.
But there’s a key development:
Bearish momentum is weakening.
The recent series of small higher-lows and tightening volatility indicates compression — a classic precursor to a large expansion move.
The horizontal levels shown (55 – 62 – 70 – 83 – 98 – 135) aren’t just resistance lines;
they are liquidity pockets where strong reactions historically occur.
---
📈 Bullish Scenario (Potential Large Reversal)
A confirmed breakout above the descending trendline and a 4H close above $55 would signal a major shift in structure.
If the breakout is validated:
Target 1 → $62
Target 2 → $70 (key psychological zone)
Target 3 → $83
Target 4 → $98
Target 5 → $135 (full recovery zone)
A clean breakout could mark the beginning of a mid-term trend reversal after weeks of downward pressure.
---
📉 Bearish Scenario (Rejection & Continuation)
If price gets rejected again at the trendline, sellers remain firmly in control.
A strong rejection would open the door to:
Support 1 → $44
Support 2 → $41 (major local low)
Break below $41 → new lower-lows likely, extending the broader downtrend
A sharp bearish candle at the trendline typically signals aggressive selling from larger participants.
---
📌 Key Pattern
Dominant Descending Trendline → guides the entire bearish structure
Compression Price Action → volatility tightening near a major decision point
Potential Trend Reversal Pattern if price breaks above trendline
Liquidity Layering → horizontal levels mark key liquidity pools
The market is now sitting in a “Decision Zone” — a spot where the next major move is usually born.
---
🎯 Summary
DASH is at a rare technical moment:
A retest of the primary trendline that separates reversal from continuation.
Breakout → Trend shift
Rejection → Bearish continuation
This is a moment for confirmation, not prediction.
#DASH #DASHUSDT #CryptoAnalysis #TechnicalAnalysis #BreakoutSetup #TrendReversal #MarketStructure #PriceAction #LiquidityZones

DASH is possibly forming a bearish Head and Shoulders pattern🚨📊 DASH Update
DASH is possibly forming a bearish Head and Shoulders pattern ⚠️📉.
If this structure completes, it could signal further downside momentum.

DASH has broken below the blue support level📊 DASH Update
DASH has broken below the blue support level 🔵⬇,
showing sellers are taking control of the move.
This breakdown increases the chance of further downside
unless buyers quickly reclaim this zone.
