DASH USDT $ 900 in less than 3 months and more#dash #dashusdt
#Poloniex charts is older than #binance that can giving us more data .
$ 900 in less than 3 months. and then more ...
The reason I believe in big targets:
We are now in the most difficult resistance area in all pairs of dash .
Over time, the movement distance of the targets will become larger and larger.
Dash

DASH USDT everybody confused !#DASHUSDT #DASH
On the chart DASHBTC and DASHETH I see a better chance for a positive scenario.
Pessimistic even if price going to 330 area or More pessimistic 286 so soon reaction starts .


dash usdtim just waiting.
not investment advice
I attach importance to your criticism and thoughts. you can interpret

DASH/USDT - a coin with a good perspective! Possible X2,X3🔥910 days of huge accumulation. Global uptrend. I think we'll grow. But now possible a pullback. (Don't forget that BTC can change scenario all the market)
Write in the comments all your questions and instruments analysis of which you want to see.
Friends, push the like button, write a comment, and share with your mates - that would be the best THANK YOU.
P.S. I personally will open entry if the price will show it according to my strategy.
Always make your analysis before a trade


Dash Looks Ready for a RunIt broke out of the descending triangle, retested the trend line and bounced off nicely. I believe it's about ready for a run. I'm doing this from my phone so can't give more details outside of the chart. Thanks for checking it out!

DoorDash Inc 🧙DoorDash Inc provides online food delivery logistics services. The company provides on-demand food delivery services through its website. It operates primarily in the United States of America. Its Platform enables merchants to solve challenges such as customer acquisition, delivery, insights and analytics, merchandising, payment processing, and customer support.
If you want not to miss ideas like this one,🎯 subscribe and press a thumb up! 👍 Have a question? Don't be shy to ask! 🤓 Interested to study how to analyze charts, follow me!

MY NOT SO MINIMALIST CHART ANALYSIS FOR $DASH$DASH - DASH ON A DAILY CHART
5.8.21 1408H +8 PACIFIC
MY NO SO MINIMALIST ANALYSIS
ENTRY AND EXIT POINTS FOR A SWING TRADE
USING RANGE BOXES AND FIBS.
So do I go on a Ride into The Second Swing or not?
Who knows what the market will do in a few hours or so.
Am I 100% prepared? Yes. Am I 100% sure of my forecast? No. Will I have a heart attack if expectations are not met? No.
Then, I can live to fight another day? Yes. Lol!
So the answer to the first question is a big, YES!
Happy Trading and I Thank my Mentor for all the heart aches that I do not have to go through. You are a blessing!
Note:
This is not a piece of financial advice.
I am just a student and still learning.
Adjustments will be made in
accordance with The Dynamics of the
Market along with its Trading Psychology.
Postings done most of the time will be
delayed, as it takes time for me to finish
on several assets.
Updates will be posted religiously if time
permits.

MY MINIMALIST CHART ANALYSIS FOR $DASH$DASH - DASH ON A DAILY CHART
5.9.21 0901H +8 PACIFIC
GOING BACK TO MINIMALISM
I am Back to Minimalism. Sorry I made a mistake in my previous published idea on $DASH
I should have not placed an ABC PATTERN, since patterns are dependent on corrections and extensions, from ABC,ABCDE,XYZ,AB=CD and so forth.
The minimal use of tools that I am learning are range boxes that can visually show me areas of minor and major corrections via large and small range boxes.
Fib levels are done just to check on top up areas adding new stop losses and targets connected to my primary target, which is the large swing.
On this chart I placed Fib levels only as an example, that the range boxes being laid out upon determining a good entry point for an up swing determines such moves in advance. Having said so,
I will not complicate things and stick to a minimalist approach to trading that is easy for me and fits my trading psychology and risk appetite.
I would like to thank my Mentor for all the blessings of wisdom, God Bless You!
Happy Trading Everyone!
Note:
Run your Fibs at top and bottom of
the big and small range boxes together
with your chart for your targets.
This is not a piece of financial advice.
I am just a student and still learning.
Adjustments will be made in
accordance with The Dynamics of the
Market along with Trading Psychology.
Postings done most of the time will be
delayed, as it takes time for me to finish
on several assets.
Updates will be posted religiously if time
permits.

DASH HAS CHANCE TO BREAK THE CHANNEL UPTHIS PRICE ACTION AREA HAS BEEN BROKEN SO WE CAN EXPECT A BULL
FOLLOW AND LIKE FOR MORE SHORT TERM TRADE
SHORT-TERM TRADE
HRM

Eyes on Dash | 1200% potential | Long | DashEthEyes on Dash Eth - the sleeping giant no-one talks about.
----------------
Weekly
-
Market Cap Eth 1,185,373
24 Hour Trading Vol Eth 571,779
-
Green = Resistance
Red = Support
-
All-Time High in #Eth was Eth 5.611519
-
PA was sent down from 20 ema.
The right time to accumulate.
Landing on Moon in October.
-
Safe play
-----------
My Tp starts at 2x.
Sell 1/2 at 2x to protect your investment.
Leave rest for the moon bag.
-
Stay safe!
We are all going to make it!

Eyes on Dash | 1200% potential | Long | DashBtcEyes on Dash - Dash - the sleeping giant no-one talks about.
----------------
Weekly
-
Market Cap ₿71,393
24 Hour Trading Vol ₿34,698
-
Green = Resitance
Red = Support
-
All-Time High in #BTC was ₿0.11254554
-
PA has taken support of 20 ema & broken 50 ema resistance. 100 ema next.
The right time to enter and be patient.
Landing on Moon by October.
-
Safe play
-----------
My Tp starts at 2x.
Sell 1/2 at 2x to protect your investment.
Leave rest for the moon bag.
-
Stay safe!
We are all going to make it!

DASH - A return to ATH in 12 weeks time 🚀🌙Privacy coins are breaking out. We are DASHing all the way back to our all time high. Comparing the XMR chart to ZEC and DASH, they look absolutely identical. The only difference is that DASH and ZEC are 12 weeks behind XMR. Looks like they will return to their respective ATH some time around August 1st, 2021. We can also consider this to be a massive cup-and-handle pattern forming, spanning several years. Given the long time frame, this may have a good possibility of unfolding in our favour. The handle breakout beginning in August could bring DASH to a new ATH beyond $3000. DASH and ZEC look to be straight up on the weekly candles from here, with possible minor corrections along the way. Watch the 4H to determine your preferred entry. I am going long on these two privacy coins and will not be taking profits until reaching back to the previous ATH... I am confident that ZEC and DASH will follow in Monero’s footsteps and return to their respective ATH in approximately 12 weeks. That being said, there will certainly be many ups and downs along the way and this is a highly volatile trade. Always research for the latest news surrounding crypto, specifically privacy coins. There may be increased demand for privacy coins due to the current economic situation, or they may be at risk of being de-listed on more exchanges with more talk of regulations coming to crypto... privacy coins will certainly be a target, but they are also of great value within the crypto space. Keep monitoring the narrative. Of course use stop losses if trading w/ leverage. I do not trade on margin. Do your own research and invest with your own risk tolerance in mind. Do not get REKT. Best of luck in your investments.
* NOT FINANCIAL ADVICE!

Great buy opportunity in DASH🚀Hello guys
As we can see price was successfully breakout and retested $522 area and currently forming a Bullish Engulfing pattern.
- Wait for the Candle closure forming Bullish engulfing pattern.
- Put your Stop Loss below the Green Resistance turned Support area.
- Take Profit: 516.80 usd or Trail it with a Trailing SL.
If you find this helpful and want more FREE forecasts in TradingView
. . . . . Please show your support back,
. . . . . . . . Hit the 👍 LIKE button,
. . . . . . . . . . . Drop some feedback below in the comment!
. . . . . . . . . . . . . . And do follow me on Twitter for EXCLUSIVE Market updates: @mywealthstory
Your Support is very much 🙏 appreciated!
Happy Trading


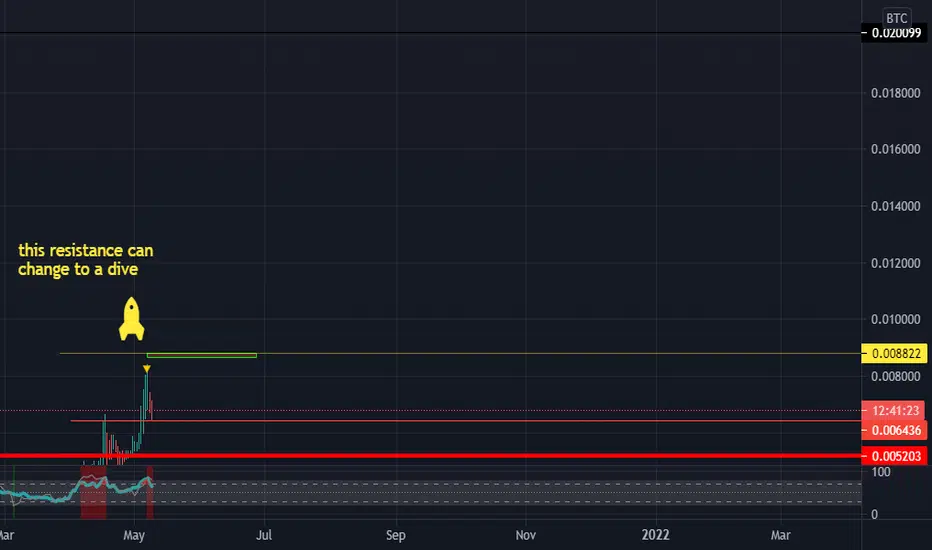
DASH Preparing Its Rocket 🚀 🚀 🚀💡 Trade Idea
📈 DASH/USDT Buy Market Order @ 435.35
🎯 Target Profit 465.70
🛑 Stop Loss 421.45
❌ Do not risk more than 1% of your account on each trade
🙂 Good Luck!
Description:
The price is ranging inside a wedge formation where we expect a breakout to the upside. A lower retracement might happen before a rally all the way up to our target profit.
-------------------------------------------------------------------------------------
Please press “Like” if you appreciate the trading idea 👍
“Follow” for more trading ideas in the future 👀
“Comment” below to share your thoughts with us and other traders 👥
-------------------------------------------------------------------------------------
Risk Disclaimer: All trading ideas published by “collegeofpips” are for educational purposes only. These posts can help you to enhance your trading skills, but please do your own research before opening any trading position. ⚠️


Dash for the DoorWith likely continued selling of the high price to sales stocks $DASH appears ready to break down even further. There are a plethora of fundamental reasons why this company should be trading significantly lower, however, for the purpose of this post I will speak to technicals Price has battled the $166 are as resistance and $122 as support. With a close below that support yesterday and the company reporting EPS next week, $DASH has the real possibility of trading down to the $80 area.
Currently positioned with August $90 strike and November $110 strike puts.
Will be looking for similar opportunities in many of the stocks that sell at high Price to Sales ratios but many of those have solid business models whereas I believe DASH will never really be profitable because the model is inherently flawed.
