A trading opportunity to buy in DASHBTCTechnical analysis:
. DASH/BITCOIN is in a range bound and the beginning of uptrend is expected.
. The price is below the 21-Day WEMA which acts as a dynamic resistance.
. The RSI is at 42.
Trading suggestion:
. There is a possibility of temporary retracement to suggested support zone (0.02080000 to 0.01772000). if so, traders can set orders based on Price Action and expect to reach short-term targets.
Beginning of entry zone (0.02080000)
Ending of entry zone (0.01772000)
Entry signal:
Signal to enter the market occurs when the price comes to " Buy zone " then forms one of the reversal patterns, whether " Bullish Engulfing ", " Hammer " or " Valley " in other words,
NO entry signal when the price comes to the zone BUT after any of the reversal patterns is formed in the zone.
To learn more about " Entry signal " and the special version of our " Price Action " strategy FOLLOW our lessons:
Take Profits:
TP1= @ 0.02369300
TP2= @ 0.02589200
TP3= @ 0.02822700
TP4= @ 0.03294000
TP5= @ 0.04231000
TP6= @ 0.04986000
TP7= @ 0.05745000
TP8= @ 0.08202000
TP9= Free
Dashbitcoin

A trading opportunity to buy in DASHBTCTechnical analysis:
. DASH/BITCOIN is in a range bound and the beginning of uptrend is expected.
. The price is below the 21-Day WEMA which acts as a dynamic resistance.
. The RSI is at 42.
Trading suggestion:
. There is a possibility of temporary retracement to suggested support zone (0.02080000 to 0.01772000). if so, traders can set orders based on Price Action and expect to reach short-term targets.
Beginning of entry zone (0.02080000)
Ending of entry zone (0.01772000)
Entry signal:
Signal to enter the market occurs when the price comes to " Buy zone " then forms one of the reversal patterns, whether " Bullish Engulfing ", " Hammer " or " Valley " in other words,
NO entry signal when the price comes to the zone BUT after any of the reversal patterns is formed in the zone.
To learn more about " Entry signal " and the special version of our " Price Action " strategy FOLLOW our lessons:
Take Profits:
TP1= @ 0.02369300
TP2= @ 0.02589200
TP3= @ 0.02822700
TP4= @ 0.03294000
TP5= @ 0.04231000
TP6= @ 0.04986000
TP7= @ 0.05745000
TP8= @ 0.08202000
TP9= Free

Daily Bullish Signal $DASH #DASH #DASHBTC (17 March 2019)RED ARROW indicates the EXPECTED Time and Targets
Level Stoploss point up to maximize profit and reduce risk
I'm working all the time, even in Bearish Market


A trading opportunity to buy in DASHBTCTechnical analysis:
. DASH/BITCOIN is in a range bound and the beginning of uptrend is expected.
.The price is above the 21-Day WEMA which acts as a dynamic support.
. The RSI is at 54.
Trading suggestion:
. There is a possibility of temporary retracement to suggested support zone (0.02092000 to 0.01772000). if so, traders can set orders based on Price Action and expect to reach short-term targets.
Beginning of entry zone (0.02092000)
Ending of entry zone (0.01772000)
Entry signal:
Signal to enter the market occurs when the price comes to "Buy zone" then forms one of the reversal patterns, whether "Bullish Engulfing" , "Hammer" or "Valley" in other words,
NO entry signal when the price comes to the zone BUT after any of the reversal patterns is formed in the zone.
To learn more about "Entry signal" and the special version of our "Price Action" strategy FOLLOW our lessons:
Take Profits:
TP1= @ 0.02589200
TP2= @ 0.02822700
TP3= @ 0.03294000
TP4= @ 0.04231000
TP5= @ 0.04986000
TP6= @ 0.05745000
TP7= @ 0.06824000
TP8= @ 0.08202000
TP9= @ 0.09200000
TP10= Free

DASHBTC - Price analysis - what's next?Falling Wedge formed and breaks upside and drawn some targets as per price action. Seems like market looking good for a fresh trade.
Join our telegram channel for instant news and crypto updated
t.me

A trading opportunity to buy in DASHBTCTechnical analysis:
. DASH/BITCOIN is in a range bound and the beginning of uptrend is expected.
. The price is below the 21-Day WEMA which acts as a dynamic resistance.
. The RSI is at 50.
Trading suggestion:
. There is a possibility of temporary retracement to suggested support zone (0.02092000 to 0.01772000). if so, traders can set orders based on Price Action and expect to reach short-term targets.
Beginning of entry zone (0.02092000)
Ending of entry zone (0.01772000)
Entry signal:
Signal to enter the market occurs when the price comes to " Buy zone " then forms one of the reversal patterns, whether " Bullish Engulfing ", " Hammer " or " Valley " in other words,
NO entry signal when the price comes to the zone BUT after any of the reversal patterns is formed in the zone.
To learn more about " Entry signal " and the special version of our " Price Action " strategy FOLLOW our lessons:
Take Profits:
TP1= @ 0.02589200
TP2= @ 0.02822700
TP3= @ 0.03294000
TP4= @ 0.04231000
TP5= @ 0.04986000
TP6= @ 0.05745000
TP7= @ 0.06824000
TP8= @ 0.08202000
TP9= @ 0.09200000
TP10= Free


There is a possibility of the beginning an uptrend in DASHBTCTechnical analysis:
. DASH/BITCOIN is in a range bound and the beginning of uptrend is expected.
. The price is below the 21-Day WEMA which acts as a dynamic resistance.
. The RSI is at 47.
. While the price downtrend in the daily chart is not broken, bearish wave in price would continue.
Trading suggestion:
. There is a possibility of temporary retracement to suggested support zone (0.02260 to 0.02090). if so, traders can set orders based on Price Action and expect to reach short-term targets.
Beginning of entry zone (0.02260)
Ending of entry zone (0.02090)
Entry signal:
Signal to enter the market occurs when the price comes to " Buy zone " then forms one of the reversal patterns, whether " Bullish Engulfing ", " Hammer " or " Valley " in other words,
NO entry signal when the price comes to the zone BUT after any of the reversal patterns is formed in the zone.
To learn more about " Entry signal " and the special version of our " Price Action " strategy FOLLOW our lessons:
Take Profits:
TP1= @ 0.02589200
TP2= @ 0.02822700
TP3= @ 0.03231000
TP4= @ 0.03693200
TP5= @ 0.04289000
TP6= @ 0.04682700
TP7= @ 0.05483200
TP8= @ 0.06284500
TP9= @ 0.07424300
TP10= @ 0.08876300
TP11= Free

You would of sold ATH with this indicator on DASHBuy Green
Sell Red
//
it's mainly for swing trading, i use the 3 day / 15 day / monthly charts with it and it works perfectly,
//
it works good for stocks and cryptocurrency.
//
you will use heiken ashi chart style and turn on the EMA DOTS indicator.
once the indicator is on you will hide the heiken ashi so you only see the dots.
//
when a green dot -6.68% -7.44% -7.44% appears you buy, if a green dot -6.68% -7.44% -7.44% appears after that green dot -6.68% -7.44% -7.44% you hold your investment.
if a red dot appears you sell your position. easy as that.
//
the standard dots setting will be set to 10 - use this for any chart above 3 days
change the dots setting to 6 for 3day charts and below
//
shorter time frames will be choppy.
//
larger time frames will be smooth.
//
*Daytrading smaller timeframes is possible but not recommended.

DASH Coin Long Next Opportunity Upto 50% Move !!DASH on Support Level and Price doing restest we can see a spike upto 50% .
DASH Also making Bullish Channel Next Move will be aroung 3700.
Share Your Opinions in Comment Box
if You Satisfied With My Analysis My idea Then Dont Forgot To Like .
Warning- I m Not a Financial Advisor this idea Only For Educational Purpose Only.

DASH-ing to new all time high?DASH looks set to break out of a long term downtrend. Organic, slow growth is what I like. Will fire long out of this squeeze with a few more days of buy activity. With good volume she'll run...or "dash" (get it?).
Potential adam & eve, but the second formation is a bit too high.


A trading opportunity to buy in DASHBTCTechnical analysis:
. DASH/BITCOIN is in a range bound and the beginning of uptrend is expected.
. The price is below the 21-Day WEMA which acts as a dynamic resistance.
. The RSI is at 28.
. The price downtrend in the daily chart is broken, so the probability of the resumption of an uptrend is increased.
Trading suggestion:
. There is a possibility of temporary retracement to suggested support zone (0.02144600 to 0.01799300). if so, traders can set orders based on Price Action and expect to reach short-term targets.
Beginning of entry zone (0.02144600)
Ending of entry zone (0.01799300)
Entry signal:
Signal to enter the market occurs when the price comes to " Buy zone " then forms one of the reversal patterns, whether " Bullish Engulfing ", " Hammer " or " Valley " in other words,
NO entry signal when the price comes to the zone BUT after any of the reversal patterns is formed in the zone.
To learn more about " Entry signal " and the special version of our " Price Action " strategy FOLLOW our lessons:
Take Profits:
TP1= @ 0.02589200
TP2= @ 0.02822700
TP3= @ 0.03231000
TP4= @ 0.03693200
TP5= @ 0.04289000
TP6= @ 0.04682700
TP7= @ 0.05483200
TP8= @ 0.06284500
TP9= @ 0.07424300
TP10= @ 0.08876300
TP11= Free


Daily Bullish Signal #DASH #DASHBTC (17-09)As DASH signal on my channnel, DASH has actioned so good
#DASH (DASH/BTC)
Buy : 292
Flash Sell : 300
Short Sell : 310
Long Sell : 320-330-340-350-360-380
Stop : 280
Follow me for more signals daily
PM me if you need help or learn to trade

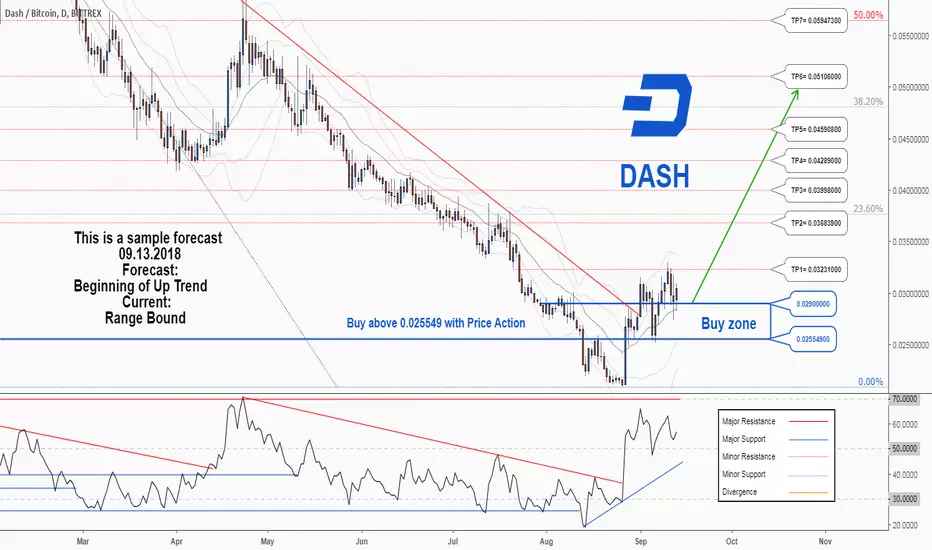
There is a probability of resuming the uptrend in DASHBTCTechnical analysis:
. DASH/BITCOIN is in a range bound and the beginning of uptrend is expected.
. The price is above the 21-Day WEMA which acts as a dynamic support.
. The RSI is at 56.
. The RSI downtrend & The price downtrend in the daily chart are broken, so the probability of the resumption of an uptrend is increased.
Trading suggestion:
. There is a possibility of temporary retracement to suggested support zone (0.02900000 to 0.02554900). if so, traders can set orders based on Price Action and expect to reach short-term targets.
Beginning of entry zone (0.02900000)
Ending of entry zone (0.02554900)
Entry signal:
Signal to enter the market occurs when the price comes to "Buy zone" then forms one of the reversal patterns, whether "Bullish Engulfing" , "Hammer" or "Valley" in other words,
NO entry signal when the price comes to the zone BUT after any of the reversal patterns is formed in the zone.
To learn more about "Entry signal" and the special version of our "Price Action" strategy FOLLOW our lessons:
Take Profits:
TP1= @ 0.03231000
TP2= @ 0.03683900
TP3= @ 0.03998000
TP4= @ 0.04289000
TP5= @ 0.04590800
TP6= @ 0.05106000
TP7= @ 0.05947300
TP8= @ 0.06485800
TP9= @ 0.07678600
TP10= @ 0.09200000
TP11= Free

DASHUSD: VERY IMPORTANT AREAHello guys,
at the moment DASHUSD is in touch with an important resistance level. In my opinion, if prices are able to stay above 280 USD (R1) for a couple of hours, loading indicators, it could develop a run to 300 USD (R2) as first step and then to 320 USD (R3) as second target.
In case set up is triggered, stop loss would be set to 268 USD.
Volume is not particularly exiting: for the movement to develop is necessary a rise of volume.
Indicators point out a possible new run.
To sum up:
if price remains above 280 USD R1----> R2 300 USD----> R3 320 USD
*** This analysis is not a buy or sell advice, it is drawn up for educational purpose only***
