#DASH/USDT – Bullish Breakout Setup | 1H Chart Analys#DASH
The price is moving within a descending channel on the hourly timeframe. It has reached the lower boundary and is heading towards a breakout, with a retest of the upper boundary expected.
The Relative Strength Index (RSI) is showing a downward trend, approaching the lower boundary, and an upward bounce is anticipated.
There is a key support zone in green at 64, and the price has bounced from this level several times. Another bounce is expected.
The RSI is showing a trend towards consolidation above the 100-period moving average, which we are approaching, supporting the upward move.
Entry Price: 67
First Target: 69.69
Second Target: 73.26
Third Target: 78.03
Stop Loss: Below the green support zone.
Remember this simple thing: Money management.
For any questions, please leave a comment.
Thank you.
Dashbtc

$DASH is consolidating inside a rising channel. As long as priceNASDAQ:DASH is consolidating inside a rising channel. As long as price holds above the 70–60 zone, this move looks like healthy consolidation rather than a top. A brief shakeout is possible, but the trend remains intact and higher levels are still in play.

#DASH/USDT – Bullish Breakout Setup | 1H Chart Analys#DASH
The price is moving in a descending channel on the 1-hour timeframe. It has reached the lower boundary and is heading towards breaking above it, with a retest of the upper boundary expected.
We have a downtrend on the RSI indicator, which has reached near the lower boundary, and an upward rebound is expected.
There is a key support zone in green at the 48 price level. The price has bounced from this zone multiple times and is expected to bounce again.
We have a trend towards consolidation above the 100-period moving average, as we are moving close to it, which supports the upward movement.
Entry price: 49.50
First target: 51.60
Second target: 54
Third target: 56.81
Don't forget a simple principle: money management.
Place your stop-loss below the support zone in green.
For any questions, please leave a comment.
Thank you.

DASHUSDT : 8-Year Descending Wedge Breakout?Dash (DASH) is showing early signs of a macro trend reversal on the monthly timeframe after trading inside a descending wedge for over 105 months (~3,120 days).
Price has consistently made lower highs and lower lows since the 2017 peak, compressing within well-defined downward-sloping trendlines. This long-term structure appears to be resolving to the upside, with price reclaiming key levels and pressing into the wedge resistance.
Key Points:
- 105-month compression following the 2017 cycle top
- Well-respected descending wedge structure
- Bullish expansion from long-term support
- Historical context suggests mean reversion potential after extended underperformance
If DASH can confirm a monthly close above wedge resistance, it would signal a structural trend change and open the door for a multi-leg recovery toward higher macro levels. Long consolidations on higher timeframes often precede powerful expansion phases.
Cheers
Hexa

#DASH/USDT – Bullish Breakout Setup | 1H Chart Analys#DASH
The price is moving in a descending channel on the 1-hour timeframe. It has reached the lower boundary and is heading towards breaking above it, with a retest of the upper boundary expected.
We have a downtrend on the RSI indicator, which has reached near the lower boundary, and an upward rebound is expected.
There is a key support zone in green at 41.50. The price has bounced from this zone multiple times and is expected to bounce again.
We have a trend towards stability above the 100-period moving average, as we are moving close to it, which supports the upward movement.
Entry price: 42.50
First target: 43.52
Second target: 46.86
Third target: 46.34
Stop loss: Below the support zone in green.
Don't forget a simple thing: capital management.
For inquiries, please leave a comment.
Thank you.

#DASH/USDT – Bullish Breakout Setup | 1H Chart Analys#DASH
The price is moving in a descending channel on the 1-hour timeframe. It has reached the lower boundary and is heading towards a breakout, with a retest of the upper boundary expected.
We are seeing a bearish trend in the Relative Strength Index (RSI), which has reached near the lower boundary, and an upward bounce is expected.
There is a key support zone in green at 43.12, and the price has bounced from this level several times. Another bounce is expected.
We are seeing a trend towards stabilizing above the 100-period moving average, which we are approaching, supporting the upward trend.
Entry Price: 39.00
First Target: 40.24
Second Target: 41.56
Third Target: 43.12
Remember a simple principle: Money Management.
Place your stop-loss order below the green support zone.
For any questions, please leave a comment.
Thank you.

DASHUSDT UPDATEDASH
UPDATE
DASH Technical Setup
Pattern: Falling Wedge Pattern
Current Price: 39.60 USDT
Target Price: 65.10 USDT
Target % Gain: 69.80%
Technical Analysis: DASH is breaking out of a falling wedge pattern on the 1D chart, indicating strong bullish potential. Price has reached the wedge support and is attempting a breakout after a prolonged downtrend. The projected upside target near 65.10 USDT is based on the measured move of the wedge, aligning with a key resistance zone.
Time Frame: 1D
Risk Management Tip: Always use proper risk management.

#DASH/USDT – Bullish Breakout Setup | 1H Chart Analys#DASH
The price is moving in a descending channel on the 1-hour timeframe. It has reached the lower boundary and is heading towards a breakout, with a retest of the upper boundary expected.
We are seeing a bearish bias in the Relative Strength Index (RSI), which has reached near the lower boundary, and an upward bounce is expected.
There is a key support zone in green at 44.40, and the price has bounced from this level several times. Another bounce is expected.
We are seeing a trend towards stabilizing above the 100-period moving average, which we are approaching, supporting the upward trend.
Entry Price: 45.00
First Target: 45.68
Second Target: 46.81
Third Target: 48.30
Remember a simple principle: Money Management.
Place your stop-loss order below the green support zone.
For any questions, please leave a comment.
Thank you.

FireHoseReel | DASH: Approaches Its Trigger Zone, Stay Sharp!🔥 Welcome FireHoseReel !
Let’s take a closer look at DASH and its key market triggers.
⚡ DASH – 4H Timeframe Analysis
DASH entered a corrective phase after a strong vertical rally and has been completing its pullback using a bearish curve-line.
Each time price touched this curve, it rejected and moved lower.
Now, DASH is reacting to this curve again—its 4th touch—and this curve overlaps with the $63 resistance, creating a key confluence zone.
A breakout above $63 can activate a risky long trigger, but the main long trigger remains at $74, where the structure fully shifts bullish.
📊 Volume Analysis
Volume on DASH has been gradually increasing, though it’s not yet visible on the 4H timeframe.
However, in the 15m and 1H charts, we can see clear buy-side volume spikes forming — a sign that volume may soon transfer upward into higher timeframes.
This rising volume behavior often signals early accumulation and makes DASH a solid candidate to keep on your watchlist.
🔁 DASH/BTC – A Parallel View DASH/BTC shows strong structural similarity to the DASH/USDT chart.
This alignment suggests coordinated whale behavior — essentially, more BTC is being converted into DASH, strengthening the pair.
Trigger zones for both pairs overlap, which gives higher confidence in our trade setups. Setting alerts for both charts is recommended.
📌 Trading Scenarios
🔼 Long Scenario
• Break of $63
• Confirmed by increasing 4H buy volume
• A pullback retest after breakout increases win rate and allows cleaner entry
• Main long confirmation arrives only with a break of $74.
🔽 Short Scenario
• Breakdown of $55.24
• Must be accompanied by high sell volume
• This would open the door for a deeper correction
🛞 Risk Management & Disclaimer
Please remember to always use proper risk management and position sizing. Nothing in this analysis is financial advice. The market can change quickly, so always trade based on your own strategy, research, and risk tolerance. You are fully responsible for your own trades.

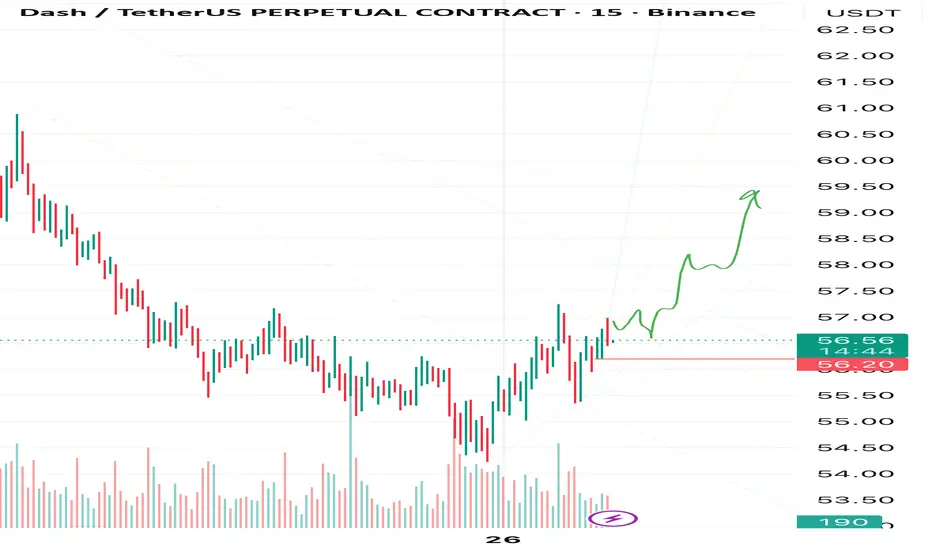
DASH: Ready to Remind Everyone Why It Used to MoonIt looks like DASH has fully digested that brutal correction, soaked up liquidity below the range, and is now coiling for another legendary leg up. The old king of privacy coins still knows how to shoot when least expected.
Target: 59.4
Invalidation: 56.2
⚠️ Disclaimer: This is not financial advice. Cryptocurrency trading involves significant risk and can result in the loss of your entire capital. Always do your own research and only trade with money you can afford to lose.
If you’re riding this move with me — smash that Like button, drop a 🚀 in the comments, follow for more alts that are waking up, and turn on notifications so you never miss the next one!
Let’s see if DASH still has that 2017 magic left in it. Who’s in? 👇
DASH Ready to Explode? Breaking the 7-Year Downtrend
Hello everyone,
As we can see in recent weeks, interest seems to be returning to privacy coins, which have been stagnant for years due to regulations and fears of delisting. But the situation now appears to have changed. In fact, the charts of privacy coins all look more or less the same ( CRYPTOCAP:ZEC , SGX:XVG , CRYPTOCAP:PIVX ), with a trendline going back to 2018 that has either just been broken or is about to be broken. Honestly, if you look at these charts, they’re among the most bullish ones across all higher timeframes.
Anyway, let’s do a quick analysis on DASH. As mentioned, in this case the trendline has already been broken, but right now it’s trading just below it. Personally, I believe it will follow exactly the same price action as CRYPTOCAP:ZEC and, once it starts consistently closing above it, it will shoot straight toward its old all-time high.
The setup is very interesting.
Thanks everyone for your attention!

DASHUSDT - Another Leg up ahead!DASH has gained over 300% in the past few weeks and is now in a healthy correction. It formed a consolidation and a falling wedge pattern, which it broke and successfully retested.
It’s starting to climb again.
A golden cross has formed, which should give it the momentum to break the 0.618 Fibonacci resistance, potentially pushing it past the $180 level
Best Regards:
Ceciliones🎯

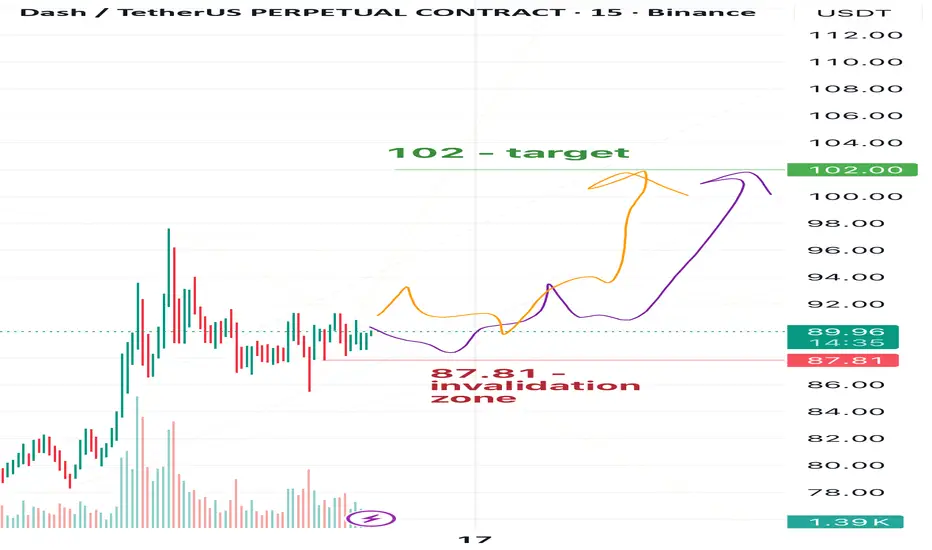
DASH: Building Momentum Toward 102📈In my view, Dash is currently forming an impulse. From the current levels, I’m expecting a move toward 102.
The invalidation level for this plan is 87.81.
🎯Target - 102
❌ Plan invalidation zone - 87.81
⚠️Disclaimer: This is not financial advice or a call to action — just my personal market view. Always make decisions based on your own risk management, and make sure to trade with stop-losses.
💬If you find this analysis helpful, feel free to leave a reaction, drop a comment, and follow so you don’t miss future updates and new Dash publications🚀
DASHUSDT Forming Bullish WaveDASHUSDT is currently showing a strong bullish wave pattern, signaling renewed momentum and strength from the buyers. This pattern often appears during early stages of a potential trend reversal, indicating that the coin could be gearing up for a powerful rally. The structure suggests that DASH is building a higher low formation, a key sign of accumulation by investors preparing for the next upward breakout. If momentum continues, the projected gain of 70% to 80% looks achievable as bullish pressure intensifies.
Volume remains healthy, supporting the overall bullish narrative. Sustained trading volume often confirms investor confidence and validates the price movement, making the ongoing uptrend more reliable. A rise in volume during breakout points would be a strong indicator that the coin is set for a significant price expansion.
Investor sentiment toward DASHUSDT has been improving, as more traders view it as an undervalued asset with solid recovery potential. The combination of a clear bullish structure, strong technical signals, and consistent market activity positions DASH as a promising short-to-mid-term opportunity. If the bullish momentum continues, this pair could become one of the top-performing assets in the coming sessions.
✅ Show your support by hitting the like button and
✅ Leaving a comment below! (What is You opinion about this Coin)
Your feedback and engagement keep me inspired to share more insightful market analysis with you!

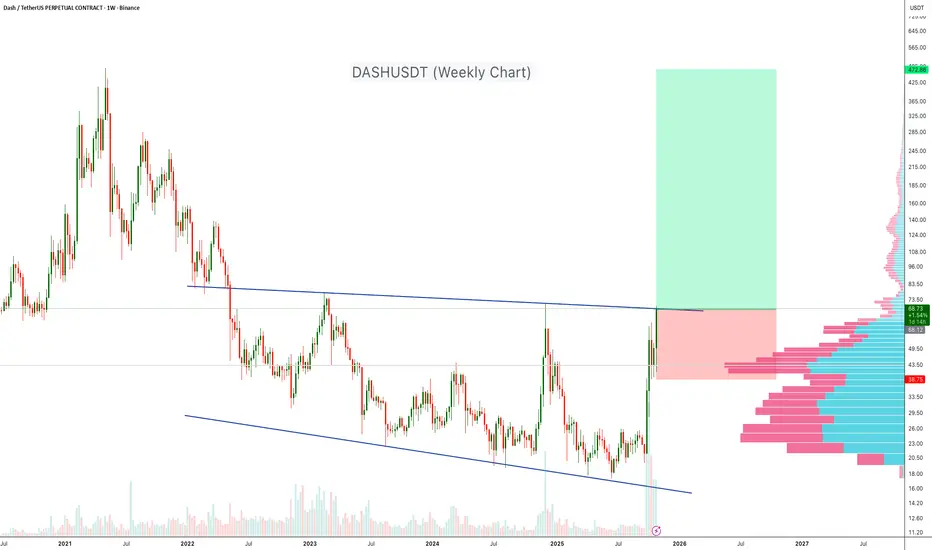
DASHUSDT Start of a Massive Rally?DASH has been trading inside a multi-year descending channel since early 2021. After several rejections from the upper boundary, the price has finally shown a strong breakout with a massive weekly candle, signaling potential trend reversal.
Key Points:
- Price has clearly broken out from the upper trendline of the descending channel.
- Strong buying volume supports the breakout confirmation.
- Historical volume profile shows a major liquidity gap above $70, suggesting room for a fast move once the price holds above the breakout zone.
🔷 Entry Zone: Below $70
🔷 Stop Loss: Below $38
🔷 Target: $400–470 (long-term potential)
Conclusion:
A confirmed breakout from a long-term descending channel could mark the beginning of a major uptrend for DASH. Sustained momentum above $70 may attract more volume and push the pair toward higher resistance zones.
Cheers
Hexa
NASDAQ:DASH BINANCE:DASHUSDT
DASHUSDTI think if the uptrend continues and BINANCE:DASHUSDT can break out above $50, it could gain bullish momentum toward $65.
⚠️Please control your risk.

DASHUSDT UPDATE #DASH
UPDATE
SOPH Technical Setup
Pattern: Bullish Falling Wedge Pattern
Current Price: $88.10
Target Price: $96.00
Target % Gain: 8.97%
NASDAQ:DASH has broken out of a bullish falling wedge pattern on the 4H timeframe. The move has already confirmed strong bullish momentum, producing an impressive upside continuation following the breakout. The structure supports further short-term bullishness toward the $96 region.
Time Frame: 4H
Risk Management Tip: Always use proper risk management and consider trailing stops to secure profits after a strong breakout.

#DASH/USDT#DASH
One of the currencies that witnessed a significant decline over the course of two years
The price has been moving in a descending triangle since the beginning of 2022
But recently the price reached a downward trend and is currently being broken
At a price of 33.00
First goal 59.00
Second goal 79.00
This represents 250% of the current price
With significant oversold and upward momentum
We also find that the MACD indicator is highly oversold
All of this supports the descending triangle pattern that has now been broken
We have a big support area on the chart at 25.00

#DASH/USDT#DASH
The price is moving in a bearish channel on the 12-hour frame and is largely sticking to it
We have a green support area at 26.00 that is expected to be bounced from due to its strength
We have a trend to hold above the Moving Average 100, which is strong support for the rise
We have very strong oversold resistance on the RSI indicator to support the rise with a strong uptrend
Entry price is 29.00
The first goal is 31.83
Second goal 34.24
The third goal is 37.00

DASHUSDT Forming Bullish WaveDASHUSDT is currently showing a strong bullish wave pattern, signaling renewed momentum and strength from the buyers. This pattern often appears during early stages of a potential trend reversal, indicating that the coin could be gearing up for a powerful rally. The structure suggests that DASH is building a higher low formation, a key sign of accumulation by investors preparing for the next upward breakout. If momentum continues, the projected gain of 70% to 80% looks achievable as bullish pressure intensifies.
Volume remains healthy, supporting the overall bullish narrative. Sustained trading volume often confirms investor confidence and validates the price movement, making the ongoing uptrend more reliable. A rise in volume during breakout points would be a strong indicator that the coin is set for a significant price expansion.
Investor sentiment toward DASHUSDT has been improving, as more traders view it as an undervalued asset with solid recovery potential. The combination of a clear bullish structure, strong technical signals, and consistent market activity positions DASH as a promising short-to-mid-term opportunity. If the bullish momentum continues, this pair could become one of the top-performing assets in the coming sessions.
✅ Show your support by hitting the like button and
✅ Leaving a comment below! (What is You opinion about this Coin)
Your feedback and engagement keep me inspired to share more insightful market analysis with you!

Dash usdt accumulation Dash is in a weekly accumulation zone and has entered a corrective bearish pattern. The likely end result will be a price breakout pattern. The breakout will begin after the price breaks above $77, but it's a good idea to buy at these prices. The targets are clearly shown in black on the chart, but not all price targets will necessarily be reached.

Dash usdt / accumulation Dash is in a weekly accumulation zone and has entered a corrective bearish pattern. The likely end result will be a price breakout pattern. The breakout will begin after the price breaks above $77, but it's a good idea to buy at these prices. The targets are clearly shown in black on the chart, but not all price targets will necessarily be reached.

DASHUSDT UPDATE#DASH
UPDATE
DASH Technical Setup
Pattern: Bullish Falling Wedge
Current Price: $49.17
Target Price: $65.20
Target % Gain: 36.00%
DASH is breaking out of a bullish falling wedge pattern on the 4H timeframe. Current price is $49.17 with a target near $65.20, showing about 36% potential upside. The breakout indicates strengthening bullish momentum and potential continuation toward higher levels.
Time Frame: 4H
Risk Management Tip: Always use proper risk management.
