#DASH/USDT – Bullish Breakout Setup | 1H Chart Analys#DASH
The price is moving in a descending channel on the 1-hour timeframe. It has reached the lower boundary and is heading towards breaking above it, with a retest of the upper boundary expected.
We have a downtrend on the RSI indicator, which has reached near the lower boundary, and an upward rebound is expected.
There is a key support zone in green at the 48 price level. The price has bounced from this zone multiple times and is expected to bounce again.
We have a trend towards consolidation above the 100-period moving average, as we are moving close to it, which supports the upward movement.
Entry price: 49.50
First target: 51.60
Second target: 54
Third target: 56.81
Don't forget a simple principle: money management.
Place your stop-loss below the support zone in green.
For any questions, please leave a comment.
Thank you.
Dashlong

#DASH/USDT – Bullish Breakout Setup | 1H Chart Analys#DASH
The price is moving in a descending channel on the 1-hour timeframe. It has reached the lower boundary and is heading towards breaking above it, with a retest of the upper boundary expected.
We have a downtrend on the RSI indicator, which has reached near the lower boundary, and an upward rebound is expected.
There is a key support zone in green at 41.50. The price has bounced from this zone multiple times and is expected to bounce again.
We have a trend towards stability above the 100-period moving average, as we are moving close to it, which supports the upward movement.
Entry price: 42.50
First target: 43.52
Second target: 46.86
Third target: 46.34
Stop loss: Below the support zone in green.
Don't forget a simple thing: capital management.
For inquiries, please leave a comment.
Thank you.

#DASH/USDT – Bullish Breakout Setup | 1H Chart Analys#DASH
The price is moving in a descending channel on the 1-hour timeframe. It has reached the lower boundary and is heading towards a breakout, with a retest of the upper boundary expected.
We are seeing a bearish trend in the Relative Strength Index (RSI), which has reached near the lower boundary, and an upward bounce is expected.
There is a key support zone in green at 43.12, and the price has bounced from this level several times. Another bounce is expected.
We are seeing a trend towards stabilizing above the 100-period moving average, which we are approaching, supporting the upward trend.
Entry Price: 39.00
First Target: 40.24
Second Target: 41.56
Third Target: 43.12
Remember a simple principle: Money Management.
Place your stop-loss order below the green support zone.
For any questions, please leave a comment.
Thank you.

#DASH/USDT – Bullish Breakout Setup | 1H Chart Analys#DASH
The price is moving in a descending channel on the 1-hour timeframe. It has reached the lower boundary and is heading towards a breakout, with a retest of the upper boundary expected.
We are seeing a bearish bias in the Relative Strength Index (RSI), which has reached near the lower boundary, and an upward bounce is expected.
There is a key support zone in green at 44.40, and the price has bounced from this level several times. Another bounce is expected.
We are seeing a trend towards stabilizing above the 100-period moving average, which we are approaching, supporting the upward trend.
Entry Price: 45.00
First Target: 45.68
Second Target: 46.81
Third Target: 48.30
Remember a simple principle: Money Management.
Place your stop-loss order below the green support zone.
For any questions, please leave a comment.
Thank you.

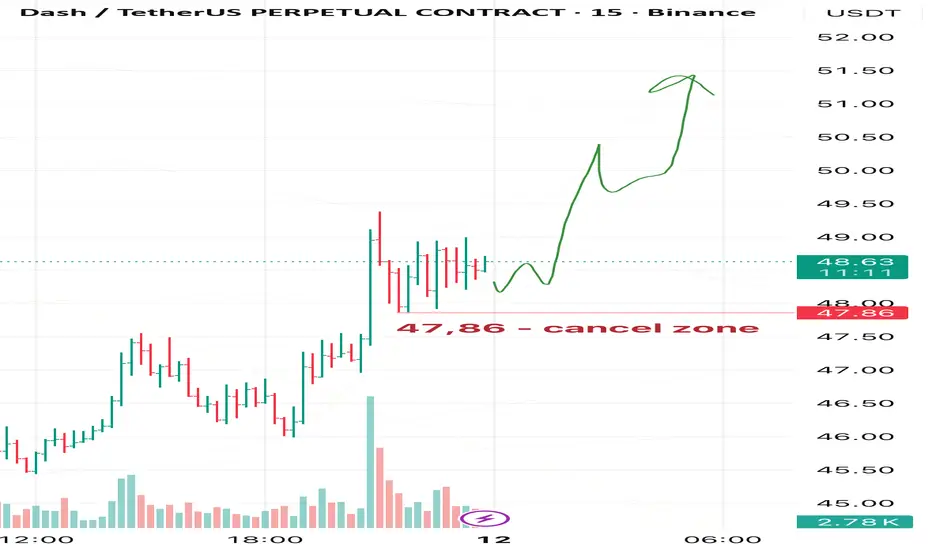
Dash: Assessing a Potential Trend ReversalThe extended downtrend in Dash appears to be losing strength, and the recent price action shows signs of a potential shift toward a bullish structure. The current upward movement may represent the early phase of a broader trend reversal — although it is equally possible that this is only a corrective advance before another leg down.
At this stage, Dash is technically positioned for continuation to the upside, but the overall structure still leaves open the question:
Has the downtrend truly ended, or will Dash revisit new lows after the expected upward move completes?
For now, I am leaning toward a short-term bullish scenario, with the following upside levels in focus:
• Target 1: 51.20
• Target 2: 53.00
• Target 3: 56.00
The invalidation level remains at 47.86 — a break below this support would indicate a failure of the emerging bullish structure and potentially open the path for a deeper continuation of the prior downtrend.
Until then, Dash maintains a constructive setup, but with important uncertainty about the long-term trend direction.
$DASH accumulation at last phase, decision time cameNASDAQ:DASH was accumulating after quick rally to 150, was making higher lows and resistance line is staying on the downside now. Personally expecting to rise over 71-73 level for further uprise retrecament. On the downside if we break below 50 level we will turn back where the story start.

DASH READY TO EXPLODEHey friends! 🔥
After my last Dash idea, a ton of you joined the page — awesome to see so much interest in this coin! Since you clearly like DASH as much as I do, here’s my fresh updated forecast.
I believe we’re heading higher from the current levels.
Targets:
🎯 1st — 65.2
🎯 2nd — 66.4 👈 this is my MAIN target
(🎯 3rd — 68+ ➡️ only if we get strong continuation above 66.3 (still questionable for now, will reassess there))
❌Invalidation level (plan cancelled): close below $63.6
Let’s see how it plays out! 🚀
Like & follow if you’re in the trade, will keep you updated.

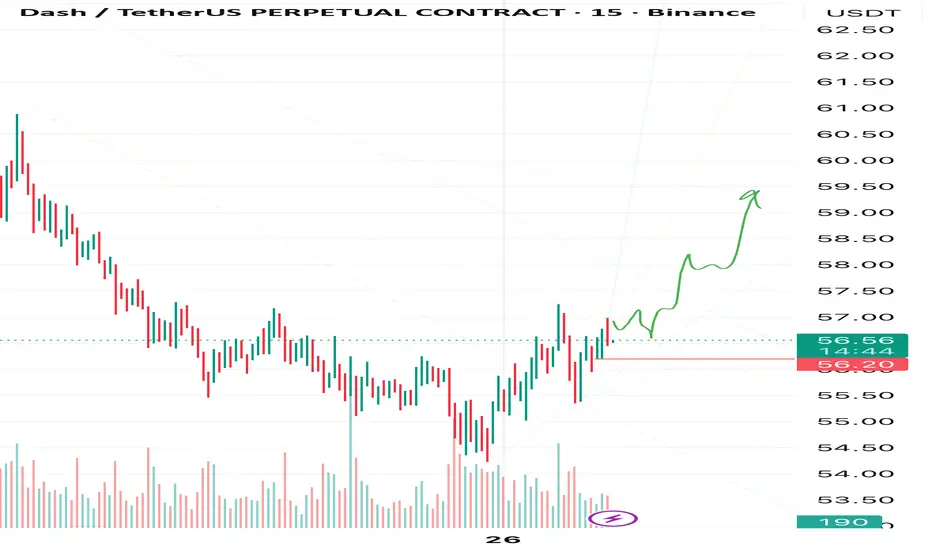
DASH: Ready to Remind Everyone Why It Used to MoonIt looks like DASH has fully digested that brutal correction, soaked up liquidity below the range, and is now coiling for another legendary leg up. The old king of privacy coins still knows how to shoot when least expected.
Target: 59.4
Invalidation: 56.2
⚠️ Disclaimer: This is not financial advice. Cryptocurrency trading involves significant risk and can result in the loss of your entire capital. Always do your own research and only trade with money you can afford to lose.
If you’re riding this move with me — smash that Like button, drop a 🚀 in the comments, follow for more alts that are waking up, and turn on notifications so you never miss the next one!
Let’s see if DASH still has that 2017 magic left in it. Who’s in? 👇
DASHUSDT - Another Leg up ahead!DASH has gained over 300% in the past few weeks and is now in a healthy correction. It formed a consolidation and a falling wedge pattern, which it broke and successfully retested.
It’s starting to climb again.
A golden cross has formed, which should give it the momentum to break the 0.618 Fibonacci resistance, potentially pushing it past the $180 level
Best Regards:
Ceciliones🎯

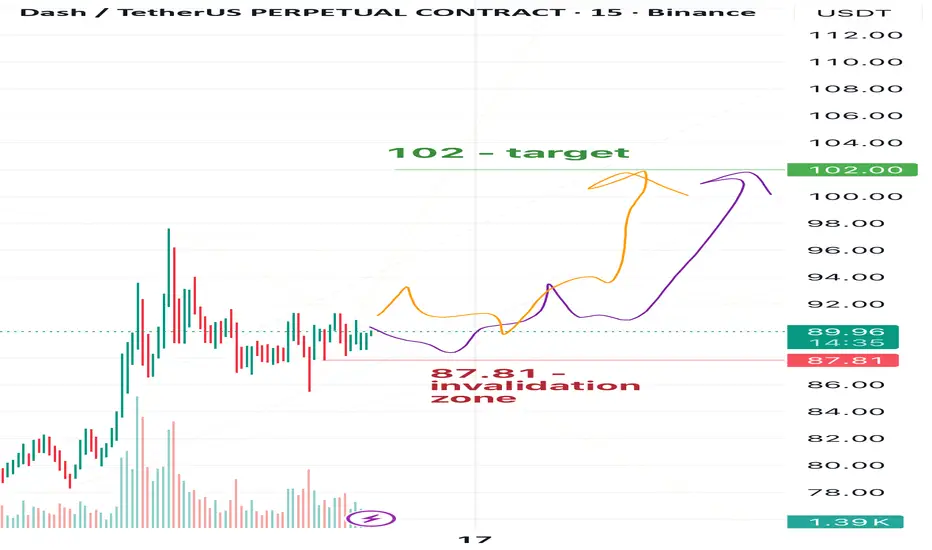
DASH: Building Momentum Toward 102📈In my view, Dash is currently forming an impulse. From the current levels, I’m expecting a move toward 102.
The invalidation level for this plan is 87.81.
🎯Target - 102
❌ Plan invalidation zone - 87.81
⚠️Disclaimer: This is not financial advice or a call to action — just my personal market view. Always make decisions based on your own risk management, and make sure to trade with stop-losses.
💬If you find this analysis helpful, feel free to leave a reaction, drop a comment, and follow so you don’t miss future updates and new Dash publications🚀
Dash Awakens — Correction TakenIn my view, Dash has completed its corrective phase.
Now I see the first technical signs of possible recovery and growth.
🎯My targets are 71.4 and 76.0
❌Plan would be invalidated at 65.68.
⚠️ This post is for analysis purposes only, not a trade signal.
Always control your risk and place stop-losses.
If you agree (or disagree!) — share your thoughts in the comments,
and don’t forget to follow for my next updates! 💬📊

Dash Setup — One More Push, Then UpIn my view, the correction in Dash is coming to an end. I expect one little final move down before we see a potential shift to the upside.
As usual, I see two possible scenarios — along the purple or the orange path. In both cases, I’m expecting a slight drop first before the trend turns upward.
💹 Target: 88
❌Invalidation zone: 72.78
⚠️ Disclaimer: This is not a trading signal, just my personal market outlook. Always trade with stop-losses and manage your risk!
💬 Feel free to react, comment, and follow if you’d like to see regular updates!

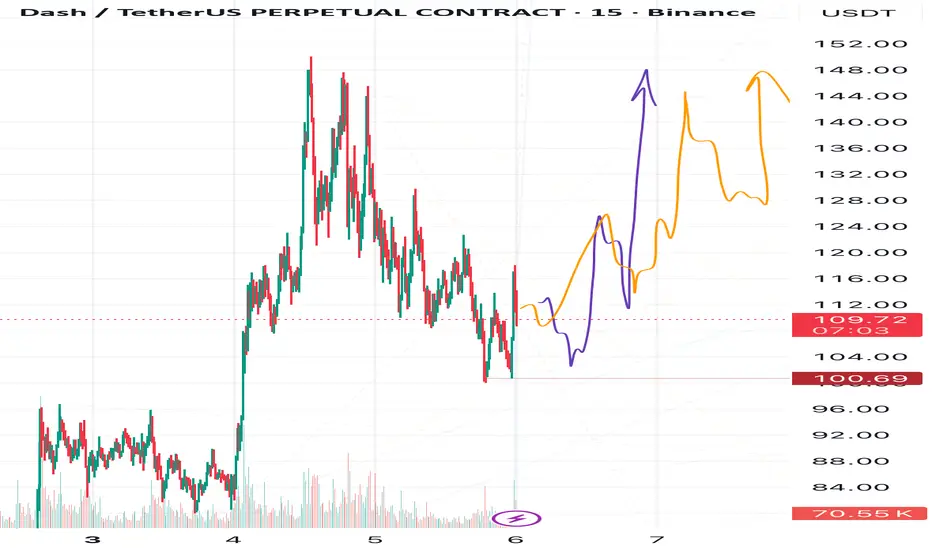
Dash in a Slow and Steady ClashIn my view, DASH is slowly gaining strength before reaching for new highs.
And it will definitely need that strength — the $150 level won’t be easy to break.
For now, I’m not setting that as a target, since the coin might move sideways between $110–146 before it’s ready to cross $150.
I currently see two possible scenarios, shown by the orange and purple arrows on the chart.
🎯 Target 1: $128
🎯 Target 2: $146
❌ Invalidation: $100.69
After some accumulation near $150, DASH might fly to $180, and later to $210 — but since I’m a bit pessimistic about Bitcoin right now, I prefer to stay cautious and not set those ambitious targets yet.
⚠️ Disclaimer:
This is not financial advice — just my personal market view for educational purposes only.
💬 Follow me so you don’t miss the next updates on DASH and other coins!
Dash is Back — Ready to Attack!Hey friends! 👋 How are you feeling after today’s drop?
Let’s talk about Dash.
In my opinion, Dash is finally ready to move toward my long-awaited targets at 100 and then 120.
My previous forecast didn’t play out as expected, since Dash entered the invalidation zone I mentioned earlier.
This time, the invalidation zone is at 83.70.
I currently have two possible scenarios for Dash — all shown on the chart with arrows of different colors. Each color represents a slightly different path the price could take before the next major move.
Let’s see which scenario the market chooses this time! 🚀
Disclaimer:
This is not a trading signal or financial advice.
Always make your own decisions based on your risk management, and never trade without stop-losses.

DASHUSDTI think if the uptrend continues and BINANCE:DASHUSDT can break out above $50, it could gain bullish momentum toward $65.
⚠️Please control your risk.

Dash in Motion — Riding the Bullish Ocean Dash looks ready to push higher.
I’m still targeting 100, and then 120 next.
The invalidation zone is marked at 87,99
Momentum looks strong — let’s see if the bulls keep control.
🚀 Drop a reaction if you’re tracking DASH too,
and follow me for my next update with a new entry setup

Dash on the Move — Bulls ApproveI expect DASH to rise toward 52, then 56, and later 68.
Two possible paths:
either it reaches 52, makes a pullback to current levels, and then moves up to 56,
or it goes straight to 56 without a pause.
In both cases, this move is part of a corrective triangle ABCDE,
with an upside breakout expected afterward —
which could take DASH even beyond 68 in the foreseeable future.
🎯 Targets:
• Target 1: 52
• Target 2: 56
• Global target: 68
Green — nearest growth potential.
Red — invalidation zone.
Let’s see which path DASH chooses 👀
Stay tuned for updates 🔔

#DASH/USDT#DASH
One of the currencies that witnessed a significant decline over the course of two years
The price has been moving in a descending triangle since the beginning of 2022
But recently the price reached a downward trend and is currently being broken
At a price of 33.00
First goal 59.00
Second goal 79.00
This represents 250% of the current price
With significant oversold and upward momentum
We also find that the MACD indicator is highly oversold
All of this supports the descending triangle pattern that has now been broken
We have a big support area on the chart at 25.00

#DASH/USDT#DASH
The price is moving in a bearish channel on the 12-hour frame and is largely sticking to it
We have a green support area at 26.00 that is expected to be bounced from due to its strength
We have a trend to hold above the Moving Average 100, which is strong support for the rise
We have very strong oversold resistance on the RSI indicator to support the rise with a strong uptrend
Entry price is 29.00
The first goal is 31.83
Second goal 34.24
The third goal is 37.00

Dash usdt accumulation Dash is in a weekly accumulation zone and has entered a corrective bearish pattern. The likely end result will be a price breakout pattern. The breakout will begin after the price breaks above $77, but it's a good idea to buy at these prices. The targets are clearly shown in black on the chart, but not all price targets will necessarily be reached.

Dash usdt / accumulation Dash is in a weekly accumulation zone and has entered a corrective bearish pattern. The likely end result will be a price breakout pattern. The breakout will begin after the price breaks above $77, but it's a good idea to buy at these prices. The targets are clearly shown in black on the chart, but not all price targets will necessarily be reached.

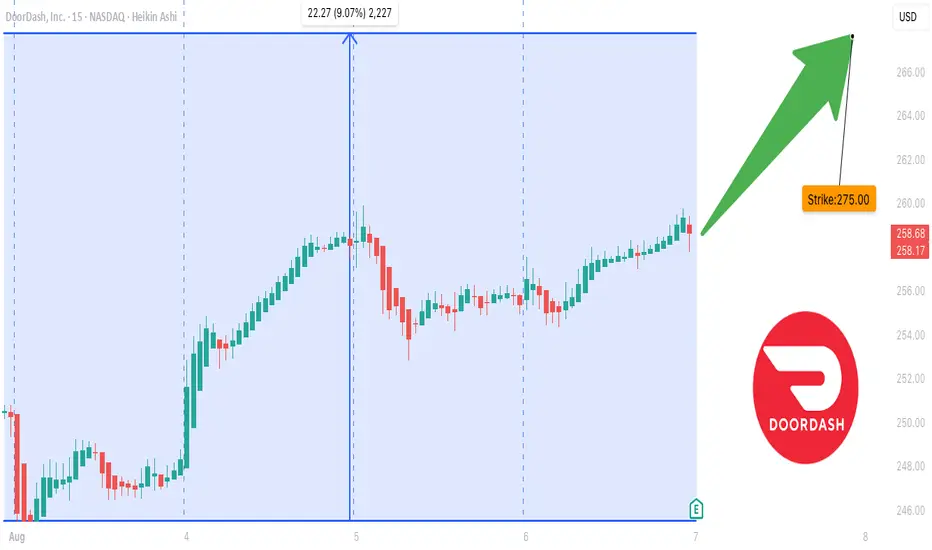
DASH Earnings Print Incoming ## 🚨 DASH Earnings Play (Aug 6) – Bullish Call Setup 🚨
**DoorDash (DASH) Gearing Up for a Big Move Post-Earnings?**
### 🧠 Key Thesis:
Analysts are turning **bullish** ahead of earnings, and the **options market is lighting up with call activity**—particularly at the **\$275–\$280 strikes**. With **IV climbing** and **O.I. stacking**, this setup is looking ripe for a post-earnings pop.
---
### 🔍 Snapshot Summary:
| Category | Score (/10) | Insights |
| --------------- | ----------- | ------------------------------------------------------------- |
| 📊 Fundamentals | 6 | Analyst upgrades suggest optimism despite margin concerns. |
| 💥 Options Flow | 7 | Bullish skew, strong OTM call buying, especially \$275/\$280. |
| 📈 Technicals | 4 | Limited history, but \$265 resistance in play. |
| 🌐 Macro | 5 | Inflation risk vs. discretionary rebound potential. |
🧮 **Overall Conviction**: **Moderate Bullish (70%)**
---
### 🔧 Trade Setup:
**💡 Strategy**: Buy Call Option
**📍 Strike**: **\$275**
**🕰 Expiry**: **Aug 08, 2025**
**💰 Entry**: \~\$4.90
**🎯 Target**: \$14.70
**🛑 Stop**: \$2.45
**📏 Size**: 1 contract (\~2% portfolio)
🔢 **Risk/Reward**: 3:1
📈 **Expected Move**: ±\$8.50
📊 **IV Rank**: 0.65
📆 **Earnings**: Aug 6 (After Market Close)
---
### 🧠 Why It Matters:
> **Smart money is leaning CALL-heavy with clear strike clustering.** Add to that the analyst optimism and macro tailwind potential—this could be the setup that prints 🚀
---
### 🔁 Exit Plan:
* ⏱ **Time-based**: Exit within 2 hours post-earnings if target not hit.
* 💎 **Profit**: Limit at \$14.70
* 🛡 **Risk Control**: Stop at \$2.45
Ready to $DASH! H5 Swing TradeReady to NASDAQ:DASH 🏃💨
🎯$215📏$227⏳May2025
Falling Wedge Breakout ✅
Breakout Retest ✅
Bullish WCB ✅
Volume Shelf ✅
Bullish H5_S Indicator ✅
Not Financial Advice
