DASH ASCENDING TRIANGLEHi guys, another DASH idea.
Seems that another ascending triangle is being formed.
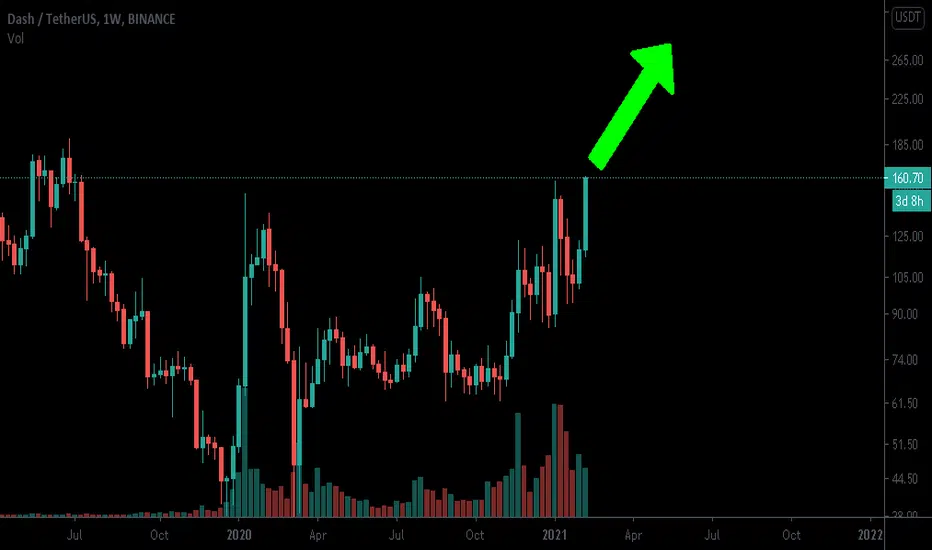
DASH still very bullish as all others crypto.
I'm doing this kind of idea for traders using leverages.
250$ is a good entry.
Dashusd

Long Dash 4k targetClear market fractals with the added benefit being that for once Dash seems to be lagging the larger caps. Early signs of big potential. Lot's of buying and not much selling. Simple. Road to the top will be bumpy but it's looking good.

Gains from Dash will be Impeccable by 2024I expect this to be one of the few times to buy Dash at such prices. RSI divergence on a bigger time frame; Cryptocurrency adoption at a more massive scale than ever before; only 9 million coins right now for dash and will hit perhaps 12 million by 2024, which still puts it at less than bitcoin.

DASH POSSIBLE 30% CORRECTIONHi guys,
I see a potential 30% correction before march.
DASH well performed today, and still very underevaluated so this correction may seem to be a nonsense, but in chart I trust.
If you have no leverage just hodl. I hodl mine.
If it breaks 175$'s resistance, buy.

DASHUSD 2021 Feb 11 Trade IdeaPrice Action Signal occurred at price level 158.251 as expected in the form of a Pin Bar.
Trend: Up
Level: 158.251
Signal: Pin Bar
Notes: Pin Bar formed on 12 Feb 2021 at 06:00.

BLUE CHIP FOR 2021Classic alt, 2021 looks really good for DASH and many others, still in main range, but highly doubt will hold much longer, Im currently buying everything I can, this will explode hard during 2021, following the big brother btc.

DASHUSD: DASH could be a Shooting Start? 65% and more ...Hello my friends!
Dash looks like it could catch up. Next target would be 200.
--
Let's see what happens.
Happy trading. :-)
--

pivx - dash's little brotherHey pivx is available on bittrex and binance, it is very bottom'd out. This coin really took off in 2017 and now that dash is finally waking up, I think it's a good time to get in the mini dash known as pivx.

DASHUSDT Have Cup and Retest!?Dash after broke the trendline it got a cup pattern and it seems, already broke and retest it.
Time to get into :)
Please press the like button if you like the idea or comment if you have a different view.

Long for huge gain DASH - part 2Part -2
As we can see RSI is very high and
we should see a deep pull back till 150
can be till 130, depending upon ETH and BTC
Range around 150-160
T1 - 240
Below - 150 can be good buy area,
Stoploss- 125
Be safe make money


power of altsThis shows you how every one has been preforming lately, and by everyone I mean the 7 or so coins I have on my radar lately!


DASH/USDT - Dash waking up with 35% pump! $200 next!DASH made a very nice pump today and in the past week it pumped 35%. This may not seem much considering some alts in the space, but as you can see on the chart, DASH is just starting to move, once this kicks-off the moves will be quite large.
I expect the momentum to pick up as soon as we pass $200 with conviction, then the path is clear to $400 and above.
The indicators show momentum is building up and DASH may be posed for some nice gains soon as it did not move much in these past two months, making it a great candidate for some good gains. As DEFI altcoins take a break, money will flow into the classics... DASH, LTC, ETC and so on.
So keep a close eye on this coin.
Bias remains very bullish and as long as the yellow parabola holds, we're good.
Like and follow if you liked this idea. Also join my crypto community to stay in touch!

Here I go long on DASH and DASH will go upHere I go long on Dash and Dash will go up. The price is testing the major resistance, so now i go 5x long and the bullish breakout will start. And DASH rocket will lauch.
Dash is bullish now more than ever.
See you up there.

DASH 3H BUYAlso set some Buy orders near the Trendline
Remember no more than 5% of the deposit in one trade
SL: next sell signal

DASH - $600+ THIS YEAR!DASH is looking at making a comeback in 2021. DASH has a very similar chart pattern to many other coins including WANCHAIN and NEO and EOS, that being a golden gross on the weekly as well as an Ichimoku cloud breakout and long term pennant breakout!
DASH could definitely see $642.92 + this year.
0.382 (642.664) fib retracment = $642.92 usd (fibonacci sequence)
As always let me know what you guys expect DASH to reach this year
''Buy Big Sell BIGGER'' - MegaWhale

DASH/USD Long limit entryEntry long 125
SL 108
PT1 163
PT2 214
BE 147
RRR 2,3:1
Long term
BINANCE:DASHBUSD

DASH JET GETTING READY 4H CHART DASHBTC DASHUSD DASHUSDTDASH JET GETTING READY 4H CHART DASHBTC DASHUSD DASHUSDT DASHUSDC


DASH LONG SOONDash has been trading inside our weekly trend lines for about 4 months. It reached a high around the 10th of Jan and has been bearish ever since (inside weekly trend lines). Bullish patterns started showing around the 29th of January reaching higher highs and lower lows inside the Golden Ratio. An instance of Heads and shoulders patterns started showing on the 4H time frame signaling to us that a breakout might occur around Feb 11. If sellers break the support past our confirmation rectangle (Yellow w red outline), they will take over and form a new bearish pattern. If not, the Bulls will take over.
