DASH/BTC TA Update (Another leg down?)DASH/BTC
Since there is no significant support is built during its parabolic uptrend,
we expect DASH to continue its slow death back to the mean or next key support area
which is located around 7200-6300 sats before we can see some relief rally up.
Dashusd


78.35 is important levelWhen we look at the weekly chart, fibonacci retracement level 78.35 ( %61.8 level of 38.42 to 142 ) is a strong support. I go long from this level. It is a good opportunity to make some profit.

Does DASH break the resistance line this time?DASH has a resistance line it needs to break. Once it gets through $92.60 then it should be clear until $100. On a break higher through this resistance line, then it looks like DASH starts a new rally higher.

Is it time for a reversal?Support lines are $83 and 80. If those are broken, then downside is somewhere in the $60-70 range. If we break above the downtrend line, then perhaps we get a reversal to the upside.

Watch the triangle break4 hour chart , wonderful triangle, it will break up or down very soon.My opinion up and the first target 103-104 then in a short period 175-180

FASTEN YOUR SEAT BELL DASH IS READY TO FLYLook at the similarity in weekly chart, 21 EMA is around 88.23. If it stays above this level, be ready to fly 175 - 180 level.

Time to buyLook at th similarity of the daily graph between the begining of June 2019 and today. I fit works we will fly to $140 very fast

Good Buying Opportunity İn Daily Chart#dashusd is testing daily channel lower band. This is a wonderful opportunity to buy around 88.75. You can make minimum 20-30 % profit if you buy from this level.

Dash (DASHUSDT) short.All description on the chart.
Please, don't forget to like and follow.
Thank you.

DASHUSD JUST AN IDEAPlease check your own strategy. I am waiting btc but ıf still this chart does not change, I will buy from support area.

Dash - The large crappy triangleI was sitting here before Dash dumped thinking man that look like the Crypto ascending triangle. Sure enough, it was. So far ever crypto has a tendcy to do this, move up in a perfect ascending triangle only to then dump. this is basically market makers trying to screw people out of money before running it up again.
Because of this, this is why I can draw this really crappy looking ascending triangle in anticipating that it bases out here at this local support. Wish I would have called that triangle sooner. I would have looked like an oracle or something. Maybe I still will if it move as anticipated? But expect to be in the doldrums for a bit as the market makers try and shake people out before the halving. and to their credit, they have gotten a lot of people to go short to add the fuel they need to really drive it up.
plus, we entered around $50, so we are in good shape here.
Cheers,
-Sherem

DASH Pennant: Consolidation Before Round 2This is a pretty massive pennant/equilibrium. We have some time to let this get tighter but I wanted to get it out there for anyone not aware. I'll give more information on my expected price targets etc after the break upwards. If we dip below $99.79 we're most likely doing something other than this equilibrium.

More euphoria KILLa clear distribution pattern has been printed a great buy over the next couple of weeks last time you'll see double digits when it dumps time to accumulate in a big way these markets will be extremely fun this year so be careful

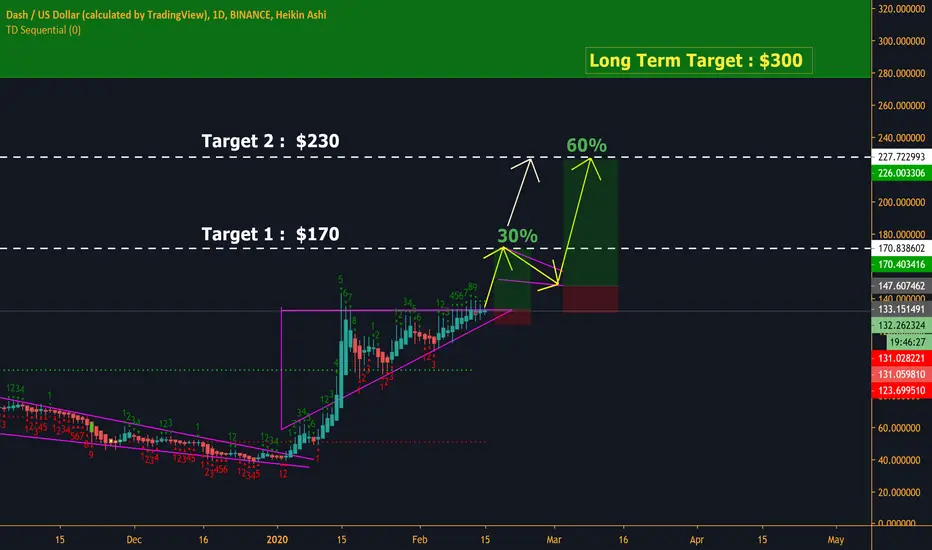
DASH : Path to $300 - Part 1 -- (30% Quick Profit)Back with another full Crypto Roller Coaster trade setup CT . As always take some time to LEAVE a LIKE and hit FOLLOW if you appreciate such analysis.
I believe DASH is making its way towards the $300 range forming a massive 2nd touch on weekly/monthly HTF scale. This could be seen in 2 big moves. Part 1 is here.
--- FULL TRADE INFO ----
TRADE 1:
Category : Short Term --- Spot Trade --- ALTCOIN-USD Pair.
Entry : Within the triangle or at retest (less probable)
Target : $170
Stop loss : 1-2 candles whole body close below the triangle support (~$122)
-- END --
Please LIKE and FOLLOW to get the FULL TRADE for Part 2. Thank you for all the love and support Crypto Fam .
Cheers. Keep RIDING THE ROLLER COASTER.
Dash (DASHUSDT) short.All description on the chart.
Please, don't forget to like and follow.
Thank you.


Dash Close to PumpHello Traders,
Dash seems to be close to finish its Elliot Wave 2 in a huge symmetrical triangle. It would be an excellent coin to invest in the near future.
We suggest to open long when it break out of those triangle.
Please push like button, you are welcome to follow us on tradingview.

Dash (DASHUSDT) long.All description on the chart.
Please, don't forget to like and follow.
Thank you.

Dash is about to enter the bula hoodThe charts are clear,
beras shall receive no quarter.
3x long, sell at 169 and reload at 132
This is not financial advice.

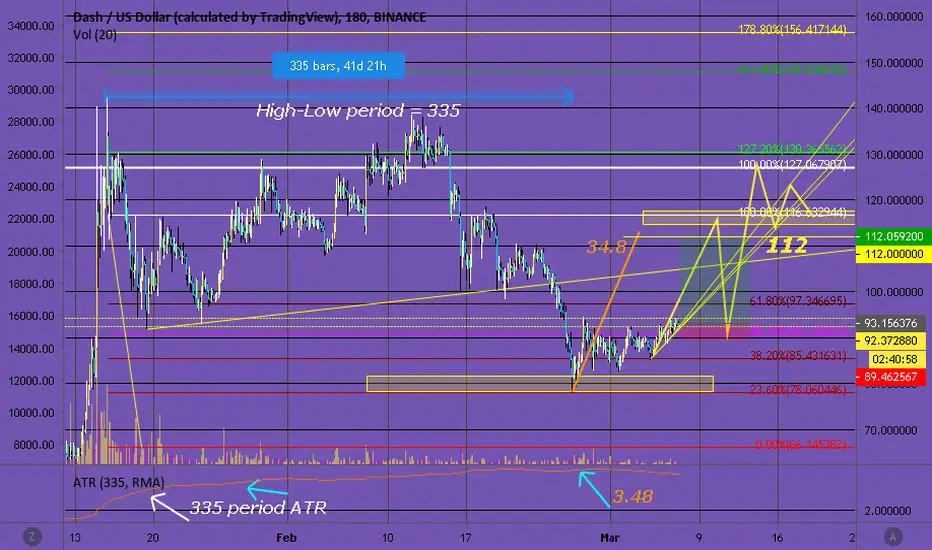
DASH/USDImminent breakout for DASH, likely to push towards 'Century VWAP'. DASH is unlikely to go above the VWAP on the first go, this recommends to sell at that level and re-buy on the following dip. Next target is 170'ish followed by a run to 200+ by the end of this month.
Possible entry point as low as 120:
WEEKLY RSI: super-bullish above 'X'

DASHUSD Potential BreakoutDASH USD 1H Chart is showing bull flag consolidation pattern. After the next level resistance is broken it is clear for DASH to hit $141. Keep an eye out.
