DASH Long UdatedHello
Dash is quicker than i am able to write articles.
Please wacht out.
LOONG
Good trades
Renkotrade
Dashusdanalysis
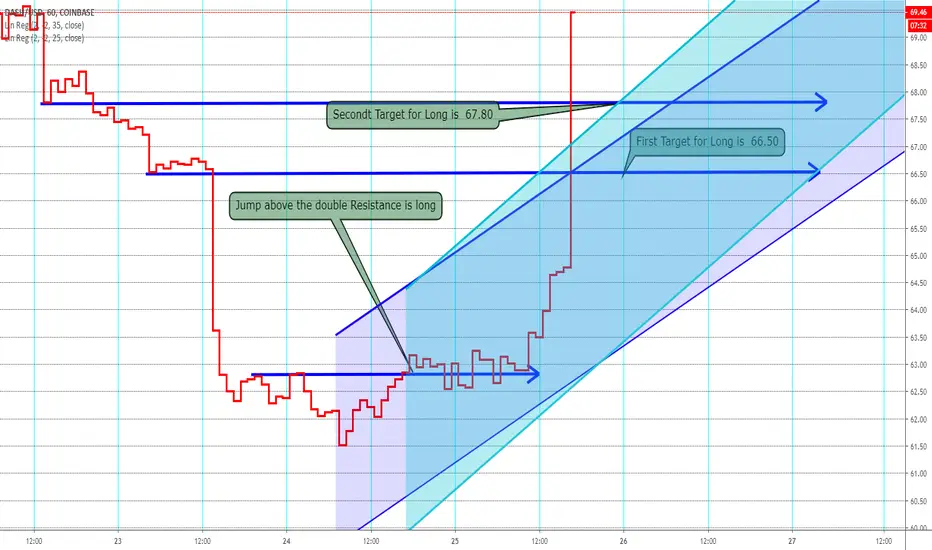
DASHUSD LONG BtreakoutHello to all warchng my charts.
Dash has now made the long jump also
please watch my picture
1. Target is reached right now. and second also
If you want to support my work and my charts, please like the
Good trades
Renkotrade
For personal assistance please go to
www.patreon.com

DASH LONG But Watch out the next Hours maybe SHORT comesHello to all watching my charts.
Here in DASH we ahev a longterm trend which is long
but momentum is very slow now.
It has been established a shorttime SHORT trendchannel
but ist must be confirmed with a fall below
the lower long trendline wich i marked in RED.
Other possibility is that DASH comes up again and
turns at these line to higher prices
and stays lonng.
Thats to watch
Good trades
Renkotrade

DASHUSD formed bullish bat | A good buying opportunityPriceline of Dash / US Dollar cryptocurrency has formed a bullish BAT pattern and entered in potential reversal zone.
This PRZ area should be used as stop loss point in case of complete candle stick closes below this area.
I have used Fibonacci sequence to set the targets:
Buy between: 67.920 to 67.023
Sell between: 70.059 to 73.269
Regards,
Atif Akbar (moon333)

DASH/USD LONG ITS ABOUT TO CRAZYDASh/USD has enter $68-$64 where we look to long
DASH/USD BUY
ENTRY 1 $68.00
ENTRY 2 $66.00
ENTRY 3 $64.00
sl $57.33
TP.1 $76.00
TP.2 $86.00
TP.3 $96
TP.4 $115
.01 every 125

DASH/USD LONG DASH BULL RUNDash is now available on binance us
all higher time frames have set up/are current trade set up
Buy dash/usd
Entry 70.00
Entry 2 68.00
Sl 64.18
Tp.1 76.00
Tp.2 80.00
Tp.3 86.00
Tp.4 92.00
.01 for every $100
it dash breaks resistance we going to $156

DASH/USD TO THE MOON (DASH=DIGITAL CASH)CRYPTO GOD ANALYSIS APPROVES DASH AS A PERFECT LONG TERM HOLD, MANY DONT KNOW THE TRUE FUNDAMENTALS OF DASH AND ITS USE CASE, DASH IS DIGITAL CASH THAT IS AVAILABLE RIGHT AWAY NO BANKS INVOLVED OR IN THE MIDDLE, YOUR PRIVACY TO YOUR CASH, YOU CAN WITHDRAW CASH FROM ATMS RIGHT AWAY. DASH MAX VOLUME IS LOW CAUSES LARGE PRICE SPIKES IN UPWARD DIRECTION. DASH 2.0 HAS BEEN RELEASED
DASH WILL BLOW MINDS
currently DASH/USD is bullish %1.64

DASHUSDT forming bullish Cypher | A good long opportunity ahead
Priceline of Dash / Tether US is forming bullish Cypher and soon it will be entered in potential reversal zone.
This PRZ area should be used as stop loss in case of complete candle stick closes below this zone.
Volume profile is showing less interest of traders at PRZ level but MACD is strong bearish and Stochastic is in bear cross so for secure trade we can wait for MACD to turn weak bearish or for stochastic to give bull cross then buy from the potential reversal zone.
I have used Fibonacci sequence to set the targets:
Buy between: 70.07 to 69.10
Sell between: 70.85 to 72.70
Regards,
Atif Akbar (moon333)

DASH/USD Double Bottom formingDash has set its self up perfectly to double bottom
on the only previous low in its past where we had a bull run
with double bottom formation complete it will break a major pivot point
causing dash to revisit all time highs of in 1500 price area

DASH - RISKY BUT MAY BE REWARDING - 77% - CryptoManiac101DASH / USD TA
We have a nice long term pattern formation here. We are right at support / trend line of this pattern. Entry now would allow you to set stop loss at around 7 - 12 percent risk. That's a higher risk trade but with reward potential over 70 percent, it might be worth the gamble.
Do not invest what you can't afford to lose. I am not your financial advisor.

DASHUSD has formed bullish BAT | Upto 137%Priceline of DASH / US Dollar cryptocurrency has formed a bullish BAT pattern and entered in potential reversal zone to hit the sell targets soon insha Allah.
Price action has hit the lower band of the bollinger bands after Dec 2018.
But beware the volume profile is still showing the traders interest even below the PRZ area and MACD is also strong bearish, even though the Stochastic is oversold but did not give bull cross sofar, therefore for secure trade I would suggest to wait for bull cross signal from stochastic or MACD to turn weak bearish then enter in trade.
I have used Fibonacci sequence to set the targets:
Buy between: 86.741 to 72.408
Sell between: 120.724 to 171.822

DASHUSD formed bullish shark | Upto 99% potential tradePriceline of DASH / US Dollar cryptocurrency has formed shark pattern and entered in potential reversal zone.
MACD is turning bullish.
Stochastic is oversold.
From here the price action can hit the sell targets soon insha Allah.
I have defined targets using Fibonacce sequence:
Buy between: 112.1357 to 92.8000
Sell between: 137.7805 to 185.3515
Regards,
Atif Akbar (moon333)

DASHUSD Market Structure Analysisif you have your market view, please share it in comments
Also you can ask me questions...
Have a great day everyone!

Is Dash getting ready to make 2019 ATH's?It appears as though #Dash is about to break out of this rather massive Ascending Triangle & create new highs for 2019 in the near term.
Keep eyes on Neptune Dash, trading on the TSX.V under the ticker symbol Dash. The stock has seen decent correlation to Dash in 2019.
Also, they are now validators for the Cosmos network, which will see increased attention due to FB using similar or the same tech.
Time will tell per usual.


Dash Possible Long Setupi am currently bullish on Crypto Currencies at the moment. Seeing as there has been a lot of movement in the news about certain cryptos i think the rest will all ride the momentum until 1 becomes a victor which i believe will be XRP

DASH: Breakout Coming For BUY !!Buy after Successfully Breakout, if Breakout Fail then don't trade in DASH Coin.
Falling Wedge are Making which is trend reversal pattern.
if Breakout Successfully then we can see Price Move upto 80% Target which wedge Height.
You Can Also set Own Risk reward.
Let see what Will be Next Move.
Warning- I m Not a Financial Advisor this idea Only For Educational Purpose Only.
Thank You !!

You would of sold ATH with this indicator on DASHBuy Green
Sell Red
//
it's mainly for swing trading, i use the 3 day / 15 day / monthly charts with it and it works perfectly,
//
it works good for stocks and cryptocurrency.
//
you will use heiken ashi chart style and turn on the EMA DOTS indicator.
once the indicator is on you will hide the heiken ashi so you only see the dots.
//
when a green dot -6.68% -7.44% -7.44% appears you buy, if a green dot -6.68% -7.44% -7.44% appears after that green dot -6.68% -7.44% -7.44% you hold your investment.
if a red dot appears you sell your position. easy as that.
//
the standard dots setting will be set to 10 - use this for any chart above 3 days
change the dots setting to 6 for 3day charts and below
//
shorter time frames will be choppy.
//
larger time frames will be smooth.
//
*Daytrading smaller timeframes is possible but not recommended.

DASHUSD UPDATEbreaking the line will be taking us down
and will probably test previous low.
sad
anyways like , comment and follow for more
ALSO SEE MY PREVIOUS DASH UPDATE


DASHUSD - 1D Chart Analysis
Like for the rest of the coins, the bearish trend is applied also for Dashl. Based as well on a decreasing market capitalization, it seems that the price is also searching for a bottom.
Technically speaking, the trend channel seems to be created by the peaks of 292$ and 231$ reached on the 20th of July and the 2nd of September, while the bottoms are 164$ and 127$, values which were reached on the 11th of July, respectively on the 14th of August.
If the price will finish the day below 187$ (the opening price of the candlestick) it means that we will see a red candlestick created below the 20 days Moving Average which can be a nice confirmation of the downtrend.
Both RSI and Stochastic have neutral positions while the MACD Line seems to try crossing the Signal one which can lead us to another bearish signal.
If this scenario gets caught up, the target prices which can be considered are :
* 171$ - Support Level 1
* 159$ - Support Level 2
* 141$ - Support Level 3 (in extension)

Dash Targets
Welcome Back!
Taking a look at the weekly it looks like were finally finished correction.
Market structure points to a falling wedge breakout which would indicate a reversal, as well as, continuation.
These are my targets for the bounce im expecting.
They were calculated by Fibonacci which thus far, Dash has shown to follow quite accurately.
God Bless,

DASHUSD: VERY IMPORTANT AREAHello guys,
at the moment DASHUSD is in touch with an important resistance level. In my opinion, if prices are able to stay above 280 USD (R1) for a couple of hours, loading indicators, it could develop a run to 300 USD (R2) as first step and then to 320 USD (R3) as second target.
In case set up is triggered, stop loss would be set to 268 USD.
Volume is not particularly exiting: for the movement to develop is necessary a rise of volume.
Indicators point out a possible new run.
To sum up:
if price remains above 280 USD R1----> R2 300 USD----> R3 320 USD
*** This analysis is not a buy or sell advice, it is drawn up for educational purpose only***
