DASH/USDT Is Testing the Downtrend Wall — Major Move Incoming?DASH/USDT is approaching a critical decision point that could define its next major trend.
Price has been suppressed under a dominant descending trendline since early November, and now the market is once again testing this structure — a technical barrier that has repeatedly rejected buyers.
But there’s a key development:
Bearish momentum is weakening.
The recent series of small higher-lows and tightening volatility indicates compression — a classic precursor to a large expansion move.
The horizontal levels shown (55 – 62 – 70 – 83 – 98 – 135) aren’t just resistance lines;
they are liquidity pockets where strong reactions historically occur.
---
📈 Bullish Scenario (Potential Large Reversal)
A confirmed breakout above the descending trendline and a 4H close above $55 would signal a major shift in structure.
If the breakout is validated:
Target 1 → $62
Target 2 → $70 (key psychological zone)
Target 3 → $83
Target 4 → $98
Target 5 → $135 (full recovery zone)
A clean breakout could mark the beginning of a mid-term trend reversal after weeks of downward pressure.
---
📉 Bearish Scenario (Rejection & Continuation)
If price gets rejected again at the trendline, sellers remain firmly in control.
A strong rejection would open the door to:
Support 1 → $44
Support 2 → $41 (major local low)
Break below $41 → new lower-lows likely, extending the broader downtrend
A sharp bearish candle at the trendline typically signals aggressive selling from larger participants.
---
📌 Key Pattern
Dominant Descending Trendline → guides the entire bearish structure
Compression Price Action → volatility tightening near a major decision point
Potential Trend Reversal Pattern if price breaks above trendline
Liquidity Layering → horizontal levels mark key liquidity pools
The market is now sitting in a “Decision Zone” — a spot where the next major move is usually born.
---
🎯 Summary
DASH is at a rare technical moment:
A retest of the primary trendline that separates reversal from continuation.
Breakout → Trend shift
Rejection → Bearish continuation
This is a moment for confirmation, not prediction.
#DASH #DASHUSDT #CryptoAnalysis #TechnicalAnalysis #BreakoutSetup #TrendReversal #MarketStructure #PriceAction #LiquidityZones
Dashusdtrading

$DASH accumulation at last phase, decision time cameNASDAQ:DASH was accumulating after quick rally to 150, was making higher lows and resistance line is staying on the downside now. Personally expecting to rise over 71-73 level for further uprise retrecament. On the downside if we break below 50 level we will turn back where the story start.

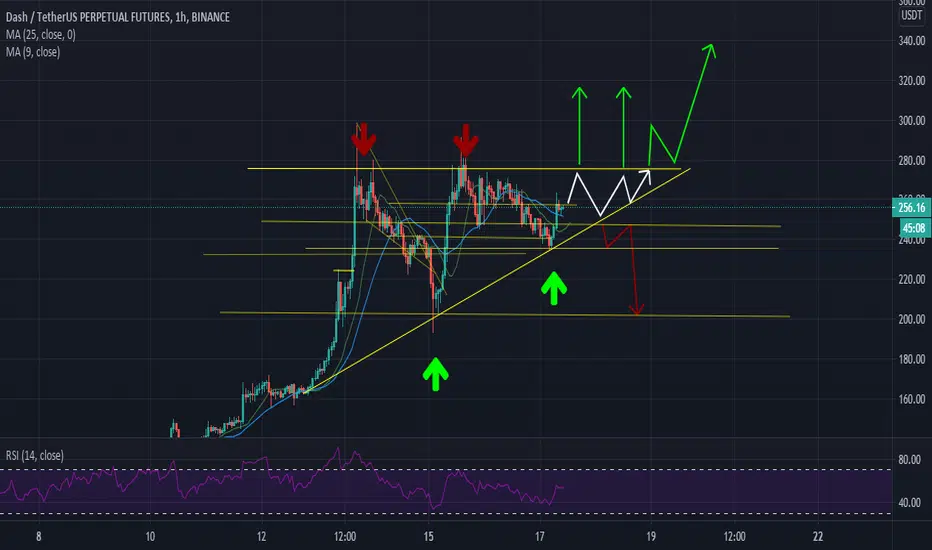
DASH/USDT - Ready for a New Rally? Strong Trendline Break?DASH is entering a highly critical phase. After a deep corrective move, the price has finally broken above the main downtrend line, which has been suppressing every bullish attempt for several sessions. This breakout is not just a casual push — it occurred exactly after the market retested the strong demand zone at $83–$75, an area that has repeatedly acted as an accumulation block for larger players.
The market structure paints a clear story:
Impulsive rally toward $150 → distribution → controlled retracement.
A series of lower highs → well-defined downtrend → bearish pressure gradually fading.
Strong 4H breakout above the trendline → early trend reversal signal.
DASH now stands at an inflection point. Buyers successfully defended the demand zone, and the next move will determine whether this breakout evolves into a full bullish reversal or simply a temporary relief rally.
---
Bullish Scenario (Rising Momentum + Structural Shift)
If the buyers maintain this momentum, the bullish setup becomes very compelling:
1. Successful retest/hold above the broken trendline → validation of the reversal.
2. Clean 4H breakout above $96.9 → opens the next range.
3. Upside targets become:
Target 1: $105
Target 2: $134 (major supply zone)
Primary Target: $149–150 (previous swing high)
A confirmed breakout above $134 would signal the start of a larger markup phase.
---
Bearish Scenario (If the Breakout Turns Into a Fakeout)
The bearish scenario activates only if price breaks back below the $83–$75 demand zone.
A 4H close beneath this region would:
Invalidate the bullish breakout
Shift structure back into bearish continuation
Confirm downside targets toward:
$68
$60
And in an extended selloff, a revisit to the $40 region.
This $83–$75 zone remains the final defensive line for buyers. As long as it holds, bullish bias stays intact.
---
Key Pattern Breakdown
Downtrend Breakout → transition from distribution to accumulation.
Demand Zone Rejection ($83–$75) → shows strong buy-side interest and potential structural reversal.
Potential Higher Low Formation → early stages of bullish trend development.
Continuation Potential if $96.9 is broken with strength.
These elements suggest that DASH may be preparing for the early phase of an uptrend — pending confirmation.
---
Technical Insight
Bulls have successfully defended structural support above the demand zone.
Momentum shift appears after the trendline break.
A confirmed 4H close above $96.9 will likely activate the next leg upward.
Any pullback into the $83–$75 zone remains a high-value accumulation area (as long as the zone holds).
#DASH #DASHUSDT #CryptoAnalysis #Breakout #Reversal #DemandZone #PriceAction #CryptoMarkets #TechnicalAnalysis

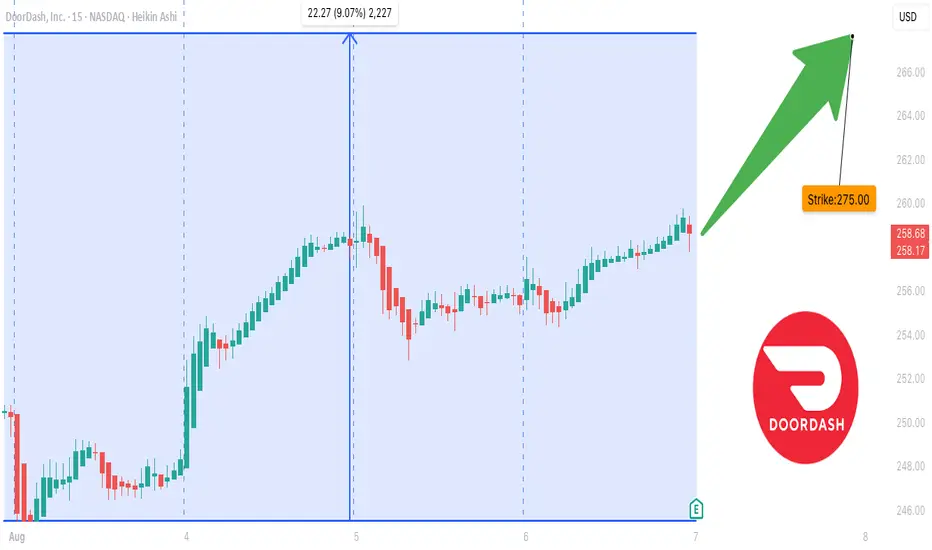
DASH Earnings Print Incoming ## 🚨 DASH Earnings Play (Aug 6) – Bullish Call Setup 🚨
**DoorDash (DASH) Gearing Up for a Big Move Post-Earnings?**
### 🧠 Key Thesis:
Analysts are turning **bullish** ahead of earnings, and the **options market is lighting up with call activity**—particularly at the **\$275–\$280 strikes**. With **IV climbing** and **O.I. stacking**, this setup is looking ripe for a post-earnings pop.
---
### 🔍 Snapshot Summary:
| Category | Score (/10) | Insights |
| --------------- | ----------- | ------------------------------------------------------------- |
| 📊 Fundamentals | 6 | Analyst upgrades suggest optimism despite margin concerns. |
| 💥 Options Flow | 7 | Bullish skew, strong OTM call buying, especially \$275/\$280. |
| 📈 Technicals | 4 | Limited history, but \$265 resistance in play. |
| 🌐 Macro | 5 | Inflation risk vs. discretionary rebound potential. |
🧮 **Overall Conviction**: **Moderate Bullish (70%)**
---
### 🔧 Trade Setup:
**💡 Strategy**: Buy Call Option
**📍 Strike**: **\$275**
**🕰 Expiry**: **Aug 08, 2025**
**💰 Entry**: \~\$4.90
**🎯 Target**: \$14.70
**🛑 Stop**: \$2.45
**📏 Size**: 1 contract (\~2% portfolio)
🔢 **Risk/Reward**: 3:1
📈 **Expected Move**: ±\$8.50
📊 **IV Rank**: 0.65
📆 **Earnings**: Aug 6 (After Market Close)
---
### 🧠 Why It Matters:
> **Smart money is leaning CALL-heavy with clear strike clustering.** Add to that the analyst optimism and macro tailwind potential—this could be the setup that prints 🚀
---
### 🔁 Exit Plan:
* ⏱ **Time-based**: Exit within 2 hours post-earnings if target not hit.
* 💎 **Profit**: Limit at \$14.70
* 🛡 **Risk Control**: Stop at \$2.45
DASHUSDT 2D AnalysisDASH ~ 2D Analysis
#DASH Buy back gradually from this support block with short term target of at least 15%+ , Long term target $65

DASHUSDT 2D AnalysisDASH ~ 2D Analysis
#DASH If you still have a Conviction on this Coin, Maybe this support block you can consider to start buying back from here with a short -term target of at least 15%+.

DASHUSDT 1WDASH ~ 1W Analysis
#DASH Support that you might be able to consider to start buying back from here with a minimum target of 20%+.
Reason, This is the lowest support for now.

DASHUSDT 1WDASH ~ 1W
#DASH If you still have Conviction on this coin,. buy gradually on this support block with a target of at least 20%+

DASHUSDT 1WDASH ~ 1W
#DASH If you still have Conviction on the coin,. Buy gradually within this support block,. with a minimum target of 20%++

DASH LONG BULLISH IDEASDash last bottom zone is $ 25 for me and I think I will buy from there if it falls. I think these two scenarios will develop, stay tuned. fibonacci levels are very important.

DASH - Buying SignalBYBIT:DASHUSDT.P
1H time frame
-
DASH is forming a potential symmetrical structure.
MACD is going to reverse from negative to positive.
What we need to wait is increased volume.
-
Entry: 41.1
TP: 46.7. 50
SL: 39.9

DASHUSDT | Bulls Assemble?DASHUSDT has been holding horizontal level of 39 for a very long time now. We have seen 5 attempts but bears are unable to break it.
We expect price to break from here now. The only thing required is breakout from falling resistance and RSI should break above neutral zone.
How do you see DASH in coming days?

Dashusdt longI think it's time for the market to turn to potential currencies with zinc potential.
As you know, Dash is one of these currencies. As you can see
This currency can give you 100% profit.
you can buy this coin at 90$ price.


dashIt has good conditions for overcoming the resistance of $ 190
For the short term, the first target with 15% profit and the second target with about 40% profit are available
But in case of falling prices
Yellow areas are a good shopping opportunity

Dash' targetshey again, as we see on the chart there is strong resistance under the green line, so we need close above 224 4h bar to get our targets
.
short term:
TP1: 254
TP2: 294
TP3: 338
.
long term:
TP1: 600
TP1: 1200
TP3: 2000
.
..NOTICE..
this is a high-risk trade so please if you don't how to trade, how to secure your money or your running profits or nothing know in trading, no enter into trade
I will not responsible for the loss.
.
stay tuned for the upcoming analysis of the coins
if you want any coin's targets or analysis, just comment guys ;)
...

DASHUSDT Was Rejected After the Retest
Welcome back Traders, Investors, and Community!
Hi Traders, DASHUSDT on D chart has broken above the Resistance. After the retest it has formed 2 days green candles, I expect that it moves higher.
⬆️Buy now or Buy at 101.85
⭕️SL @ 73.0
✅TP1 @ 216.05
✅TP2 @250.00
✅TP3 @ 336.00
✅TP4 @ 399.65
✅TP5 @ 475.85
✅TP6 @ 542.90
We will have more FREE forecasts in TradingView soon
❤️ Your Support is really appreciated!❤️
Have a Profitable Day

DASHUSDT: Below 230 USDT a new Buying Opportunity around 150-183I think DASHUSDT may give us a new buy opportunity around 150-184 USDT if 230 USDT trend support is broken down. HODL! not an investment advice!!

dashusdt scenarioDASHUSDT on 4h time frame is making a corrective structure to go long with the targets we see on the chart that are PRZs from fibo levels .future shines for this coin!!

Ascending Triangle seen in $DASH 1hr TFAscending Triangle seen in $DASH 1hr TF that could move up the price of $DASH...
Only if this $DASH will move like my chart idea
Trade at your own risk...
💡 Don't miss the great buy opportunity in DASH/USDTTrading suggestion:
. There is a possibility of temporary retracement to suggested support line (96.94). if so, traders can set orders based on Price Action and expect to reach short-term targets.
Technical analysis:
. DASH/USDT is in a range bound and the beginning of uptrend is expected.
.The price is above the 21-Day WEMA which acts as a dynamic support.
. The RSI is at 70.
Take Profits:
TP1= @ 104.48
TP2= @ 110.55
TP3= @ 118.10
TP4= @ 127.52
TP5= @ 136.84
SL= Break below S2
❤️ If you find this helpful and want more FREE forecasts in TradingView
. . . . . Please show your support back,
. . . . . . . . Hit the 👍 LIKE button,
. . . . . . . . . . . Drop some feedback below in the comment!
❤️ Your Support is very much 🙏 appreciated! ❤️
💎 Want us to help you become a better Forex trader ?
Now, It's your turn !
Be sure to leave a comment let us know how do you see this opportunity and forecast.
Trade well, ❤️
ForecastCity English Support Team ❤️

DASHUSDt - break out inclined level.Break out the inclined, see how well such break out work out.
The inclined level was formulated on a large of touches.
do you trade inclined levels?
Push like if you think this is a useful idea!
Before to trade my ideas make your own analysis.
Write your comments and questions here!
Thanks for your support!

DASHUSD - breakout supportLocal trend -downtrend
Glolobal trend - downtrend
small timeframe - rang.
The price is prepared for a break-down of the support level.
Push like if you think this is a useful idea!
Before to trade my ideas make your own analysis.
Write your comments and questions here!
Thanks for your support!
