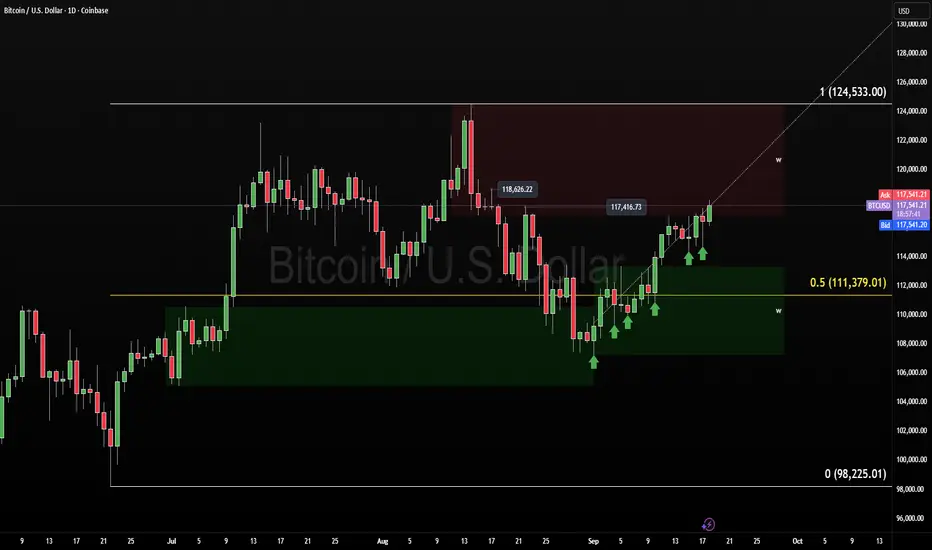
BTC 80% Chance of Another Low, BUT First...On 11/22/25 , Bitcoin experienced a relatively rare event: the Daily RSI dropped below 26 . On the Coinbase COINBASE:BTCUSD chart, this has occurred only 20 times historically since December 2014. By analyzing the price action following each occurrence, we can estimate the probability of future behavior when RSI reaches these extreme levels.
The results of each occurrence are summarized in the table shown on the chart.
The table includes:
Dates when RSI fell below 26
Whether price eventually made a lower low ( 16 out of 20 times, or 80% )
Maximum bullish move from the Daily swing low close to the highest wick before correcting (average +16% )
Time to reach that swing high (average 8 days )
Time to reach a new lower low (average 22 days )
The 16 times price eventually made lower low are marked with red or purple vertical lines . The 4 times it did not make a lower low are marked with green vertical lines .
Key Observations
When RSI drops below 26, it typically signals strong bearish momentum , but it is also often followed by a bullish RSI divergence as price forms a higher low in momentum. Historically, a lower low formed 80% of the time , suggesting a high probability of another downside move for BTC in the weeks ahead.
At present:
RSI bottomed at 22.93 on 11/22/25
BTC has already rallied ~11% from the swing low
We are currently at day 21 without a new lower low
All of these metrics remain well within historical norms .
However, there is an interesting nuance. Of the 16 cases where a lower low eventually formed , only 4 took more than 20 days to do so . In all 4 cases (marked with purple vertical lines) , BTC tested the Weekly 12 EMA before making the next leg lower (with a minor exception on the11/24/19 case, where a marginal lower low formed before a strong push above the Weekly 12 EMA).
The Weekly 12 EMA currently sits around $100,000 , suggesting BTC may test this level before any further meaningful correction.
ACTIONALBLE SCENARIOS
If this is a bear market:
Passive investors: Continue dollar-cost averaging at your preferred interval.
Active investors: Consider taking partial or full profits if BTC trades above $100,000 . Set calendar alerts for October 2026 and/or below $50,000 to resume heavier accumulation when BTC may bottom this bear cycle.
Swing traders: Consider Long setups below $86,800 with a stop-loss at $83,500, targeting the Weekly 12 EMA (~$100,000) , with an extended target around $101,000 .
If this is still a bull market:
Price will likely make a lower low to below $80,000 before a bullish move.
Passive investors: Continue dollar-cost averaging.
Active investors / swing traders: Continue accumulating below $86,800 , with heavier accumulation around $78,370 .
Hope this study helps add context to current price action. Trade safe everyone, PEACE.
Dataanalysis

Why a Cluster of Puts at 1.32–1.33 Matters More Than You ThinkA concentrated block of PUT options has already formed at the 1.32–1.33 zone — across multiple expiry dates.
On their own, these puts don’t carry strong predictive power for price direction.
But they do tell us something important: market sentiment.
Why?
Because if price starts to correct downward, breaking through this put cluster will be tough.
These options could very well be part of a larger strategy — specifically, synthetic call positioning, where traders:
Buy futures
Combine them with long puts already have
The result? A synthetic long position that profits from upside after a dip.
So here’s what happens when price reaches 1.32–1.33:
👉 Traders with these structures may start aggressively buying futures to build up calls.
That inflow can trigger a pause, bounce — or even a full reversal upward.
📌 In short:
This zone isn’t just technical.
It’s a big plan.
It's happened before and it will happen again. The options market's possibilities are astounding and create opportunities to see "behind the scenes" even if you only trade spot or CFDs.

If You're Not Just Hearing About Options —But Actually Diving InYou’ve moved beyond indicators and noise.
You’re stepping into the world where smart money operates.
Because options are not just tools for betting.
They’re a mirror of institutional intent — of hedges, positioning, and hidden signals.
And if you learn to listen to this market, you gain a real edge — even if you never trade an option yourself.
You’ll see what’s coming on spot Forex, gold, or indices — before the crowd notices anything.
This isn’t theory from a textbook.
It’s a practical guide forged from over 5 years of daily analysis of CME reports, exchange data, and real-world observation.
Let’s break it down — step by step.
🔍 Step 1: Can You Identify the Player by Option Delta?
Yes — and it starts with understanding delta.
Delta = Sensitivity of an option’s price to changes in the underlying asset.
0.05–0.10 (5–10%) → Deep out-of-the-money (far OTM)
0.15–0.30 (15–30%) → Moderately OTM
~0.50 (50%) → At-the-money (ATM)
>0.50 → In-the-money (ITM)
Now — who trades what, and why?
0.05–0.10 ->Tail-risk hedgers, "lottery" traders
Protection against black swans or cheap speculative bets
0.10–0.20 ->Aggressive speculators, potential insiders
Betting on explosive moves — possibly with inside conviction
0.20–0.35 -> Regular speculators, funds
Expecting moderate rallies — balanced risk/reward
0.40–0.60 - >
Institutions, hedge funds
Portfolio hedging, delta-neutral strategies
>0.60
Arbitrageurs, hedgers
Deep ITM options as synthetic positions
⚠️ Important Nuance:
Delta is not absolute.
Large players may use deep OTM options — but not for speculation.
These could be tail-risk hedges (e.g., protection against crash scenarios).
🔮 Predictive Power Isn’t Just About the Trade — It’s About the Timing
The forecast value of an individual option increases dramatically when you ask:
When did this position appear — relative to price action?
✅ Before a move? → High predictive power
❌ After a big rally? → Likely FOMO or profit-taking
✅ On a pullback? → Could signal support/resistance
IMPORTANT! Timing turns noise into signal.
📌 To be continued in the next update…

Quiet in FX Options — But Gold Is Heating Up
Over the past 24 hours, major currency options saw little of interest.
In contrast, precious metals — especially Gold — are attracting serious attention.
Let’s break down the key developments:
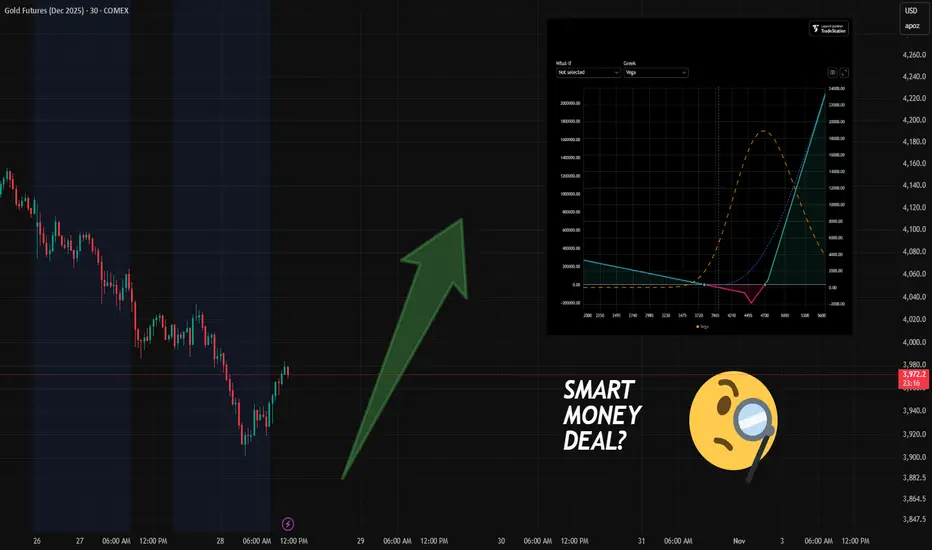
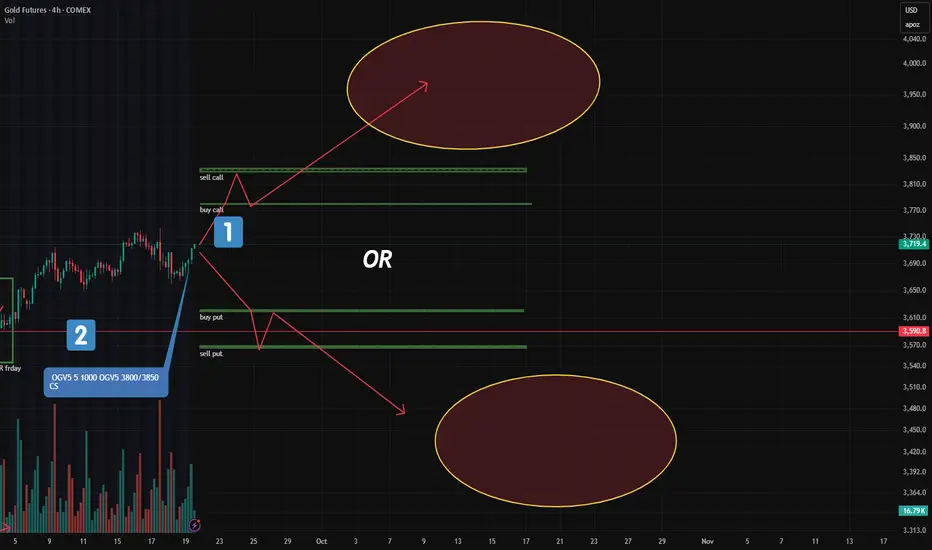
🔹 Observation #1: A New Bullish (But Hedged) Portfolio Appears
(See risk profile on screenshot.)
A new SMART option portfolio has entered the market:
Bullish bias, but with a built-in hedge — which reduces its predictive value.
If price drops below $3,800, the portfolio starts generating profit for its owner (via the hedge).
Built on the February 2025 futures contract, under an option series expiring in December 2025.
📌 Yes, it sounds confusing — and it is.
Option series expire, but futures live on.
This creates what we call "expiry risk" — a topic for another deep-dive article.
🔹 Observation #2: Put Activity at 3900 (Dec Series)
There’s growing activity in puts at the 3900 strike — moderate bullish positioning or support.
The bullish structure is hedged — not a pure directional bet.
Bearish positioning remains active.
Price has not yet shown signs of moving toward the main long setup.
I’d recommend at least 2–7 days of observation before considering any reversal trades.
📌 And here's why:
It’s rare for price to move immediately toward the target of a large, long-dated portfolio.
More often, there’s a delay of several days — especially when expiry is still far out.
Watch the flow.
Trade only when the edge is clear.
May the data-driven approach be with you!
BTCUSD Daily Structure — Liquidity Builds Inside the RangeBitcoin has sat inside a tight internal range for nearly two weeks — the question now isn’t where it breaks, but how traders position before it does.
⚙️ Context
BTCUSD continues to oscillate between 118.077 (range high) and 103.516 (range low) — the upper boundary of a broader bearish daily range.
Internally, price keeps printing higher lows, stacking short-term liquidity pockets beneath each new candle. Momentum remains contained,.
📈 Technical Map
Structurally, Bitcoin trades in a discount zone of this internal range.
Historically, this is where liquidity hunts often trigger — a short drive above prior highs before shifting lower again. Weekend trading brought a 2% move higher on light liquidity, hinting at early positioning ahead of the new week. For now, 109.758 remains the critical pivot. A daily close below it restores seller control; above it, liquidity still favors continuation higher.
🌐 Fundamental Pulse
Macro drivers remain centered on U.S. Dollar resilience, with traders eyeing upcoming economic data and Treasury supply dynamics.
The dollar’s tone this week could dictate whether Bitcoin’s range breaks with strength or simply reverts to mean.
Keep watch on yields, Fed commentary, and macro liquidity signals — subtle shifts there often precede technical confirmation here.
🧭 Plan
No prediction — only structure.
Maintain a range-based bias until a decisive daily close outside 118.0 or 103.5.
Execution focus: fade extremes, avoid middle noise.
🧘 Mindset
Professionals don’t chase breakout emotion — they measure compression, wait for resolution, and engage with precision.
Discipline isn’t boring; it’s profitable.
— CORE5DAN
Institutional Logic. Modern Technology. Real Freedom.

HOW-TO: Trade-o-Scope Plot Custom Data v2This is a short HOW-TO on using the Trade-o-Scope "Plot Custom Data v2" indicator

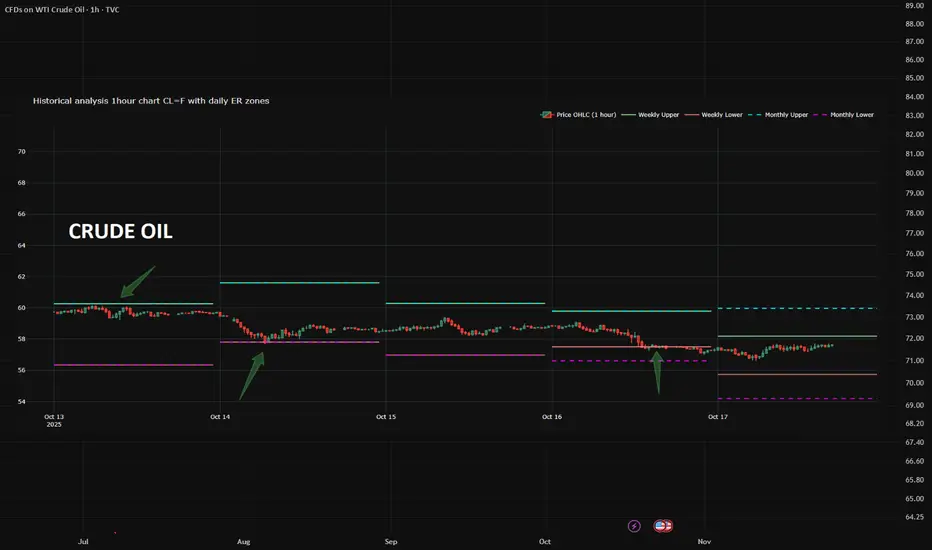
ER: The Hidden Tool 95% of Traders Ignore (But Shouldn’t)What if I told you there’s a free, stats-backed tool that shows you where price is likely to stop or reverse — with 68% confidence?
Meet Expected Range (ER) — not a magic bullet, but a massive edge when used right.
✅ Based on CME data & Nobel-winning math
✅ Defines high-probability support/resistance zones
✅ Free from CME website.
I never trade without checking ER anymore.
It turns noise into structure.
👉 Check the screenshots yourself — see how price reacted at each edge last week.
The only thing you need to do?
→ Grab ER data from the CME website daily
→ Apply a simple conversion formula
→ Plot it on your futures chart
That’s it.
Now you’ve got statistically grounded levels right in front of you.
Depending on your market view, you can:
• Short from the upper ER boundary
• Use it as a trend support entry zone
• Hide stops beyond the range — because price statistically won’t reach them
⚠️ Caveat: ER isn’t a crystal ball.
But in normal markets - ER zones hold ~4 out of 5 times.
Question for you:
Are you using ER? Or still guessing support/resistance?
Transparency first. No hype. Just real results.
DXY UpdateDXY — The Volume Cap: Where Momentum Meets Memory
Every market has memory — and in the Dollar Index, it’s sitting right at 97.4.
That’s the current Volume Cap — a zone where heavy participation once stopped price cold, leaving unfinished business behind.
Price loves to revisit these caps, testing whether the imbalance still holds or finally gives way.
⚙️ Context (4H | Friday Recap)
Friday delivered heavy volume and clean directional flow — a textbook session.
DXY continues to rotate within the 97.048–99.198 range, holding a short-term bullish tone inside a larger consolidation.
📊 Technical Map
• Structure: Long-term bearish range inside a broader consolidation phase.
• Momentum: Still bullish, but showing early fatigue.
• Volume Cap: The 97.4 level remains unfilled, acting like a magnet for potential retests — the true battleground between continuation and correction.
🌐 Fundamental Pulse
After a month of running hot, the dollar finally cooled.
Retail Sales and Industrial Production softened, yields eased, and traders started whispering “rate cuts” again.
The Fed’s cautious tone keeps volatility contained ahead of next week’s Core PCE inflation data.
🧭 Trade Plan (If/Then)
If DXY runs through 97.4, watch for a bearish Volume Cap flip — potential downside toward nearby support.
If Monday’s price action drives higher, expect bullish momentum rotation back toward the 97.0 retest region.

What Bitcoin Options on CME Are Whispering Right Now
A quick look at the flow — and it’s clear:
the market is pricing in a move toward $145K–$150K.
But here’s the nuance:
nearly all these call spreads come with a hedge — a short futures leg added right away.
This isn’t pure bullish speculation.
It’s a structured play.
🔍 The Logic Behind It:
Primary goal: Profit from upside as BTC rallies.
But also prepared for downside:
These portfolios assume a potential drop to $103K, and in some cases even $101K — which are the break-even points of the structures.
At those levels:
The short futures can be bought back for profit (closing the hedge)
Or the entire position can be closed out entirely, if sentiment shifts dramatically
In other words — they’re bullish, but not blind.
They want exposure to upside…
while keeping an exit ramp ready if things go south.

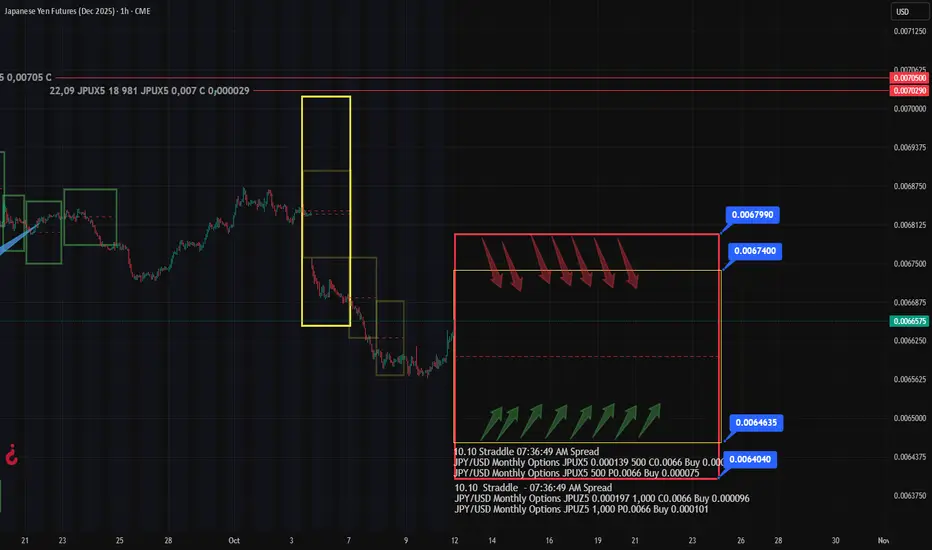
JPY Analysis & Outlook: Friday’s Options Flow Tells the StoryFriday’s trading on the options market revealed two key developments in JPY:
🔸 Two Straddles appeared in the current front-month expiry series
Plus a mid-sized Call Spread near 0.00675
Upper boundaries: 0.00674 and 0.006799 (marked on chart)
🔍 Key Takeaways:
Option traders are positioning likely for a correction in JPY futures after last week’s sharp drop.
But, Straddle isn’t a directional bet — it’s a volatility play with structure.
Call Spread is a a directional bet
As usual, when price approaches either Straddle boundary, option players will likely convert positions into synthetic calls or puts, reinforcing these levels as BE zones.
🎯 Strategic Levels:
0.00674 – 0.006799 → Potential resistance zone in the medium term
But here’s what’s interesting:
If you apply a Fibonacci retracement tool, the 61.8% level aligns almost perfectly with one of the already marked Straddle levels.
That kind of confluence?
It could attract additional downside liquidity from traders using Fib grids — especially those selling into "expected" reversal zones.
Is it a coincidence?
Sure, probably 😉
US Dollar RECAPDollar Index (DXY) — Range Heat Building
You’ve got a weekly bearish range, with a key high at 99.8 and price now trading into bearish distribution around 99.0.
The dollar’s been front and center this week — while Washington argues over funding, it’s been doing real damage across cross-asset charts.
Price has been printing higher lows all week, grinding inside this bearish range.
That’s your profit-taking zone, not an add-on zone.
Stay patient. Let the range speak.

BITCOIN IDEA
Bitcoin is still stuck in a sideways range.
KEY level bullish is at 122,300, and right now price isfilling orders near 121,183 daily cap.
That means we’re kind of in the middle — not super strong, not super weak.
The daily trend is still up, but price is pulling back a bit to fill orders.
If Bitcoin starts dropping, 118,543 is the next big level to watch.
If it holds and bounces, we might see another push higher.
If it breaks, we could fall deeper into that lower area.
The U.S. dollar is strong this week → makes it harder for BTC to move up.
Jack Dorsey (the Twitter guy) just dropped a new Bitcoin wallet — cool for long-term use.
So for now: stay patient, watch 121K and 118K zones, and don’t chase candles.

US DOLLAR TARGETS HITThe U.S. government is still shut down, so no fresh economic data is coming out. That means everyone’s trading half-blind right now—no jobs numbers, no inflation updates, just noise. But the chart still tells the truth. All the bullish dollar targets were hit exactly as planned, and now price is sitting right under that 99.8 key high. That’s the line that decides everything. If market makers push price higher than 99.8, the bullish phase stays alive a bit longer. If it fails there, we drop back into bearish discount territory, where value sits lower and sellers regain control.
Over the past four months, liquidity’s been building above those highs. Now we’re watching a classic stop run—price pushing up to take out weak hands before the real move begins. That’s why cross markets like stocks, gold, and crypto are slipping. The dollar’s acting as a safe spot while everything else bleeds. But the volume looks thin, which usually means manipulation, not genuine demand.
Without the usual USD data, it’s all a guessing game until the Fed minutes drop later today. For now, it’s simple: the 99.8 zone is the make-or-break level. Stay patient, read the structure, and let the chart talk. Price always moves to where orders are missing, and stops where they’re full. Follow that rule, and you’ll never feel lost in the noise.

EUR USD and DOLLAR UPDATE
The Dollar Index (DXY) is grinding through a daily order block and has just pierced 97.882.
Technical
If we close above 97.882, that confirms a break and opens continuation toward higher liquidity zones. With tomorrow’s heavy macro news, the setup has volume behind it for a potential massive move.
Macros
U.S. government shutdown is weighing on confidence and trimming growth forecasts (each week may shave 0.1–0.2pp off GDP).
The Fed remains cornered — markets price in rate cuts, but policy credibility is under scrutiny.
Safe-haven flows are mixed: gold at records, dollar stabilizing after Supreme Court support for Fed’s Cook.
Data releases are being delayed by the shutdown, which adds uncertainty and volatility.
EURUSD
We’re short and holding.
4-month rangebound structure remains
Be aware
Dollar strength is being fueled by technical break + macro volume. EURUSD is vulnerable if DXY confirms above 97.882.
But with policy risk and shutdown uncertainty, expect volatility spikes and liquidity hunts around tomorrow’s big data.

Gold Options Check-In: Are the Big Players Cashing Out?A quick look at the latest CME options data for Gold shows some interesting signals. It looks like the bulls might be getting tired.
The Big Signal: We're seeing big trading volume, but the number of actual open positions (Open Interest) has barely changed.
Calls: 27,274 contracts traded, but only +2,933 new positions were opened.
What this means: This isn't new money flooding in. It's big players shuffling their decks and taking chips off the table.
What's happening with Calls? 🔼
Traders are closing out their winning bets on strikes like $3850, $3800, and
4000
The Takeaway 🎯
The market sentiment is shifting from bullish to neutral & defensive. Big players are:
Cashing out their profits on call options.
This kind of activity is a sign that an uptrend could be running out of steam.
However, another leg up for gold is still possible. The argument for this scenario is the presence of a futures hedge within many of PUT spread portfolios. The logic works like this: if the asset's price continues to rise, profits are taken on the futures leg, and the position is closed. This profit can then make the put spread a breakeven trade, essentially providing downside protection for free, even if the price keeps rallying.
As for me, main bias: short at upper ER (if you're unfamiliar with the ER concept, check out my profile for a detailed post on Expected Range).)
Entry on touch. Risk kept small.
US Dollar Flexes, Look For on 99.05Sunday War Map –
A weekly candle this strong leaves a mark. The dollar printed a 96.77 low to 98.18 high—a full-bodied bullish bar that demands respect.
Macro
This week is stacked with U.S. data that can shake the pullback narrative:
Tue 30 Sep – JOLTS & Consumer Confidence: first look at hiring demand and household mood.
Wed 1 Oct – ISM Manufacturing PMI: factory pulse and price pressures.
Thu 2 Oct – Durable Goods & Trade Data: capital-expenditure clues.
Fri 3 Oct – Non-Farm Payrolls & Hourly Earnings: the heavyweight. A hot jobs print could delay the December Fed-cut story (futures still price ~70% odds).
Technical Targets
Expect an early-week pullback as traders digest that massive weekly bar.
Two liquidity pools we’ve tracked for months were cleared last week; two upside targets still in play 98.2 and 98.3 remain before the chart reaches a true “bearish-range discount.”
Keep eyes on the 99.05 volume node—a well-defined supply zone where cross-market reactions (EUR, gold, crypto) could spike.
The dollar controls the tempo. Wait for the market to come to your levels; don’t chase the last candle.

Powell Flags Rich Valuations as Dollar Holds the High GroundOur plan from last month is unfolding: weekly liquidity pockets around 97–98 on the DXY have now been tapped, with first profit targets reached on several cross pairs.
Technically, we see:
EUR/USD divergence – euro pushed into absorption while the dollar closed higher.
Heavy weekly liquidity – price action continues to respect the upper band near 98.
From the macro side, Fed Chair Jerome Powell added a quiet but important layer.
In his latest speech, he noted that U.S. equities appear “fairly highly valued,” a gentle reminder that financial conditions matter and valuations are stretched.
He balanced that with a steady-hand message on policy, but the hint was clear: risk assets are not priced for perfection.

EUR/USD Technical UpdateEURUSD rejected the 1.1742 monthly high, slipping back into mid-range. Price now sits between well-defined highs and lows, and the next daily close outside this range should set the directional tone for the week.
No need to predict—this is a pure breakout watch.
• Close above the upper band = momentum bias higher.
• Close below the lower band = momentum bias lower.
Until that daily candle settles, stay patient and let the market reveal the winner.

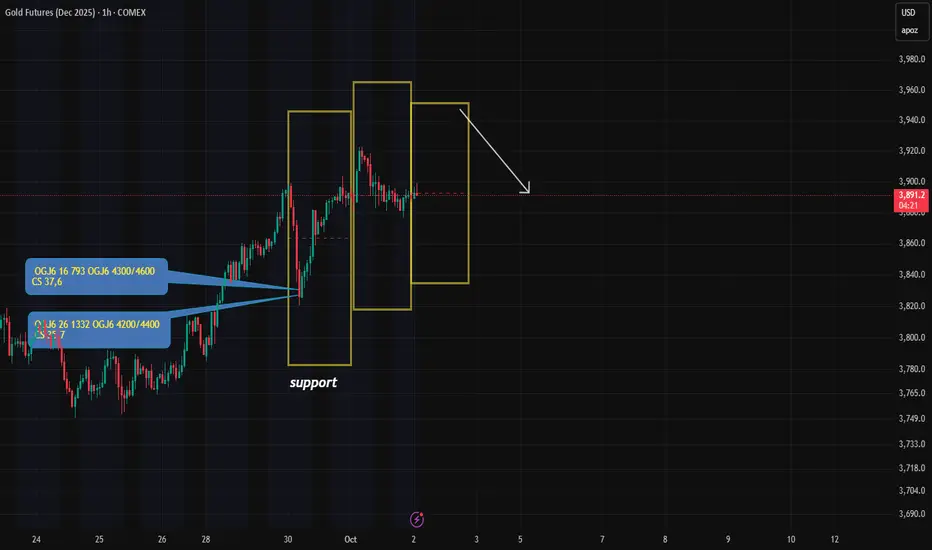
Gold: Major New Option Portfolios Signal Strong Moves AheadFriday’s CME report showed a surge in large option blocks in gold — two of them stand out.
🔹 1. "Long Condor" on December Futures (GCZ24)
This is the most significant structure added:
Targets a move below $3,620 or above $3,780
In other words: a breakout is expected, not consolidation
📌 Key point:
A "Long Condor" profits from volatility, not direction.
It wins if price moves sharply — up OR down — but loses if it stays flat.
💡 My note:
When I first encountered delta-neutral strategies like this as a Forex trader — my brain exploded.
No directional bias… yet clearly positioned for action?
That was the moment I realized: options are a different game.
🔹 2. Bull Call Spread (Oct Series): $3800–$3850
Another key play:
A classic bullish call spread at 3800/3850
Target: upside beyond current levels
But here’s the difference:
Unlike the "Long Condor", this one needs a clear upward move — and soon. Within a few days.
This isn’t about volatility.
It’s a directional bet that gold will rise.
🧠 Bottom Line:
One portfolio says: "Breakout coming — no matter which way."
Another says: "Gold goes up — and soon."
Are they aligned?
Contradictory?
Or could both win?
Trade smarter, not harder! Looking to boost your profits with valuable market insights and data-driven entry points? Join us or keep moving!
Bitcoin vs. Dollar – AFTER-FOMC CheckBTC holding firm while DXY chops.
🎯 117,416 target tagged overnight.
Next magnet sits near 118,626 if market makers keep grinding.
Overnight action printed a volume discount zone—I missed that fill and won’t chase.
I’m simply trailing yesterday’s entry, no new adds.
Red zone above is weekly bearish distribution, so after a 15-hour trading day yesterday it’s time to let the market work.
BTCUSD – Liquidity Sweep & Weekend Fractals
Key Levels
• Major liquidity pocket tagged at 117,898.79.
• After that sweep, price printed a string of bearish fractals.
• Market makers are now likely eyeing the cluster of minor fractals at 117.4k, 118.6k, and 119.3k.
Trade Recap
All our targets were reached over the weekend.
I’m flat now, but in hindsight a trailed stop would have captured more of the move as price kept running.
Plan Forward
Watching how price reacts around the 118k–119k zone for clues on the next leg.
A decisive rejection here could open a deeper retrace; sustained acceptance sets up a fresh structure.
Not financial advice—pure market structure analysis using the CORE 5 lens.

BTCUSD Eyes 116,833 While Dollar Flexes Pre-NewsGood morning traders—
Bitcoin is pressing toward 116,833.25 while the U.S. Dollar Index grinds into a fresh bullish range ahead of key U.S. data.
Notably, there’s a major volume node near 11,861. We could see price hover or even dip into that pocket on the headline drop before any attempt at the higher target. Classic market-maker mind games: build liquidity, shake stops, then decide the real direction.
Macro backdrop
U.S. CPI tomorrow keeps rate-cut odds alive.
Treasury yields firm, adding fuel to the dollar bid.
Equity futures soft, hinting at defensive flows.
Plan
Keep stops tight and trailing, only ride trades backed by strong volume.
Patience until post-news—let the data show the hand before sizing up.
Stay nimble and let the market makers reveal their move. Happy trading.

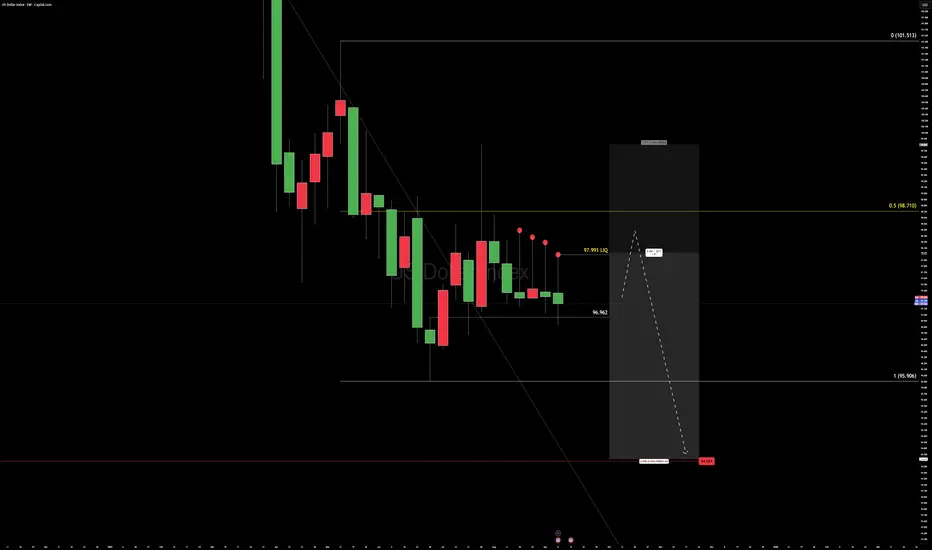
Pre-FOMC Crossfire US DOLLAR INDEXPre-FOMC Dollar War Map
The weekly chart just printed a fourth straight lower high—
a slow grind down while Friday’s close stayed red.
Liquidity is stacked behind us, perfect fuel if the desks want to run stops before the Fed.
Order flow shows massive resting bids around 96.962, the last structural block.
If that line cracks, expect the move to be fast and brutal.
Cross-markets are whispering the opposite:
equities, metals, and crypto are coiled to run if the dollar slips.
The headlines will call it a surprise.
It isn’t. The map was drawn weeks ago.
Focus on levels, not noise.
Trade the reaction, not the prediction.