moving avreage 200 & fib div & ichimokuHello friends
An analysis new
P.S. as I don't use like-bots and other solutions that show great "interest" to my posts, I will be grateful if you support my work by your LIKEs and comment. Of course, if you can do it. The feedback from REAL people is priceless!
Disclaimer!
This post does not provide financial advice. It is for educational purposes only! You can use the information from the post to make your own trading plan for the market. But you must do your own research and use it as the priority. Trading is risky, and it is not suitable for everyone. Only you can be responsible for your trading.
DATABTC
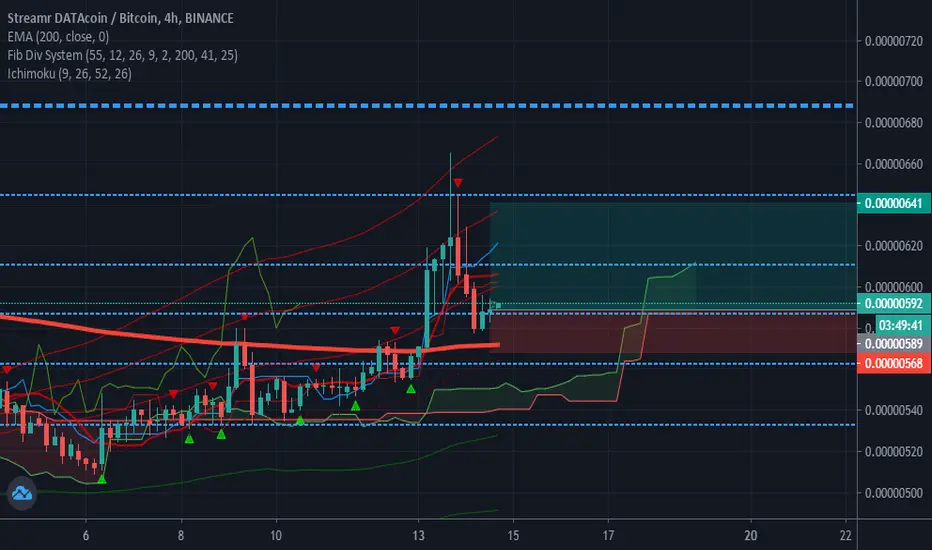

Fibonacci reform in the region 55 to 65%Fibonacci reform in the region 55 to 65%
Failure to break the 200-weight moving average by price upwards
High price of conversion line
High price base line
P.S. as I don't use like-bots and other solutions that show great "interest" to my posts, I will be grateful if you support my work by your LIKEs and comment. Of course, if you can do it. The feedback from REAL people is priceless!
Disclaimer!
This post does not provide financial advice. It is for educational purposes only! You can use the information from the post to make your own trading plan for the market. But you must do your own research and use it as the priority. Trading is risky, and it is not suitable for everyone. Only you can be responsible for your trading.
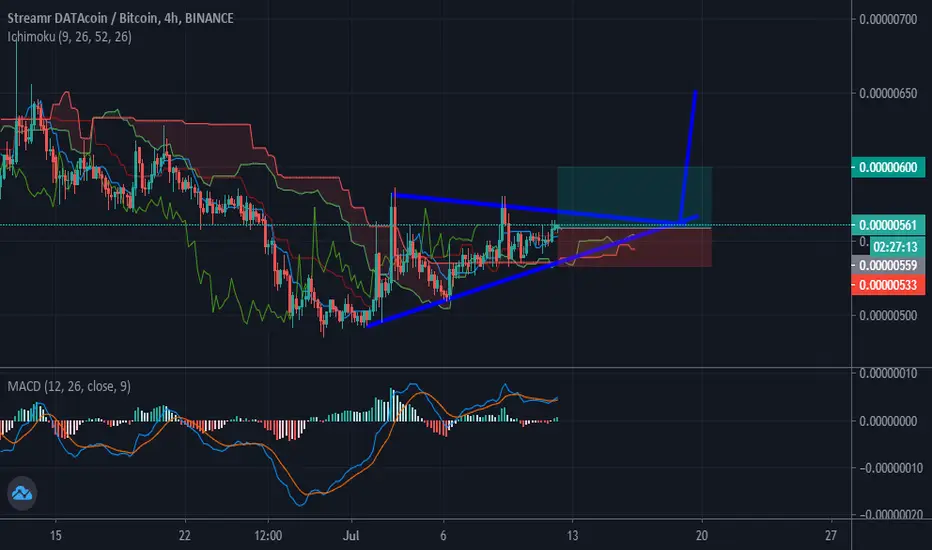
Ready to an other leg outNice hold on major support and RSI at the bottom of the range. So RSI in Daily TF formed the bullish divergence with price.
The entry and close points suggested on the chart.


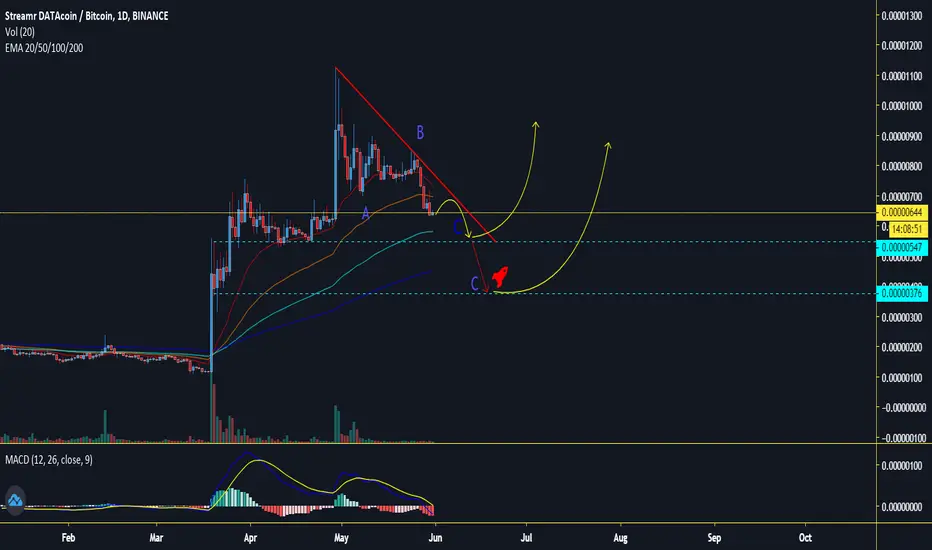
Is the accumulation phase over? Will history repeat itself?Just a thought.
This is not a financial advice.
Trade at your own risk.


#DATA/BTC (June 03)After increasing sharply from 100sts to 1100sts, DATA is now turning to a downtrend and of course holding DATA in this period is not a good idea.
DATA has a very strong resistance zone of 700-750sts and I think DATA will form a Head & Shoulders pattern in June and fall off 528sts to hit the support area of 400-425sts


What Will Streamr DATAcoin Go Next?Here is another altcoin that has a unique chart, Streamr DATAcoin (DATABTC).
First we saw the massive bullish action on the 25-Nov '19, maybe a whale or group buying, surely a signal of a new change of trend.
After a long and strong correction, DATABTC started to move again in March 2020, a new uptrend has formed.
Last April we saw the last peak and since then the strength of the chart still exists.
Streamr DATAcoin Signals List
Prices remain trading above EMA10.
The classic retrace has been solid and strong (prices remain above EMA10/EMA50).
And we have a continuation pattern.
Bullish MACD and RSI.
Here the bulls can have the upper hand.
The main support is sitting at EMA50 (0.00000699).
This is an important level if prices drop.
Below this level we turn bearish short-term.
Above this level we remain strongly bullish.
This is not financial advice.
This is not a trade, you should do your own research and have your plan/strategy if you decide to trade.
Namaste.

DATA Looking For Another BreakoutHey guys, i hope everyone is doing great. In this TA DATA looks extremely bullish and could possibly break to upside and we could expect huge gains this time too.
Keeping tracking DATA and have a nice weekend

DATA big flagIf DATA Streamr breaks up the flag, we may spect a big movement.
Strong support at 720 sats.
Entry: 900

DATABTC LONGData is retracted back to its support. Let's see how price reacts this level.
Not a financial advice.

The Crazy Volatility Coin: Data. Preparing For Another Pump?DATA. Always pumping, sometimes dumping. We've seen such crazy volatility on this coin since it's listing. The price settled for a while, increased by 500% by the end of March and now seems to prepare for another pump. Don't try to go for 500% returns, and follow the example here for a casual 16% for instance :).
Follow me for consistent high quality updates, with clear explanations and charts.
Please like this post to support me.
- Trading Guru
--------------------------------------------------------------
Disclaimer!
This post does not provide financial advice. It is for educational purposes only!

DATA/BTC (Failed Breakout? Back to Key Support?)DATA/BTC
-failed to hold immediate support at 815s
-the price is will look down at next key support
-stong support is based before breakout at 670s
-if the DATA hits key areas, we could expect some bounce
-the market review is blow off the top on the 4H chart

data/btc resistance levelsKey resistance and support levels indicated. 0.00000868 long to 0.00001085, nice 25% gain

Streamr DATAcoin Fib. Support & Resistance Levels MappedStreamr DATAcoin (DATABTC) was one of the first altcoin pairs to move strong and print over 1,300% in growth back in November 2019.
After a retrace and almost 4 months of consolidation, DATABTC has gone bullish once more.
On the chart above, you can find the Fib. resistance and support levels for DATABTC.
Looking at how this chart is developing, DATABTC can enter a sustained uptrend.
This is not financial advice.
Thanks a lot for your support.
Namaste.
