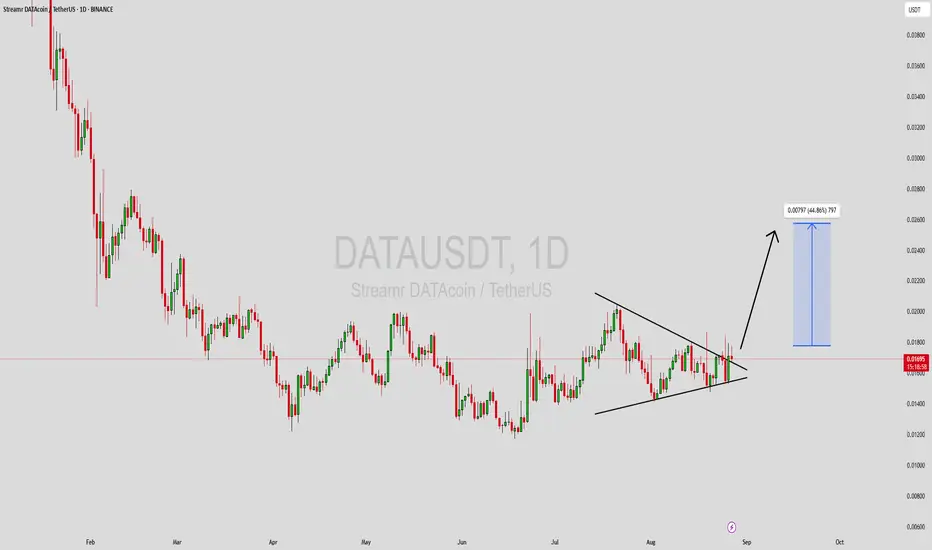
DATAUSDT Forming Descending TriangleDATAUSDT is currently trading within a descending triangle pattern, a structure that often signals a decisive breakout move once the price reaches the apex. While descending triangles are sometimes considered bearish, in this case, the strong buying interest and healthy volume profile suggest the possibility of a bullish breakout. The repeated testing of the horizontal support level is showing that buyers are defending key zones, preparing for a potential upward reversal.
The volume is aligning with the structure, showing increased market activity as price consolidates. A breakout above resistance could quickly accelerate momentum, paving the way for a potential 30% to 40% gain in the short to medium term. This makes DATAUSDT an attractive pair for traders watching for continuation patterns and accumulation signals.
Investors are steadily taking interest in this project, as market sentiment strengthens around the possibility of growth in both adoption and price action. If the breakout is confirmed, DATAUSDT could capture significant attention, leading to further inflows of capital and price appreciation. Traders should keep a close eye on resistance levels, as a successful breakout may trigger a strong wave of bullish momentum.
✅ Show your support by hitting the like button and
✅ Leaving a comment below! (What is You opinion about this Coin)
Your feedback and engagement keep me inspired to share more insightful market analysis with you!
DATAUSDT
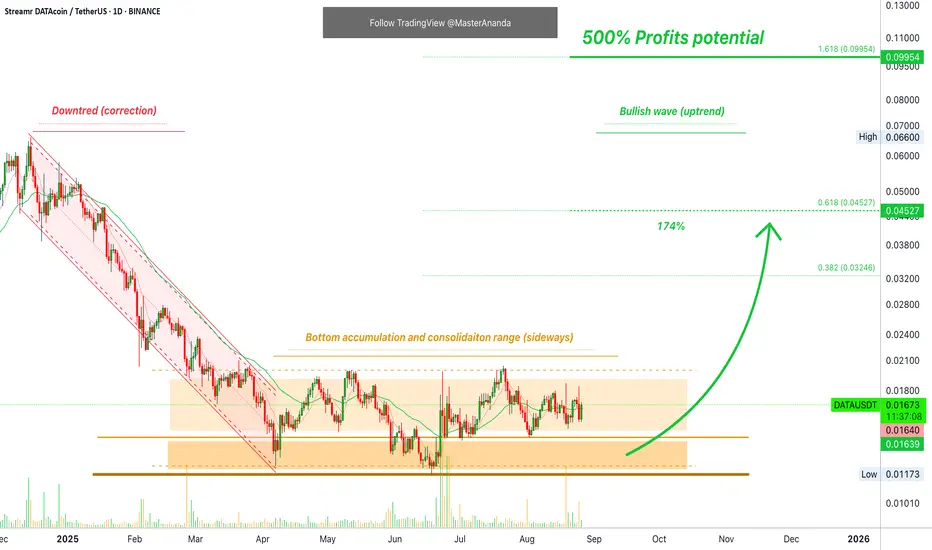
Streamr DATAcoin Goes Forward With 500% Profits Potential, Easy!Easy and mid-term, within 3 months.
Good morning my fellow Cryptocurrency trader, I hope you are having a wonderful day.
We can look at the same pairs over and over, it makes it easier to trade. Or, we can look at new pairs and new charts. Endless opportunities this market has to offer.
The good thing about trading the same pair is that you can get the jump and the drop if your entry, exit and timing are right.
We get to buy at support and hold. We get to sell at resistance when prices go up. If resistance is good and strong, since we already sold it is possible to go SHORT. You sold because prices are dropping correct?
The game becomes more advanced the more we trade.
DATAUSDT (Streamr DATACoin) has been moving within a sideways channel and also within a long-term accumulation zone. Most of the year, since March, DATAUSDT has been trading low within the "opportunity buy zone." The best time to buy before prices go up.
Action today is moving above EMA8 and EMA34.
We still have a higher low vs early August and mid-June. Market conditions continue to improve.
The first target shows 174%, more or less. The way to approach this target depends on your strategy. You can sell a small portion at this level, say 10-20%, or it can be ignored. Some people can decide to close an entire position after a big and nice double-up, others continue to hold.
Another way which is very common for passive traders, huge/high profits but only simple and waiting, is to wait for higher targets. Track the market, follow the market and spot when prices are low. Take advantage of the buy zone and hold. In this scenario, we simply wait for ~500%, collect profits and move on. The choice is yours.
I am not sharing financial advice. All the information is my experience only, opinions and translation of the charts. As an adult, you are responsible for your own actions and their results. You do the deposits, the clicking, the choices, the amounts, the transactions. You collect the profits, you also keep the loss. It is all yours.
If I win, all profits are mine to keep.
If I lose, it is my loss.
There is no blaming others for our blunders. To win big, win fast, win more and continue to win long-term, we have to take responsibility for our actions. We have to learn from our mistakes.
Thank you for reading.
Namaste.
#DATA (SPOT) BINANCE:DATAUSDT
#DATA/ USDT
Entry range (0.01500- 0.01600)
SL 4H close below 0.00.01498
T1 0.0180
T1 0.0198
_______________________________________________________
Golden Advices.
********************
* collect the coin slowly in the entry range.
* Please calculate your losses before the entry.
* Do not enter any trade you find it not suitable for you.
* No FOMO - No Rush , it is a long journey.

DATAUSDT Forming Bullish WedgeDATAUSDT is currently forming a bullish falling wedge pattern, a classic technical setup that often precedes a significant price breakout. After a sustained downtrend, the price appears to be consolidating within the wedge boundaries, tightening as it moves closer to a potential breakout point. This kind of structure typically indicates a loss of bearish momentum and growing accumulation, especially when supported by rising volume as seen here. Traders familiar with technical analysis recognize this as a signal of a possible reversal to the upside.
The volume profile for DATAUSDT is showing healthy growth, which adds conviction to the bullish case. Increased investor participation during the late stage of the wedge pattern reflects growing interest and potential for a strong upward push. Once price breaks above the upper resistance line of the wedge, we could see an explosive rally with a projected gain of 70% to 80%+ from the current levels. The measured move target aligns well with previous resistance zones, making this setup technically and psychologically significant for swing traders and investors alike.
Momentum indicators across various timeframes are also aligning in favor of a bullish move. RSI and MACD are showing early signs of positive divergence, hinting at a buildup of buying pressure. As the crypto market starts to regain broader strength, coins like DATAUSDT—still in early stages of breakout—tend to offer better risk-to-reward ratios. This makes it an ideal candidate for traders watching for breakout retests and continuation patterns.
Given the current technical setup and the renewed attention this project is attracting, DATAUSDT has strong potential to lead the next leg of altcoin momentum. Keep an eye on the breakout confirmation and volume spikes, as these will likely be key signals for the start of a bullish trend continuation.
✅ Show your support by hitting the like button and
✅ Leaving a comment below! (What is You opinion about this Coin)
Your feedback and engagement keep me inspired to share more insightful market analysis with you!

Streamr Confirms Altcoins Market Continues BullishThis is the altcoins market bullish confirmed. The bottom happened 7-April 2025. This week we have a higher low; period.
This higher low confirms what I've been saying that we are bullish. Now, Streamr is a classic pair, and thus it has a classic chart and many other projects move in the exact same way. So you can know what many are doing and will be doing by looking at this chart.
The bottom came in April and now we have a higher low. This higher low is a retrace from the initial bullish breakout. From this higher low we will get very strong, sustained long-term growth. We are talking about months of bullish action. Can be 3-6 months.
Spot traders can continue to accumulate (buy and hold). The current retrace is an opportunity to buy-in, buy more, rebuy and reload at the best possible prices before the 2025 high-bullish momentum bull market.
I will keep it simple as this chart is meant to show that the bullish potential, bias and chart structure cannot be broken unless we get lower lows.
Even if the 7-April low is challenged, we know this is a stop-loss hunt event because a new low would require the extension of the previous low rather than the same level being tested.
Anyway, we are going up and this growth will happen long-term. Think June, July, August, September, October, November... And on and on.
Thank you for reading.
If you enjoy the content, you can follow for more.
Namaste.

DATAUSDT 1WDATA ~ 1W Analysis
#DATA This is the lowest support block for now. Buy gradually from here with a minimum target of 20%+

DATAUSDT 1WDATA ~ 1W
#DATA So far it still maintains this support block,. If you still have Conviction on this coin,. Buy from here with a minimum target of 20%+

#DATA/USDT Ready to go up#DATA
The price is moving in a descending channel on a 1-day frame and sticking to it well
We have a bounce from the lower limit of the descending channel, this support is at a price of 0.03066
We have an upward trend, the RSI indicator is about to break, which supports the rise
We have a trend to stabilize above the 100 moving average
Entry price 0.04040
First target 0.04541
Second target 0.05020
Third target 0.05735

Alikze »» DATA | Pullback to the descending channel is brokenIn the weekly time, with the failure of the sub-swing and the exit from the descending channel, if the pullback to the green box area or completes the main swing, it will have the ability to grow up to the specified supply area. Otherwise, this correction may continue until the sub-swing area
🟩Sup:0.048
⛳️Tp Red Box
»»»«««»»»«««»»»«««
Please support this idea with a LIKE and COMMENT if you find it useful and Click "Follow" on our profile if you'd like these trade ideas delivered straight to your email in the future.
Thanks for your continued support.
Sincerely.❤️

DATAUSDT 1WDATA ~ 1W
#DATA it is currently at a good enough support block to start buying again. If you have Conviction on this coin,. Maybe it's time to buy in gradually on this support block,. Minimum target 20%+

#DATA (SPOT) entry range( 0.03400- 0.0427) T.(0.0643) SL(0.0330)BINANCE:DATAUSDT
entry range ( 0.03400- 0.0427)
Target1 (0.0643)
2 Extra Targets(optional) in chart, if you like to continue in the trade with making stoploss very high.
SL .1D close below (0.0330)
1:2 Trade
**** #Manta ,#OMNI, #DYM, #AI, #IO, #XAI , #ACE #NFP #RAD #WLD #ORDI #BLUR #SUI #Voxel #AEVO #VITE #APE #RDNT #FLUX #NMR #VANRY #TRB #HBAR #DGB #XEC #ERN #ALT #IO #ACA #HIVE #ASTR #ARDR #PIXEL #LTO #AERGO #SCRT #ATA #HOOK #FLOW #KSM #HFT #MINA #DATA****

DATA/USDT is on the verge of a big breakout!🚀 DATA/USDT is on the verge of a big breakout! 🚀
The DATA/USDT trading pair is showing strong potential for a breakout as it approaches a key resistance level. 📈 If it successfully breaks above this point, it could trigger a significant bullish rally, pushing prices higher. 🔥
💡 Here’s what to watch for:
- Key resistance levels: A breakout above this resistance could signal the start of a new bullish trend, setting the stage for substantial gains. 🚀
- Trading volume: Watch for an increase in buying volume, which could indicate growing market interest and a stronger likelihood of a breakout. 📊
- Market sentiment: Broader market trends could impact the strength and sustainability of the breakout, so keep an eye on the bigger picture. 🏦
👀 Stay alert: This setup could present a promising opportunity for traders looking to ride a strong upward move. However, remember to trade cautiously and manage your risk effectively. 🧐
⚠️ Disclaimer: This is not financial advice. Always do your own research (DYOR) before making any investment decisions.


DATA Technical Analysis in a Weekly TimeframeHello everyone, I’m Cryptorphic.
For the past seven years, I’ve been sharing insightful charts and analysis.
Follow me for:
~ Unbiased analyses on trending altcoins.
~ Identifying altcoins with 10x-50x potential.
~ Futures trade setups.
~ Daily updates on Bitcoin and Ethereum.
~ High time frame (HTF) market bottom and top calls.
~ Short-term market movements.
~ Charts supported by critical fundamentals.
Now, let’s dive into this chart analysis:
DATA is in a bearish trend and close to its all-time low of $0.02010. It will likely reach a new all-time low if the decline continues.
A rebound can be expected from the lower support trendline at $0.0157. The RSI is close to the oversold zone, indicating a further downtrend followed by a potential rebound toward the resistance trendline.
Key levels:
- All-time low: $0.02010.
- Lower support: $0.0157.
- Accumulation range: $0.0157-$0.02010.
- Mid-term Target: 2x-3x gain.
- Long-term Target: 10x-15x.
DYOR, NFA.
Please hit the like button to support my content and share your thoughts in the comment section. Feel free to request any chart analysis you’d like to see!
Thank you!
#PEACE

#DATA/USDT#DATA
The price is moving in a bearish channel on the 4-hour frame and is adhering to it to a large extent
The price rebounded well from the green support area at the support level of 0.04700, which is a strong level
We have a trend to hold above the Moving Average 100, which is strong support for the rise
We have very strong oversold saturation on the RSI indicator to support the rise, with a downtrend about to break higher
Entry price is 0.0500
The first target is 0.0575
The second target is 0.06260
The third goal is 0.07000

DATA ANALYSIS🚀#DATA Analysis : What Next ??💲💲
✅As we can see that there was a formation of Descending Triangle Pattern in #DATA and given a breakout and perfectly retest the support zone. We are expecting around more than 100% bullish move in coming weeks 📈📈
🔰Current Price: $0.05345
🎯 Target Price: $0.07869
⚡️What to do ?
👀Keep an eye on #DATA price action. We can trade according to the chart and make some profits. Stay tuned for further analysis and stay updated with market sentiments and news.⚡️⚡️
#DATA #Cryptocurrency #TechnicalAnalysis #DYOR

DATAUSDT.2HThe chart you've provided is for Streamr DATAcoin (DATA) traded against Tether (USDT) on a 2-hour time frame. Let's dive into the technical analysis:
Ichimoku Cloud: The price action is within the Ichimoku Cloud, suggesting indecision in the market. A breakout above the cloud could indicate a bullish trend, whereas a drop below might signal a bearish phase.
Resistance Levels (R1, R2): There are resistance levels marked on the chart. R1 is not too far above the current price, indicating that it may act as a near-term barrier for price appreciation.
Support Level (S1): The support level is quite a bit below the current price. If this level is breached, it could signal further bearish sentiment, potentially leading to larger price declines.
RSI (Relative Strength Index): The RSI is just above 40, which is on the lower end of the neutral zone. This could indicate slight bearish momentum or potentially a consolidation phase.
MACD (Moving Average Convergence Divergence): The MACD line is below the signal line and the histogram is negative, both of which suggest bearish momentum. It would be prudent to watch for any potential crossover above the signal line for signs of a changing trend.
Volume: There isn't a visible volume indicator on this chart, which would help to confirm the strength behind any price moves.
Conclusion:
Based on the current chart, it seems that DATA/USDT is in a phase of uncertainty, with the price moving within the Ichimoku Cloud. The market appears to be waiting for a catalyst to determine direction. The bearish bias in both RSI and MACD suggests that caution is warranted. A breakout above the cloud and resistance levels, accompanied by increased volume, could be a bullish signal. Conversely, a break below the support level could lead to further declines. As always, it’s important to consider multiple indicators and market factors and to manage risk carefully when trading.

DATA/USDT @STREAMRHi my friends
Are you ready for a gem?
This is a minimum 5x in this bull run
Buy fast and hold it
Short term target: $0.17
Long-term Target: $0.5 $1

[DATAUSDT] - Must get bullish in few next days🔥🔸there is a parabolic curve in 3 days chart making a confluence point with red resistance and broadening triangle pattern.
🔸key level must broken for buying
🔸incase of breakout expecting 150% profit
dont forget to support us with ur like, comment and follow for more ideas🎯
DLong

DATAUSDT.1DBased on the given market data for the currency DATA, the current price is 0.066 USDT. The Relative Strength Index (RSI) is a momentum oscillator that measures the speed and change of price movements. An RSI of 30 or less is commonly interpreted as indicating an oversold or undervalued condition that may signal a trend change or corrective price reversal to the upside. Conversely, an RSI of 70 or more is commonly interpreted as indicating an overbought or overvalued condition that may signal a trend change or corrective price reversal to the downside.
In this case, the RSI for 4 hours is 48.58, which suggests that it is neither overbought nor oversold. For a 1-day timeframe, the RSI is 71.67, indicating a slightly overbought condition. This could suggest a possible price correction in the near term. The 7-day RSI is 80.84, further suggesting an overbought condition, hence a possible price correction in the longer term.
The Moving Average Convergence Divergence (MACD) is a trend-following momentum indicator that shows the relationship between two moving averages of a security’s price. The MACD for 4 hours, 1 day and 7 days are 0.00122, 0.0049, and 0.0093 respectively. The positive MACD indicates that the price is on an uptrend.
The Bollinger Bands (BB) are 0.074 for 4 hours, 1 day, and 7 days. This indicates that the price volatility for DATA is relatively low, as the Bollinger Bands are quite narrow.
The support levels for 4 hours, 1 day and 7 days are 0.061, 0.061, and 0.054 respectively, while the resistance levels are 0.076, 0.079, and 0.100 respectively. These levels indicate the price levels at which the currency will likely meet resistance or support.
In my opinion, the currency is currently slightly overbought, and there may be a price correction in the near term. However, the positive MACD suggests that the price is on an uptrend. Therefore, it might be a good idea to observe the market for a potential price correction before making a decision to buy or sell. As always, one should consider other market factors and indicators before making a decision. It is also advisable to consider one's risk tolerance and investment objectives. This analysis is for informational purposes only and should not be considered as financial advice.

DATABTC DATAUSDTDATA streamr has a big potential to explode in 2024
Buy now and wait, I think X6-X10 is worth the investment
DLong

DATAUSD - Long ScenarioOTE Level about to be mitigated after a recent BoS on the 1H Time Frame.
Also we are consolidating on an Intra-Day Trend, which would be gathering Liquidity.
