DAX LONG!The DAX (Deutscher Aktienindex (German stock index)) is a blue chip stock market index consisting of the 30 major German companies trading on the Frankfurt Stock Exchange. Prices are taken from the Xetra trading venue. According to Deutsche Börse, the operator of Xetra, DAX measures the performance of the Prime Standard’s 30 largest German companies in terms of order book volume and market capitalization. It is the equivalent of the FT 30 and the Dow Jones Industrial Average, and because of its small selection it does not necessarily represent the vitality of the economy as whole.
Dax30long

DAX - Breakout of the bearish channel or short below 11050?Since October 8th, the DAX has lost close to 1000 points.
This graphic offers a technical framework on the bear trend and shows that the DAX moves into a bearish parallel channel which has been tested several times.
We can also notice that prices have reacted on 11050 points.
In my case, before to take a swing position on DAX, I am waiting for :
-A breakout by the top of the bearish channel to open a long position
or
-Prices move below 11050 to short the DAX

Dax is going to correct the downtrendWe can see a clear Wolfe wave pattern at DAX index. Also we can see a divergence on all indicators especially on MACD, that confirms that pattern.
Now the "price" located at the sweet zone and we have a Short term opportunity:
To take some profit => open a LONG position with 2 targets:
1. ±11350 points
2. ±11750 points
I will update this idea
Good luck!

DAX (GER30) Bullish Setup#DAX (GER30), bullish divergence formed. good entry point is 11490, sl below the low of October 11380, secure sl is 11250, Dax is on seasonal low. longer term view is bullish for targets 11970, 12100 & 12300


DAX German 30 Long PositionPrice has broken to the upside and formed a re-test of the previous resistance line.
Sellers were not able to keep price in the channel, which suggests we can see another push higher.
I have split the trade into three target take profits, all representing previous highs.

DAX Playing out well as predicted.DAX
The German Index has been playing out well as predicted in our membership forum.
We should be expecting a slight retrace and then a continuation for price to reach our take profit.
Risk averse traders can move their stop losses to break even.


DAX long term Elliott wave analysisHere's my count on DAX, we are in the c leg of wave 4 in a bigger cycle wave 5. Below 11740 points should begins the last impulse that if similar to big wave 1 started in 2003 will bring this index to 14500 points area. At that level we could have a big correction down to 8700 area at the end of big cycle wave 4.

DAX Elliott Wave Analysis: Bounce Can Be TemporaryHello Traders,
In this short-term analysis, we will have a look at the German DAX Index.
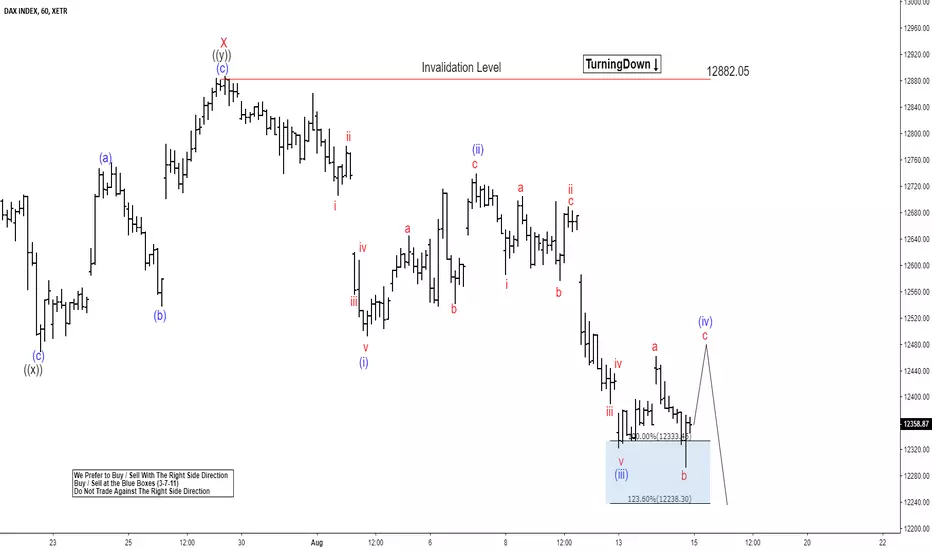
DAX short-term Elliott wave analysis suggests that the rally to 12882.05 high ended red wave X bounce. The internals of that bounce unfolded as Elliott wave double three structure where black wave ((w)) ended at 12640.87. Black wave ((x)) ended at 12468.68 and black wave ((y)) of red X ended at 12882.05 high.
Down from there, DAX is currently suggesting that it is unfolding as a potential 5 waves structure. Where blue wave (i) ended at 02/08/18 low (12491.53), blue wave (ii) pullback at 07/08/18 peak (12740.66), and blue wave (iii) at 08/13/18 low (12321.45). Currently, it is in the progress of making a pullback in blue wave (iv) before extending 1 more leg lower in blue wave (v) before a 3 waves bounce higher can be seen. We don’t like selling it.
Long DAX30 @ 12,500.00; TP @ 12,687, SL your choiceLong DAX30 @ 12,500.00; TP @ 12,687, SL your choice

Elliott Wave Analysis: DAX Ready For Rally Higher?Hello Traders,
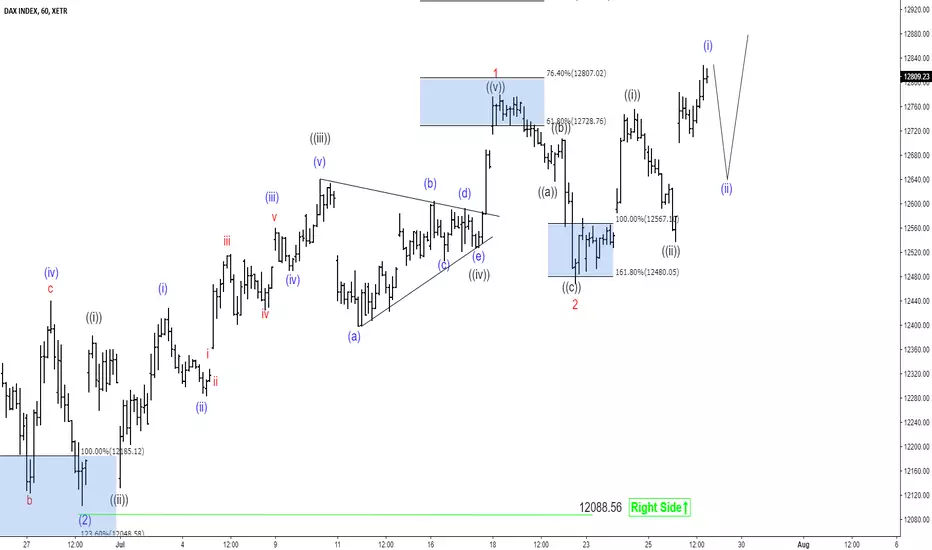
DAX short-term Elliott wave analysis suggests that the pullback to 6.28.2018 low ended blue wave (2) at 12088.56. Up from there, the rally higher to 12769.8 higher ended red wave 1. The internals of that rally higher took place as impulse structure with internal sub-division of 5 wave structure in black wave ((i)), ((iii)) & ((v)). On the other hand, wave ((ii)) & ((iv)) took place in 3 waves corrective structure.
Above from 6.28.2018 low cycle, the rally higher to 12369.5 high ended black wave ((i)). Down from there, the pullback to 12115 low ended black wave ((ii)). The rally higher from there took place in 5 waves structure & ended the black wave ((iii)) at 12630 high. Below from there, the pullback to 12513.5 ended black wave ((iv)) as a contracting triangle. The final rally higher from there ended black wave ((v)) of red wave 1 at 12769.5 peak. Down from there, the correction against 6.28.2018 low cycle completed red wave 2 at 12454.5 low after reaching the blue box area at 12540.50-12446.86 100%-161.8% Fibonacci extension area. Near-term, while dips remain above 12454.5 low and more importantly above 12088.56 low, expect the Index to resume the upside in red wave 3 higher. We don’t like selling it.
GER30 possible long trend last try to 13.000Possible last try at 13.000 for Ger30 Index, equal long term way in Dow Jones.
Targets as shown in the chart.
Good luck :)

DAX Breaksout of sideways Channel The risk sentiment just converted to risk on as investors seems to take buying positions in the global stock markets. Dax just violated major resistance of 12392. I'm seeing next resistance near 12600.
Keep following for more updates!


UPDATE: DAX shows its cards, Patience for a BUY setupHi guys, thank you for the support! I will have this analysis out each weekend as well as daily updates throughout the week, if you guys like what I'm doing hit the "follow" button and you will get a notification each time I post a video or chart!
Have a great day everyone!

DAX30 indexFurther growth is expected in the wave (iii) - blue.
In the case of a breakdown of the local bottom by 11 700 - a coup with a fast short in the zone 10 000 -10 500.

WEEKEND REVIEW: German DAX looks to be in an ABC, PATIENCE!Hi guys, thank you for the support! I will have this analysis out each weekend as well as daily updates throughout the week, if you guys like what I'm doing hit the "follow" button and you will get a notification each time I post a video or chart!
Have a great day everyone!

German DAX may have given clues to path higher!Hi guys quick update to my view on Europe, this is a follow up to a video posted a couple of days back!

DAX - 500 Points possible in 2 weeks.500 points are possible in the next 2 weeks with the goal 13,400 + XXX points. The risk is less than 80 points loss and therefore a good CRR-ChanceRiskRelation is given.

DAX possible scenariosShort term bullish scenario that may still be long term bearish... Note that in my opinion an H&S neckline is support until broken... Anyway we might rally to 12950 and then go back down to 11850... and there we will figure out if we break the neckline or we find support once again... But first we have big resistance around 12400
