DAX40 consolidation capped by resistance at 25033The DAX remains in a bullish trend, with recent price action showing signs of a corrective pullback within the broader uptrend.
Support Zone: 24400 – a key level from previous consolidation. Price is currently testing or approaching this level.
A bullish rebound from 24400 would confirm ongoing upside momentum, with potential targets at:
25033 – initial resistance
25180 – psychological and structural level
25340 – extended resistance on the longer-term chart
Bearish Scenario:
A confirmed break and daily close below 24400 would weaken the bullish outlook and suggest deeper downside risk toward:
24200 – minor support
23990 – stronger support and potential demand zone
Outlook:
Bullish bias remains intact while the DAX holds above 24400. A sustained break below this level could shift momentum to the downside in the short term.
This communication is for informational purposes only and should not be viewed as any form of recommendation as to a particular course of action or as investment advice. It is not intended as an offer or solicitation for the purchase or sale of any financial instrument or as an official confirmation of any transaction. Opinions, estimates and assumptions expressed herein are made as of the date of this communication and are subject to change without notice. This communication has been prepared based upon information, including market prices, data and other information, believed to be reliable; however, Trade Nation does not warrant its completeness or accuracy. All market prices and market data contained in or attached to this communication are indicative and subject to change without notice.
Dax40

Germany 40 :: Trend-Aligned Bullish Trade Setup📈 GERMANY 40 (DAX 40) INDEX - BULLISH PULLBACK CONTINUATION 🚀
Day/Swing Trade Strategic Entry Guide | CFD Market Opportunity
🎯 TRADING SETUP OVERVIEW
Asset: DAX 40 Index (German Blue-Chip Equities) 🇩🇪
Current Market Level: ≈ 24,896 - 24,950 EUR (As of Jan 27, 2026)
52-Week Range: 18,489.91 - 25,507.79 EUR
YTD Performance: +16.13% | Month Trend: +2.48% | Weekly: -1.72%
Market Trend: Bullish with Pullback Consolidation Phase ✅
📊 TECHNICAL ANALYSIS - PRICE ACTION SETUP
Bullish Thesis: SMA Pullback + Reversal Confirmation
✨ Strategy Structure:
Primary Trend: Uptrend Intact (ATH: 25,507.79 on Jan 13, 2026) 📈
Current Correction: Healthy consolidation zone between 24,400 - 24,950
Technical Signal: Simple Moving Average (SMA) pullback with support validation
Market Cycle: Transitioning from retracement phase → acceleration phase
🎪 ENTRY STRATEGY - TIERED LIMIT LAYER APPROACH
"Smart money enters at strength, not at desperation!" 💡
TIER 1 - AGGRESSIVE ENTRY (First Confirmation Signal)
Price Level: 24,700 EUR ✅
Rationale: Tests 61.8% Fibonacci retracement + Daily support zone
Risk Profile: Medium - Immediate technical resistance above
TIER 2 - OPTIMAL ENTRY (Recommended Sweet Spot)
Price Level: 24,800 EUR 🎯
Rationale: Key consolidation support + Previous PoC (Point of Control)
Risk Profile: Best Risk/Reward Ratio
Volume Profile Strength: High liquidity, support bounce evidence
TIER 3 - CONSERVATIVE ENTRY (Maximum Confirmation)
Price Level: 24,900 EUR 📍
Rationale: Final retest of recent swing high + SMA convergence zone
Risk Profile: Lower volatility entry, higher probability confirmation
Entry Execution: Use LIMIT ORDERS ONLY for superior execution
Avoid MARKET ORDERS (slippage risk in index trading)
Set entries 5-10 minutes before Frankfurt Open (8:00-9:00 CET)
Stack 3 positions across all tiers to maximize edge
🎲 TARGET LEVELS - PROFIT TAKING STRATEGY
PRIMARY TARGET: 25,500 EUR 🚀
Distance from Entry: +600 to +800 points
Technical Reason:
📌 Fibonacci Resistance Cluster (78.6% projection)
📌 Previous ATH breakout zone (25,507.79)
📌 Overbought RSI signals exit at this junction
📌 Institutional resistance + Order clustering
Risk Factor: Strong resistance confluences - expect rejection/consolidation
SECONDARY TARGET: 25,200 EUR ⭐
Conservative Exit: Take partial profits here (50% position)
Reason: Second resistance tier, risk management checkpoint
TRAILING PROFIT STRATEGY:
Lock gains at +400 points minimum
Trail stop-loss above recent swing lows
DISCLAIMER: Risk management is YOUR responsibility ⚠️
🛑 STOP LOSS MANAGEMENT - CAPITAL PRESERVATION
Recommended SL Placement: 24,600 EUR 💪
Distance from Optimal Entry (24,800): -200 points loss maximum
Technical Justification:
📍 Sits below key daily support pivot (24,412.21)
📍 Below 61.8% Fibonacci support zone
📍 If this breaks = trend reversal confirmed
Risk per Trade: 2-3% portfolio allocation recommended
AGGRESSIVE SL (For Strong Risk Appetite): 24,650 EUR
Tighter, reduces loss magnitude
Increases stop hunts/whipsaws probability
CONSERVATIVE SL (For Capital Preservation): 24,400 EUR
Allows more room for consolidation noise
Slightly wider but higher survival rate
⚠️ CRITICAL DISCLAIMER: Your stop-loss placement is YOUR decision based on risk tolerance. Don't copy blindly. Adjust to YOUR account size and risk parameters!
🔗 CORRELATED PAIRS TO WATCH - CONFLUENCE TRADING
POSITIVE CORRELATIONS (Move Together ↔️)
1. EUR/USD 💱 - EUROPEAN CURRENCY STRENGTH
Ticker: EURUSD / FX:EURUSD
Why It Matters: DAX composed of Eurozone exporters; EUR strength = DAX benefits
Current Level: ~1.1700 (Monitor resistance/support)
Watch Signal: Break above 1.1700 = additional bullish catalyst for DAX
Impact: 0.70+ correlation coefficient
2. EUROSTOXX 50 📊 - BROADER EUROPEAN EQUITIES
Ticker: ^STOXX50 / TVC:ESTX50
Why It Matters: DAX is largest component; often leads EStoxx movement
Setup Advantage: Confirm DAX strength via European sector index
Divergence Risk: If DAX rallies but EuroStoxx lags = weakness warning
3. S&P 500 / SPX 🇺🇸 - GLOBAL RISK SENTIMENT BAROMETER
Ticker: ^GSPC / TVC:SPX500
Why It Matters: Risk-on/risk-off appetite flows across Atlantic
Current Level: ~6,915 (Monitor Fed decision impact)
Correlation Context: 0.65+ during bull markets; weakens in crisis
Trade Signal: SPX strength > DAX often precedes 24-48hr DAX surge
4. FTSE 100 📍 - UK EQUITY BENCHMARK
Ticker: ^FTSE / TVC:UK100
Why It Matters: Close correlation to DAX; financials + commodities exposure
Monitor: If FTSE breaks key support = risk-off signal for DAX
INVERSE CORRELATIONS (Opposite Moves) ⚡
1. USD/INDEX 💪 - US DOLLAR STRENGTH
Ticker: DXY / USDINDEX
Why It Matters: Strong USD = headwind for DAX exporters
Watch: If DXY rallies above 109 = potential DAX pressure
Setup: Weakness in USD = tailwind for continental Europe stocks
2. VIX / VOLATILITY INDEX 😰
Ticker: ^VIX / CVIX
Why It Matters: Rising fear = risk-off = DAX weakness
Safe Zone: VIX below 18 = bullish backdrop for DAX
Warning Signal: VIX spike above 25 = trend reversal risk
📰 FUNDAMENTAL & ECONOMIC FACTORS - MACRO DRIVERS FOR 2026
🇩🇪 GERMAN ECONOMIC STRENGTH NARRATIVE ✅
1. FISCAL STIMULUS BOOST 💰 (Major Positive)
€127 Billion Defense + Infrastructure Spending (2026):
Government approved new €500B special fund for infrastructure
Defense spending exempted from debt brake (1%+ of GDP)
Multiplier effect expected Q2-Q4 2026
Impact on DAX: Infrastructure/defense contractors (Rheinmetall, Airbus) → Upside
Status: Already approved, beginning implementation phase
2. ECONOMIC RECOVERY TRAJECTORY 📈
Bundesbank Forecast: GDP stagnation 2025 → +1.2% growth 2026-2027
Growth Driver: Export resurgence starting Q2 2026
Manufacturing Momentum: German Composite PMI = 52.5 (3-month high, Jan 2026)
Implication: Peak pessimism already priced in; upside surprise likely
3. INFLATION NORMALIZATION ✨ (Supportive for Equities)
German HICP Inflation: 2.0% (Dec 2025) - At ECB 2% target!
Forecast Path: 2.1% (2026) → 1.9% (2027) → 2.0% (2028)
Real Wage Growth: +8.5% minimum wage increases announced
Equity Impact: Lower inflation removes rate hike fears; supports valuations
4. ECB POLICY STANCE 🏦 (Supportive Hold)
ECB Rate Decision: HOLD at 2.0% deposit rate through 2026
Rationale: Inflation at target (2%), growth resilient at 1.4%
Next Hike Expected: Mid-2027 only (if inflation accelerates)
Market Impact: Monetary accommodation extended; liquidity supportive
⚠️ HEADWIND FACTORS TO MONITOR 🚨
1. US TARIFF UNCERTAINTY 🎯
Trump Administration Risk: 200% threats on French goods, potential EU tariffs
DAX Impact: Export-dependent companies (SAP, Siemens, Allianz) face pressure
Mitigation: German fiscal spending partially offsets export weakness
2. GEOPOLITICAL TENSIONS 🌍
Recent De-escalation: Greenland concern subsided (net positive for risk sentiment)
Ongoing Risks: Russia/Ukraine, Middle East remain volatile
Market Effect: Drives intermittent VIX spikes; creates trading noise
3. CHINA COMPETITIVE PRESSURE 🐉
EV Transition Challenge: German auto industry facing Chinese EV competition
DAX Exposures: BMW, Mercedes, Volkswagen at risk long-term
Silver Lining: German tech (SAP, Infineon) + defense spending counters
📅 UPCOMING ECONOMIC CALENDAR - KEY DATES TO WATCH
Jan 28-29, 2026 🇺🇸 US Fed Decision (HIGH IMPACT) - Watch for rate hold + forward guidance signals that could shift risk sentiment
Jan 30, 2026 🏦 ECB Policy Decision (MEDIUM IMPACT) - Expected rate hold at 2.0%; confirmation keeps monetary accommodation supportive
Late Jan 2026 💻 SAP Q4 Earnings (HIGH IMPACT) - Tech sector bellwether; strong results = DAX upside catalyst
Feb 2026 🏭 German Factory Orders (MEDIUM IMPACT) - Measures economic momentum; growth above forecast = bullish for exporters
Q1 2026 📊 German GDP Data (HIGH IMPACT) - Recovery confirmation; expected +1.2% growth validates our bullish thesis
Feb/Mar 2026 📈 ECB Inflation Data (MEDIUM IMPACT) - Maintains 2% target check; any spike above = potential rate hike concerns
💡 TRADER'S EDGE - THIEF TRADER PHILOSOPHY
"The market rewards patience, position sizing, and profit-taking discipline more than perfect timing."
TRADING COMMANDMENTS 📜
✅ DO THIS:
Plan your trade → Trade your plan (No emotion)
Use limit entries at calculated levels (Avoid chase buying)
Take profits incrementally (50% at target 2, trail the rest)
Respect stops (Losses are learning fees)
Scale position size to risk tolerance (2-3% loss = survival mode)
❌ AVOID THIS:
FOMO entries at market price (Slippage killer)
Holding through TP target (Greed loses gains)
Moving stops against you (Stop-hunt protection lost)
Averaging down in downtrends (Pyramid to danger)
Ignoring correlation signals (Confluence > single indicator)
🎯 RISK DISCLOSURE & IMPORTANT WARNINGS ⚠️
THIS IS NOT FINANCIAL ADVICE!
💼 Trader's Acknowledgment:
Index CFD trading carries EXTREME RISK - 80%+ of retail traders lose capital
You can lose MORE than your initial deposit (leverage = double-edged sword)
Past performance (DAX +16.13% YTD) ≠ Future results
Geopolitical/economic shocks can gap markets against your stops
ONLY risk capital you can afford to lose completely
🔐 Your Responsibility:
This analysis is educational framework, not a trading signal
Entry price selection (24,700 / 24,800 / 24,900) is YOUR choice
Stop-loss placement must match YOUR risk tolerance
Take-profit levels are suggestions—adjust to YOUR psychology
Consult a licensed financial advisor before trading
Use demo account first to validate edge
🚀 FINAL WISDOM - TRADER'S MANTRA
"In trading, capital preservation beats capital accumulation. A small, consistent edge + compound returns = wealth."
The Setup is Clear. Entry signals are prepared. Confluence is established. Now it's YOUR move.
Will you wait for confirmation? Will you scale entries? Will you honor your stops?
The market doesn't care about your opinion. It only respects price action and risk management.
Trade with purpose. Trade with discipline. Trade to survive another day.
🎲 May your entries be precise, your exits be profitable, and your psychology be unshakeable. 💪

DAX40 corrective pullback supported at 24400The DAX remains in a bullish trend, with recent price action showing signs of a corrective pullback within the broader uptrend.
Support Zone: 24400 – a key level from previous consolidation. Price is currently testing or approaching this level.
A bullish rebound from 24400 would confirm ongoing upside momentum, with potential targets at:
25033 – initial resistance
25180 – psychological and structural level
25340 – extended resistance on the longer-term chart
Bearish Scenario:
A confirmed break and daily close below 24400 would weaken the bullish outlook and suggest deeper downside risk toward:
24200 – minor support
23990 – stronger support and potential demand zone
Outlook:
Bullish bias remains intact while the DAX holds above 24400. A sustained break below this level could shift momentum to the downside in the short term.
This communication is for informational purposes only and should not be viewed as any form of recommendation as to a particular course of action or as investment advice. It is not intended as an offer or solicitation for the purchase or sale of any financial instrument or as an official confirmation of any transaction. Opinions, estimates and assumptions expressed herein are made as of the date of this communication and are subject to change without notice. This communication has been prepared based upon information, including market prices, data and other information, believed to be reliable; however, Trade Nation does not warrant its completeness or accuracy. All market prices and market data contained in or attached to this communication are indicative and subject to change without notice.

Pullback resistance?DAX40 (DE40) is rising towards the pivot, which aligns with the 61.8% Fibonacci retracement and could reverse to the 1st support.
Pivot: 25,044.65
1st Support: 24,501.58
1st Resistance: 25,454.88
Disclaimer:
The opinions given above constitute general market commentary and do not constitute the opinion or advice of IC Markets or any form of personal or investment advice.
Any opinions, news, research, analyses, prices, other information, or links to third-party sites contained on this website are provided on an "as-is" basis, are intended to be informative only, and are not advice, a recommendation, research, a record of our trading prices, an offer of, or solicitation for, a transaction in any financial instrument and thus should not be treated as such. The information provided does not involve any specific investment objectives, financial situation, or needs of any specific person who may receive it. Please be aware that past performance is not a reliable indicator of future performance and/or results. Past performance or forward-looking scenarios based upon the reasonable beliefs of the third-party provider are not a guarantee of future performance. Actual results may differ materially from those anticipated in forward-looking or past performance statements. IC Markets makes no representation or warranty and assumes no liability as to the accuracy or completeness of the information provided, nor any loss arising from any investment based on a recommendation, forecast, or any information supplied by any third party

GER40 (DAX) – Bearish Continuation SetupGER40 (DAX) – Bearish Continuation Setup | Jan 20, 2026
Market Context
The current macro environment remains fragile for European equities.
Eurozone growth continues to underperform, with Germany particularly exposed to:
Weak industrial momentum
Elevated energy costs
Soft business confidence expectations (IFO ahead)
At the same time, global risk sentiment is leaning risk-off, driven by geopolitical uncertainty and USD repositioning flows. This backdrop continues to weigh on cyclically sensitive indices such as the GER40.
Technical Structure (Elliott Wave Perspective)
From a technical standpoint, GER40 is trading within a confirmed bearish structure.
A strong impulsive move to the downside has already unfolded.
Price is currently consolidating in a weak corrective phase, consistent with a Wave 2 retracement within a larger bearish cycle.
The retracement remains shallow and overlapping, failing to reclaim key supply zones above.
This behaviour is typical of a market preparing for a Wave 3 continuation, rather than a trend reversal.
Key Technical Levels
Trigger (Confirmation Level): ~24,502
A decisive break and acceptance below this level confirms the end of Wave 2.
Stop Loss (Technical): ~24,725
Located above the corrective structure.
Structural Invalidation: ~24,790
A move above this level invalidates the bearish Elliott scenario.
Target 1 (Wave 3 Extension): ~24,025
Target 2 (Deeper Extension / Liquidity Zone): ~23,596
Risk/Reward improves significantly once price accepts below the trigger.
Execution Plan
Bias: Bearish
Horizon: Swing
Entry Condition:
Short only after a break and hold below 24,502 (confirmation-based entry).
No anticipation trades. No early shorts.
This setup favors patience over prediction. Until the trigger is broken with acceptance, the market remains in corrective mode.
Macro Alignment
This technical setup aligns with the broader macro thesis:
Eurozone growth concerns remain unresolved.
German data continues to underperform expectations.
Risk appetite is fragile, limiting upside follow-through.
Any short-term rebounds are likely corrective unless macro conditions materially improve.
Upcoming German IFO Business Climate data remains a key event risk. Position sizing should be adjusted accordingly.
Final Notes
This is a conditional continuation trade, not a forecast.
The setup does not exist until price confirms it.
If acceptance below the trigger occurs, the probability favors a sustained bearish leg.
If not, continued consolidation or a prolonged Wave 2 remains the dominant scenario.
Stay reactive.

DAX40 corrective pullback support at 24400The DAX remains in a bullish trend, with recent price action showing signs of a corrective pullback within the broader uptrend.
Support Zone: 24400 – a key level from previous consolidation. Price is currently testing or approaching this level.
A bullish rebound from 24400 would confirm ongoing upside momentum, with potential targets at:
25033 – initial resistance
25180 – psychological and structural level
25340 – extended resistance on the longer-term chart
Bearish Scenario:
A confirmed break and daily close below 24400 would weaken the bullish outlook and suggest deeper downside risk toward:
24200 – minor support
23990 – stronger support and potential demand zone
Outlook:
Bullish bias remains intact while the DAX holds above 24400. A sustained break below this level could shift momentum to the downside in the short term.
This communication is for informational purposes only and should not be viewed as any form of recommendation as to a particular course of action or as investment advice. It is not intended as an offer or solicitation for the purchase or sale of any financial instrument or as an official confirmation of any transaction. Opinions, estimates and assumptions expressed herein are made as of the date of this communication and are subject to change without notice. This communication has been prepared based upon information, including market prices, data and other information, believed to be reliable; however, Trade Nation does not warrant its completeness or accuracy. All market prices and market data contained in or attached to this communication are indicative and subject to change without notice.

DAX consolidation resistance at 25524The DAX remains in a bullish trend, with recent price action showing signs of a breakout within the broader uptrend.
Support Zone: 25030 – a key level from previous consolidation. Price is currently testing or approaching this level.
A bullish rebound from 25030 would confirm ongoing upside momentum, with potential targets at:
25524 – initial resistance
25770 – psychological and structural level
26000 – extended resistance on the longer-term chart
Bearish Scenario:
A confirmed break and daily close below 25030 would weaken the bullish outlook and suggest deeper downside risk toward:
24780 – minor support
24660 – stronger support and potential demand zone
Outlook:
Bullish bias remains intact while the DAX holds above 25030. A sustained break below this level could shift momentum to the downside in the short term.
This communication is for informational purposes only and should not be viewed as any form of recommendation as to a particular course of action or as investment advice. It is not intended as an offer or solicitation for the purchase or sale of any financial instrument or as an official confirmation of any transaction. Opinions, estimates and assumptions expressed herein are made as of the date of this communication and are subject to change without notice. This communication has been prepared based upon information, including market prices, data and other information, believed to be reliable; however, Trade Nation does not warrant its completeness or accuracy. All market prices and market data contained in or attached to this communication are indicative and subject to change without notice.

German 40 with potential shooting star reversal in daily charttoday - with current status - bearish movement.
waiting for closing to confirm potential end of strong bullish impulse of the last 2 weeks.

DAX40 Bullish breakout continuation supported at 25030The DAX remains in a bullish trend, with recent price action showing signs of a breakout within the broader uptrend.
Support Zone: 25030 – a key level from previous consolidation. Price is currently testing or approaching this level.
A bullish rebound from 25030 would confirm ongoing upside momentum, with potential targets at:
25524 – initial resistance
25770 – psychological and structural level
26000 – extended resistance on the longer-term chart
Bearish Scenario:
A confirmed break and daily close below 25030 would weaken the bullish outlook and suggest deeper downside risk toward:
24780 – minor support
24660 – stronger support and potential demand zone
Outlook:
Bullish bias remains intact while the DAX holds above 25030. A sustained break below this level could shift momentum to the downside in the short term.
This communication is for informational purposes only and should not be viewed as any form of recommendation as to a particular course of action or as investment advice. It is not intended as an offer or solicitation for the purchase or sale of any financial instrument or as an official confirmation of any transaction. Opinions, estimates and assumptions expressed herein are made as of the date of this communication and are subject to change without notice. This communication has been prepared based upon information, including market prices, data and other information, believed to be reliable; however, Trade Nation does not warrant its completeness or accuracy. All market prices and market data contained in or attached to this communication are indicative and subject to change without notice.

Dax Bullish Continuation Expected After PullbacksH1 - Strong bullish move
No opposite signs
Until the two support zones hold I expect bullish continuation
👉 If you enjoy this analysis, please Like, Follow, and Support the profile! Your engagement motivates us to share more quality setups.

Dax - Short Term Buy IdeaH1 - Strong bullish momentum.
No opposite signs.
Until the two Fibonacci support zones hold I expect the price to move higher further.
If you enjoy this idea, don’t forget to LIKE 👍, FOLLOW ✅, SHARE 🙌, and COMMENT ✍! Drop your thoughts and charts below to keep the discussion going. Your support helps keep this content free and reach more people! 🚀
--------------------------------------------------------------------------------------------------------

DAX 40 - Not too late to the partyThe DAX 40 is already 6 daily candles into a major bullish breakout - but there is still time to participate
Setup
Bullish - record high / range breakout
Strong breakout from 8-month trading range
RSI in bullish overbought territory
Above 20/50/200 SMAs
Commentary
The former range resistance at 24500/600 is now support if the breakout is to hold. After 5 green days above the breakout level - it looks confirmed. Can now wait for a dip from overbought territory to join the new uptrend.
Strategy
Buy dip to 25k
Buy dip to 24500/600
But - as always - that’s just how the team and I are seeing things, what do you think?
Share your ideas OR send us a request!
Cheers,
Jasper
Disclaimer:
The communication does not constitute investment or trading advice, nor does it include any recommendations. Additionally, it does not serve as an offer or solicitation to engage in transactions involving financial instruments. WeTrade does not take responsibility for any actions taken based on the information provided, nor for any outcomes that may occur as a result of the actions taken.

DAX30/GER30 - 3RD TIME LUCKYTeam, twice we are kicking ass on DAX/GER today
Now the price are at 25249 which is much better than price we short earlier.
Time to short at 25247-25255 - please ADD more at 35296-25315
STOP LOSS at 25365
Target 1 at 25215-25193
Target 2 at 25186-25155
PLEASE ALWAY FOLLOW TO RULE, take partial in 1st target and bring stop loss to BREAK EVEN..
Thats our safety rule.
LETS GO !

DAX uptrend breakout supported at 24730The DAX remains in a bullish trend, with recent price action showing signs of a breakout within the broader uptrend.
Support Zone: 24730 – a key level from previous consolidation. Price is currently testing or approaching this level.
A bullish rebound from 24730 would confirm ongoing upside momentum, with potential targets at:
25150 – initial resistance
25300 – psychological and structural level
25400 – extended resistance on the longer-term chart
Bearish Scenario:
A confirmed break and daily close below 24730 would weaken the bullish outlook and suggest deeper downside risk toward:
24620 – minor support
24490 – stronger support and potential demand zone
Outlook:
Bullish bias remains intact while the DAX holds above 24730. A sustained break below this level could shift momentum to the downside in the short term.
This communication is for informational purposes only and should not be viewed as any form of recommendation as to a particular course of action or as investment advice. It is not intended as an offer or solicitation for the purchase or sale of any financial instrument or as an official confirmation of any transaction. Opinions, estimates and assumptions expressed herein are made as of the date of this communication and are subject to change without notice. This communication has been prepared based upon information, including market prices, data and other information, believed to be reliable; however, Trade Nation does not warrant its completeness or accuracy. All market prices and market data contained in or attached to this communication are indicative and subject to change without notice.

DAX Bullish breakout support at 24730The DAX remains in a bullish trend, with recent price action showing signs of a breakout within the broader uptrend.
Support Zone: 24730 – a key level from previous consolidation. Price is currently testing or approaching this level.
A bullish rebound from 24730 would confirm ongoing upside momentum, with potential targets at:
25000 – initial resistance
25150 – psychological and structural level
25300 – extended resistance on the longer-term chart
Bearish Scenario:
A confirmed break and daily close below 24730 would weaken the bullish outlook and suggest deeper downside risk toward:
24620 – minor support
24490 – stronger support and potential demand zone
Outlook:
Bullish bias remains intact while the DAX holds above 24730. A sustained break below this level could shift momentum to the downside in the short term.
This communication is for informational purposes only and should not be viewed as any form of recommendation as to a particular course of action or as investment advice. It is not intended as an offer or solicitation for the purchase or sale of any financial instrument or as an official confirmation of any transaction. Opinions, estimates and assumptions expressed herein are made as of the date of this communication and are subject to change without notice. This communication has been prepared based upon information, including market prices, data and other information, believed to be reliable; however, Trade Nation does not warrant its completeness or accuracy. All market prices and market data contained in or attached to this communication are indicative and subject to change without notice.

DAX30/GER30 - WAKE UP AT 4AMTeam, I just wake up at 4am
Earlier we kill the DAX with both target hit, please check previous posted.
NOW, we have opportunity to short at much more better price, as I expect the retest will come back.
Time to short at 24877-24886, STOP LOSS at 24965
Target 1 at 24832-24816 - take partial and bring stop loss to BE
Target 2 at 24796-24785
LETS GO AND KILL THE BEAST.
NOTE: I expect the market will drop once the REAL EUROPEANING market opening which is estimate 14-16 hours from here!

DAX40 resistance breakout supported at 24200The DAX remains in a bullish trend, with recent price action showing signs of a breakout within the broader uptrend.
Support Zone: 24200 – a key level from previous consolidation. Price is currently testing or approaching this level.
A bullish rebound from 24200 would confirm ongoing upside momentum, with potential targets at:
24640 – initial resistance
24775 – psychological and structural level
24943 – extended resistance on the longer-term chart
Bearish Scenario:
A confirmed break and daily close below 24200 would weaken the bullish outlook and suggest deeper downside risk toward:
24060 – minor support
23910 – stronger support and potential demand zone
Outlook:
Bullish bias remains intact while the DAX holds above 24200. A sustained break below this level could shift momentum to the downside in the short term.
This communication is for informational purposes only and should not be viewed as any form of recommendation as to a particular course of action or as investment advice. It is not intended as an offer or solicitation for the purchase or sale of any financial instrument or as an official confirmation of any transaction. Opinions, estimates and assumptions expressed herein are made as of the date of this communication and are subject to change without notice. This communication has been prepared based upon information, including market prices, data and other information, believed to be reliable; however, Trade Nation does not warrant its completeness or accuracy. All market prices and market data contained in or attached to this communication are indicative and subject to change without notice.

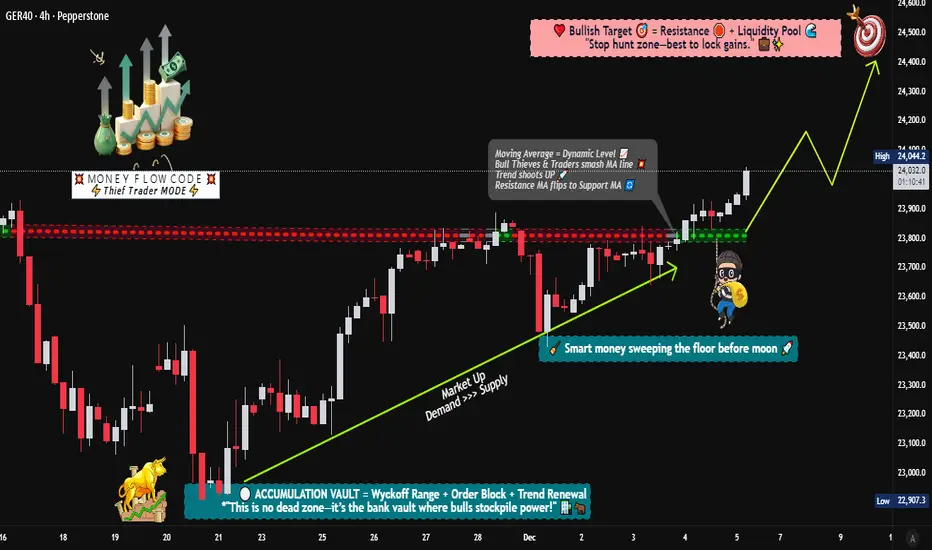
DAX40 Momentum Shift: Layered Buy Setup for Clean Profit Flow🚀 DAX40 (GER40) BULLISH BREAKOUT ALERT! | Layer Strategy for MAX Gains 🚀
📈 DAX40 BULLISH BREAKOUT CONFIRMED! 🏆 (Swing/Day Trade Setup with Layer Entry)
📊 Idea: Strong bullish momentum on the GER40 / DAX 40 following a decisive breakout above key moving averages! Perfect setup for a structured "thief-style" layered entry to capitalize on the trend.
🔑 KEY LEVELS & PLAN:
Trend: Bullish (MA Breakout Confirmation)
Entry Strategy: "Thief" Layer Method 🎯
Use multiple BUY LIMIT orders at key dips: 23,600 | 23,700 | 23,800 | 23,900 (Add more layers based on your capital).
This averages your entry and maximizes opportunity on pullbacks.
Stop Loss (SL): 23,400 (Thief OG's Zone ⚠️).
IMPORTANT NOTE: Adjust your SL based on YOUR risk tolerance & strategy! This is a guide, not financial advice. Protect your capital.
Take Profit (TP): Target Zone: 24,500 🎯
Strong resistance & potential overbought trap area. Secure profits wisely!
REMINDER: Manage your own TP. Take money at your own risk.
💎 PRO TRADER NOTES:
This "thief" layer strategy requires patience & discipline. Let the market come to your orders. Never risk more than 1-2% per layer. Trade with a plan, not emotion!
🌍 RELATED PAIRS TO WATCH (KEY CORRELATIONS):
FX:EURUSD : INVERSE Correlation. A stronger Euro can pressure DAX (export-heavy index). Watch for USD weakness supporting DAX rallies.
CAPITALCOM:US30 (Dow Jones) / SP:SPX (S&P 500): POSITIVE Correlation. US market strength often lifts European indices. Key for overall risk sentiment.
ICMARKETS:STOXX50 (Euro Stoxx 50): HIGH Correlation. Broader European index performance.
BUND Futures (/FGBL): INVERSE Correlation. Rising German bond yields (falling prices) can signal economic optimism, often supporting DAX.
EUR/GBP ( OANDA:EURGBP ): UK/EU economic relative strength flows.
👇 LIKE & FOLLOW if you found this useful!
💬 COMMENT your entry levels or chart insights below!
🔔 Click the BELL on my profile for real-time idea alerts!
#DAX #GER40 #TradingView #Breakout #Bullish #SwingTrading #DayTrading #LayerStrategy #TradingPlan #Forex #Indices #Investing #Stocks #ThiefStrategy #EURUSD
DAX Resistance overhead The DAX remains in a bullish trend, with recent price action showing signs of a breakout within the broader uptrend.
Support Zone: 23973 – a key level from previous consolidation. Price is currently testing or approaching this level.
A bullish rebound from 23973 would confirm ongoing upside momentum, with potential targets at:
24640 – initial resistance
24775 – psychological and structural level
24943 – extended resistance on the longer-term chart
Bearish Scenario:
A confirmed break and daily close below 23973 would weaken the bullish outlook and suggest deeper downside risk toward:
23860 – minor support
23760 – stronger support and potential demand zone
Outlook:
Bullish bias remains intact while the DAX holds above 23973. A sustained break below this level could shift momentum to the downside in the short term.
This communication is for informational purposes only and should not be viewed as any form of recommendation as to a particular course of action or as investment advice. It is not intended as an offer or solicitation for the purchase or sale of any financial instrument or as an official confirmation of any transaction. Opinions, estimates and assumptions expressed herein are made as of the date of this communication and are subject to change without notice. This communication has been prepared based upon information, including market prices, data and other information, believed to be reliable; however, Trade Nation does not warrant its completeness or accuracy. All market prices and market data contained in or attached to this communication are indicative and subject to change without notice.

Potential bullish rise?DAX40 (DE40) has bounced off the pivot and could rise to the 1st resistance, which acts as a swing high resistance.
Pivot: 24,210.89
1st Support: 24,102.79
1st Resistance: 24,434.34
Disclaimer:
The opinions given above constitute general market commentary and do not constitute the opinion or advice of IC Markets or any form of personal or investment advice.
Any opinions, news, research, analyses, prices, other information, or links to third-party sites contained on this website are provided on an "as-is" basis, are intended to be informative only, and are not advice, a recommendation, research, a record of our trading prices, an offer of, or solicitation for, a transaction in any financial instrument and thus should not be treated as such. The information provided does not involve any specific investment objectives, financial situation, or needs of any specific person who may receive it. Please be aware that past performance is not a reliable indicator of future performance and/or results. Past performance or forward-looking scenarios based upon the reasonable beliefs of the third-party provider are not a guarantee of future performance. Actual results may differ materially from those anticipated in forward-looking or past performance statements. IC Markets makes no representation or warranty and assumes no liability as to the accuracy or completeness of the information provided, nor any loss arising from any investment based on a recommendation, forecast, or any information supplied by any third party

DAX Short set-up in M15!Following a strong bullish move, the DAX shows short-term weakness on the M15 chart. Price is trading below a key intraday support zone, which may indicate a potential short scenario. A pullback toward the former support area around 24,240–24,250 can be observed as a possible reaction zone. If this area acts as resistance, a continuation toward the next support near 24,170 comes into focus.

DAX corrective pullback support at 23870The DAX remains in a bullish trend, with recent price action showing signs of a breakout within the broader uptrend.
Support Zone: 23870 – a key level from previous consolidation. Price is currently testing or approaching this level.
A bullish rebound from 23870 would confirm ongoing upside momentum, with potential targets at:
24300 – initial resistance
24450 – psychological and structural level
24560 – extended resistance on the longer-term chart
Bearish Scenario:
A confirmed break and daily close below 23870 would weaken the bullish outlook and suggest deeper downside risk toward:
23712 – minor support
23600 – stronger support and potential demand zone
Outlook:
Bullish bias remains intact while the DAX holds above 23870. A sustained break below this level could shift momentum to the downside in the short term.
This communication is for informational purposes only and should not be viewed as any form of recommendation as to a particular course of action or as investment advice. It is not intended as an offer or solicitation for the purchase or sale of any financial instrument or as an official confirmation of any transaction. Opinions, estimates and assumptions expressed herein are made as of the date of this communication and are subject to change without notice. This communication has been prepared based upon information, including market prices, data and other information, believed to be reliable; however, Trade Nation does not warrant its completeness or accuracy. All market prices and market data contained in or attached to this communication are indicative and subject to change without notice.

Falling towards pullback support?DAX40 (DE40) is pulling back toward the pivot, which is acting as a key support. This level aligns with the 38.2% Fibonacci retracement, and price could potentially bounce toward the first resistance.
Pivot: 23,877.01
1st Support: 23,646.41
1st Resistance: 24,219.38
Disclaimer:
The opinions given above constitute general market commentary and do not constitute the opinion or advice of IC Markets or any form of personal or investment advice.
Any opinions, news, research, analyses, prices, other information, or links to third-party sites contained on this website are provided on an "as-is" basis, are intended to be informative only, and are not advice, a recommendation, research, a record of our trading prices, an offer of, or solicitation for, a transaction in any financial instrument and thus should not be treated as such. The information provided does not involve any specific investment objectives, financial situation, or needs of any specific person who may receive it. Please be aware that past performance is not a reliable indicator of future performance and/or results. Past performance or forward-looking scenarios based upon the reasonable beliefs of the third-party provider are not a guarantee of future performance. Actual results may differ materially from those anticipated in forward-looking or past performance statements. IC Markets makes no representation or warranty and assumes no liability as to the accuracy or completeness of the information provided, nor any loss arising from any investment based on a recommendation, forecast, or any information supplied by any third party
