DAX Bullish breakout retest?The DAX remains in a bullish trend, with recent price action indicating a potential overbought pullback within the broader uptrend.
Support Zone: 23970 – a key level from previous consolidation. Price is currently testing or approaching this level.
A bullish rebound from 23970 would confirm ongoing upside momentum, with potential targets at:
24490 – initial resistance
24580 – psychological and structural level
24770 – extended resistance on the longer-term chart
Bearish Scenario:
A confirmed break and daily close below 23970 would weaken the bullish outlook and suggest deeper downside risk toward:
23870 – minor support
23770 – stronger support and potential demand zone
Outlook:
Bullish bias remains intact while the Dax40 holds above 23970. A sustained break below this level could shift momentum to the downside in the short term.
This communication is for informational purposes only and should not be viewed as any form of recommendation as to a particular course of action or as investment advice. It is not intended as an offer or solicitation for the purchase or sale of any financial instrument or as an official confirmation of any transaction. Opinions, estimates and assumptions expressed herein are made as of the date of this communication and are subject to change without notice. This communication has been prepared based upon information, including market prices, data and other information, believed to be reliable; however, Trade Nation does not warrant its completeness or accuracy. All market prices and market data contained in or attached to this communication are indicative and subject to change without notice.
Dax40
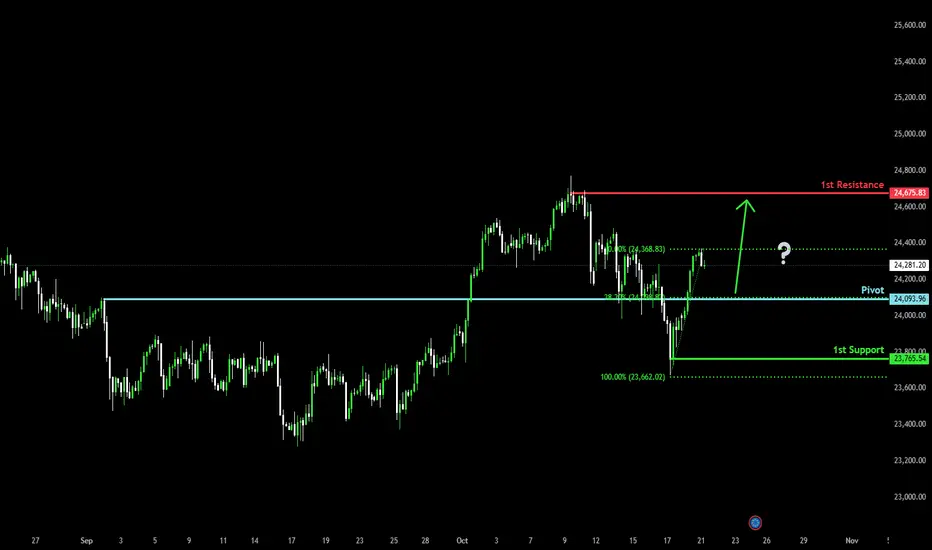
Falling towards 38.2% Fibonacci support?DAX40 (DE40) is falling towards the pivot which is an overlap support that aligns with the 38.2% Fibonacci retracement and could bounce to the swing high resistance.
Pivot: 24,093.96
1st Support: 23,765.54
1st Resistance: 24,675.83
Disclaimer:
The above opinions given constitute general market commentary, and do not constitute the opinion or advice of IC Markets or any form of personal or investment advice.
Any opinions, news, research, analyses, prices, other information, or links to third-party sites contained on this website are provided on an "as-is" basis, are intended only to be informative, is not an advice nor a recommendation, nor research, or a record of our trading prices, or an offer of, or solicitation for a transaction in any financial instrument and thus should not be treated as such. The information provided does not involve any specific investment objectives, financial situation and needs of any specific person who may receive it. Please be aware, that past performance is not a reliable indicator of future performance and/or results. Past Performance or Forward-looking scenarios based upon the reasonable beliefs of the third-party provider are not a guarantee of future performance. Actual results may differ materially from those anticipated in forward-looking or past performance statements. IC Markets makes no representation or warranty and assumes no liability as to the accuracy or completeness of the information provided, nor any loss arising from any investment based on a recommendation, forecast or any information supplied by any third-party.
DAX overbought pullback supported at 23970The DAX remains in a bullish trend, with recent price action indicating a potential overbought pullback within the broader uptrend.
Support Zone: 23970 – a key level from previous consolidation. Price is currently testing or approaching this level.
A bullish rebound from 23970 would confirm ongoing upside momentum, with potential targets at:
24490 – initial resistance
24580 – psychological and structural level
24770 – extended resistance on the longer-term chart
Bearish Scenario:
A confirmed break and daily close below 23970 would weaken the bullish outlook and suggest deeper downside risk toward:
23870 – minor support
23770 – stronger support and potential demand zone
Outlook:
Bullish bias remains intact while the Dax40 holds above 23970. A sustained break below this level could shift momentum to the downside in the short term.
This communication is for informational purposes only and should not be viewed as any form of recommendation as to a particular course of action or as investment advice. It is not intended as an offer or solicitation for the purchase or sale of any financial instrument or as an official confirmation of any transaction. Opinions, estimates and assumptions expressed herein are made as of the date of this communication and are subject to change without notice. This communication has been prepared based upon information, including market prices, data and other information, believed to be reliable; however, Trade Nation does not warrant its completeness or accuracy. All market prices and market data contained in or attached to this communication are indicative and subject to change without notice.

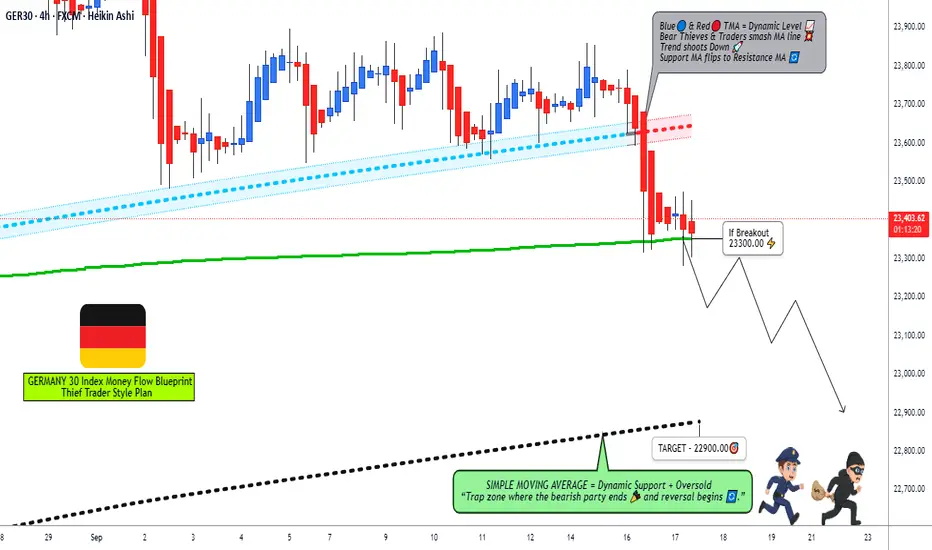
GER30 Trading Plan: Pending Orders, Breakout Levels, and Targets📉 GER30 (Germany Index) – Market Cash Flow Management Strategy 🏦
Hey Traders 👋,
Here’s a swing/day trade plan I’m watching on the GER30 (Germany Index). This setup is designed with a layered pending order strategy once confirmation hits.
🔑 Trading Plan
Bias: Bearish (waiting for sellers to breach the 4H Moving Average ✅ confirmation needed)
Entry Trigger: Breakout of MA @ 23300 ➝ after breakout confirmation, entries can be considered at different price levels.
Layered Entries (Sell Limits):
23500
23450
23400
23350
23300
(You can expand layering based on your own strategy)
⚠️ Important Note: Only activate sell limit layers after breakout confirmation. No confirmation = no entry.
🛑 Stop Loss
Suggested SL: 23650
But remember: risk management is personal! 🎯 Set your SL at your own comfort level.
🎯 Target
Exit Zone: 22900
Why? SMA acting as strong dynamic support, plus oversold conditions & potential liquidity traps.
Again ➝ this TP is optional. You’re in control of your profits. 💰
📌 Core Notes (Read Carefully!)
This plan uses multiple layered sell-limit entries (cash flow layering style).
Don’t jump in blindly! Wait for the moving average breach on 4H to confirm bearish momentum.
SL & TP are not recommendations, just references. Trade at your own risk.
🔗 Correlation / Related Pairs to Watch
FX:GER30 – Core instrument
XETR:DAX – Same Germany Index benchmark (futures)
FX:EURUSD – Often inversely correlated with DAX strength when EUR reacts to macro events
SP:SPX / CAPITALCOM:US30 – Global equity indices; U.S. flows can impact German equities
OANDA:XAUUSD – Gold as a hedge; risk-off flows sometimes push capital out of equities and into gold
Watching these pairs can give better context to the strength/weakness of GER30 📊.
✨ “If you find value in my analysis, a 👍 and 🚀 boost is much appreciated — it helps me share more setups with the community!”
#GER30 #DAX #Germany30 #IndexTrading #SwingTrading #DayTrading #TechnicalAnalysis #TradingStrategy #StockIndices #MarketFlow
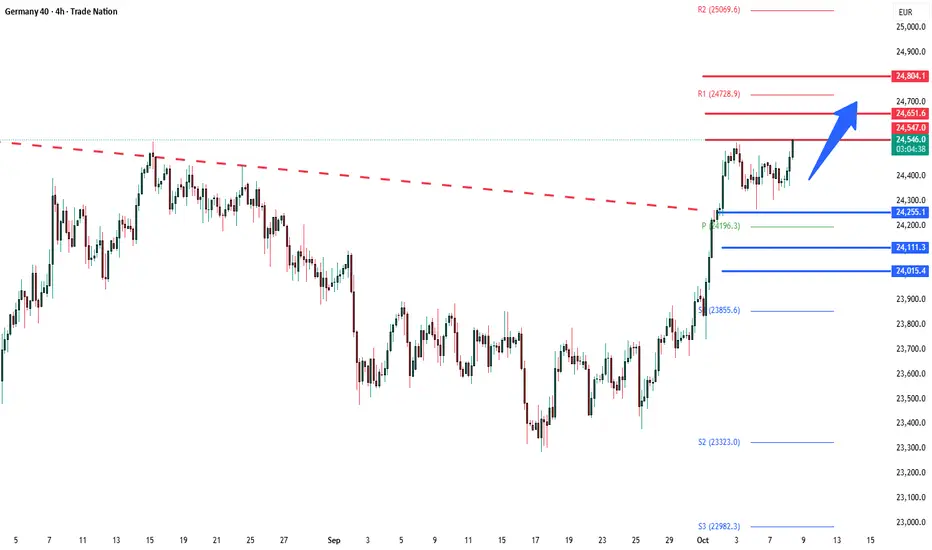
DAX Bullish continuation breakout ahead?The DAX remains in a bullish trend, with recent price action indicating a potential overbought pullback within the broader uptrend.
Support Zone: 24250 – a key level from previous consolidation. Price is currently testing or approaching this level.
A bullish rebound from 24250 would confirm ongoing upside momentum, with potential targets at:
24550 – initial resistance
24650 – psychological and structural level
24800 – extended resistance on the longer-term chart
Bearish Scenario:
A confirmed break and daily close below 24250 would weaken the bullish outlook and suggest deeper downside risk toward:
24100 – minor support
24000 – stronger support and potential demand zone
Outlook:
Bullish bias remains intact while the Dax40 holds above 24250. A sustained break below this level could shift momentum to the downside in the short term.
This communication is for informational purposes only and should not be viewed as any form of recommendation as to a particular course of action or as investment advice. It is not intended as an offer or solicitation for the purchase or sale of any financial instrument or as an official confirmation of any transaction. Opinions, estimates and assumptions expressed herein are made as of the date of this communication and are subject to change without notice. This communication has been prepared based upon information, including market prices, data and other information, believed to be reliable; however, Trade Nation does not warrant its completeness or accuracy. All market prices and market data contained in or attached to this communication are indicative and subject to change without notice.
DAX40 Bullish breakout sideways consolidation supported at 24255The DAX remains in a bullish trend, with recent price action indicating a potential overbought pullback within the broader uptrend.
Support Zone: 24250 – a key level from previous consolidation. Price is currently testing or approaching this level.
A bullish rebound from 24250 would confirm ongoing upside momentum, with potential targets at:
24550 – initial resistance
24650 – psychological and structural level
24800 – extended resistance on the longer-term chart
Bearish Scenario:
A confirmed break and daily close below 24250 would weaken the bullish outlook and suggest deeper downside risk toward:
24100 – minor support
24000 – stronger support and potential demand zone
Outlook:
Bullish bias remains intact while the Dax40 holds above 24250. A sustained break below this level could shift momentum to the downside in the short term.
This communication is for informational purposes only and should not be viewed as any form of recommendation as to a particular course of action or as investment advice. It is not intended as an offer or solicitation for the purchase or sale of any financial instrument or as an official confirmation of any transaction. Opinions, estimates and assumptions expressed herein are made as of the date of this communication and are subject to change without notice. This communication has been prepared based upon information, including market prices, data and other information, believed to be reliable; however, Trade Nation does not warrant its completeness or accuracy. All market prices and market data contained in or attached to this communication are indicative and subject to change without notice.

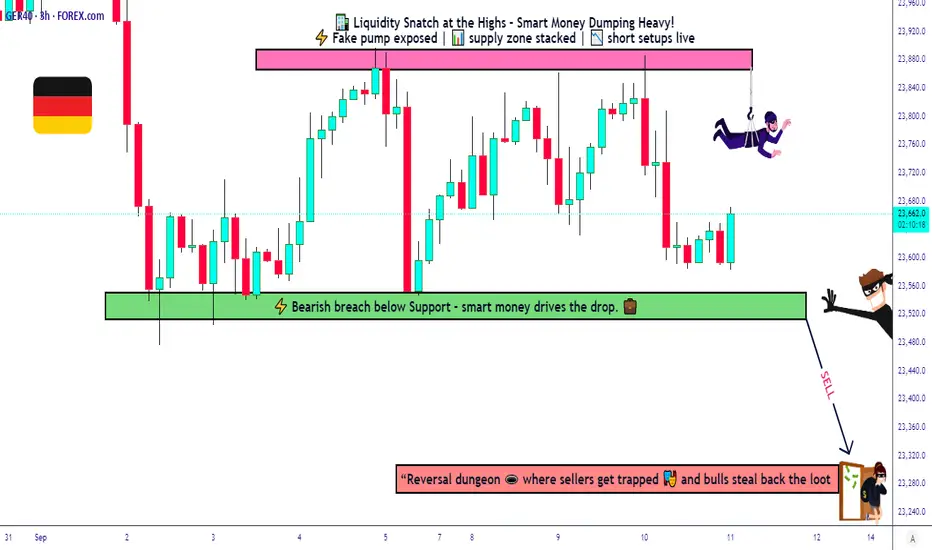
Germany 40 – Bearish Outlook with ECB and US CPI in Focus🔥 Steal Profits with the Thief Strategy: Germany 40 CFD Bearish Setup 🚨
Asset: Germany 40 Index CFD (DAX)Trade Type: Swing/Scalping (Bearish Pending Order Plan)Date: September 11, 2025Current Price: 23,632.95 (-0.36% daily change)
💰 The Thief Strategy: Layered Precision for Profits
The Thief Strategy is all about stealing profits with disciplined, layered sell limit orders. By targeting the 23,500 support zone breakout, we capitalize on bearish momentum with precision. This setup is perfect for scalpers and swing traders looking to ride the wave of macro-driven volatility. Set your TradingView alarms to catch the breakout! 🚨
🔹 Why This Works?
Technical Edge: Price rejection at 23,800 + overbought RSI signals a potential drop.
Macro Triggers: ECB policy (11 Sept) and US CPI data could fuel bearish moves.
Sentiment: Fear-driven hedging and sector rotation (defense/energy outperforming tech).
📊 Market Snapshot (11 Sept 2025)
Daily Change: -85.50 (-0.36%)
52-Week Range: 18,382.26 - 24,639.10
1-Year Performance: +29.38%
😨 Sentiment & Fear/Greed Index
Retail Traders: 🟡 Cautious
Mixed earnings: Siemens Energy (+4.57%), Rheinmetall (+3.29%) vs. SAP (-2.87%), Deutsche Telekom (-2.16%).
Eyes on ECB policy and US CPI data.
Institutional Traders: 🟠 Neutral to Slightly Bearish
Defensive moves in chemicals/financials.
Higher put/call ratios in options show hedging.
Fear & Greed Index: Fear
Elevated volatility from ECB/US data uncertainty.
Bonds slightly outperforming stocks short-term.
📉 Fundamental & Macro Score
Economic Data:
German Inflation (Aug 2025): 2.2%
Interest Rate: 2.15%
Unemployment: 6.3%
Score: 6/10 (Neutral)
Corporate Performance:
Top Gainers: Siemens Energy, Rheinmetall
Top Losers: SAP, Deutsche Telekom
Score: 5/10 (Mixed)
Global Risks:
EU tariff pressures (India/China).
French political uncertainty.
Score: 4/10 (Slightly Negative)
🐻 Overall Market Outlook
Short-Term: Bearish
Resistance at 23,800; downside risk if ECB delays rate cuts or US CPI spikes.
Medium-Term: Neutral
YoY +27.76%, but momentum slowing.
Q3 2025 forecast: 23,412.92 (Trading Economics).
🎯 Thief Strategy: Bearish Layering Plan
🔹 Entry (Pending Sell Limit Orders):
Layer 1: 23,650
Layer 2: 23,600
Layer 3: 23,550
Layer 4: 23,500 (Key Breakout Level ⚡)
Pro Tip: Add more layers based on your risk tolerance. Confirm entry after a 23,500 breakout. Set a TradingView alarm at 23,500 to stay sharp!
🔹 Stop Loss (SL):
Place at 23,750 after breakout confirmation.
Note: Dear Thief OG’s, adjust SL based on your strategy and risk. I’m not your boss—manage your risk, steal the profits! 💸
🔹 Take Profit (TP):
Target 23,300 (strong support + oversold zone + potential bear trap).
Note: Escape with your loot at your discretion. My TP is a guide—take profits at your own risk!
🔹 Risk Management:
Risk 1-2% per trade.
Use trailing stops during high-volatility events (e.g., ECB, US CPI).
Avoid new trades during major news to dodge whipsaws.
🔑 Key Levels to Watch
Resistance: 23,800 (immediate), 24,100 (strong).
Support: 23,500 (breakout zone), 23,300 (target), 23,200 (deeper support).
Breakout Confirmation: Daily close below 23,500 signals bearish continuation.
🌍 Related Pairs to Watch ( AMEX:USD )
FX:EURUSD ($): Bearish DAX may align with a stronger USD if US CPI surprises. Watch 1.1578 (current), support at 1.1254.
FX:GBPUSD ($): Bullish at 1.3581; DAX drop could pressure GBP on risk-off sentiment.
FX:USDJPY ($): Bearish correction at 144.09; monitor for risk-off flows impacting DAX.
📰 Key Events to Monitor
ECB Announcement (11 Sept): Delayed rate cuts could push DAX lower.
US CPI Data (11 Sept): Higher inflation may trigger global risk-off moves.
Sector Rotation: Defense/energy (e.g., Rheinmetall) outperforming tech (e.g., SAP).
🚀 Why This Setup Steals the Show
The Thief Strategy is built for precision and adaptability. Layered entries at 23,650–23,500 let you exploit the breakout with confidence, backed by macro signals (ECB, US CPI) and technical rejection at 23,800. This setup is designed to maximize engagement and visibility for scalpers and swing traders. Let’s steal those profits together! 💰
✨ If you find value in my analysis, a 👍 and 🚀 boost is much appreciated — it helps me share more setups with the community!
#DAX #Germany40 #ThiefStrategy #Bearish #TradingView #Scalping #SwingTrading #ECB #USCPI
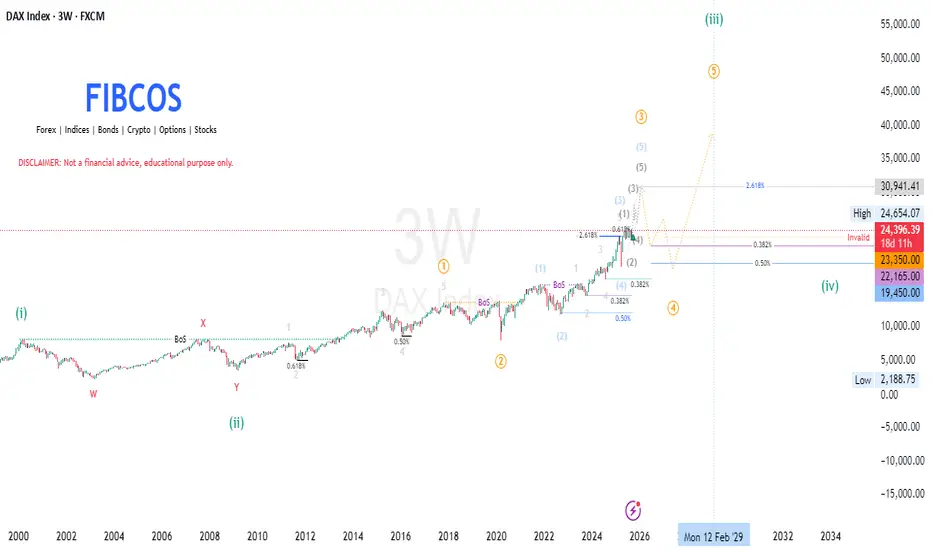
DAX INDEX | Elliott Wave + SMC + Fib + Market CycleDAX INDEX | Super Cycle Wave (3) In Progress | Micro Wave (iv) Correction Expected | Elliott Wave + SMC + Fib + Market Cycle
This macro outlook on the DAX Index (GER40) combines Elliott Wave Theory , Smart Money Concepts (SMC) , and Fibonacci Analysis , tracking the long-term price structure from the 1990s into the expected 2029 Super Cycle top .
We are currently nearing the completion of Micro Wave (iii) inside Super Cycle Wave (3) , with a correction expected as Micro Wave (iv) before a final leg Wave (v) to complete the 20-year Super Cycle advance.
🌀 SUPER CYCLE STRUCTURE (Wave Count Recap)
🔵 Supercycle Wave (1)
📈 Topped in 2000
📐 Five-wave impulse from early 90s
💡 Marked the first major peak of the new macro bull cycle
🔴 Super Cycle Wave (2)
🕰 2000–2009
📉 Multi-year W-X-Y complex correction
🔻 Pulled back to 0.618 retracement of Wave (1)
📍 Bottomed Jan–Feb 2009 — Smart Money accumulation zone
🚀 Supercycle Wave (3) — Now in Progress (2009–2029 Target)
This is a multi-decade impulse wave , subdividing into Micro Waves (i) through (v) .
🟠 Micro Wave (i)
🕰 2009–2018
✅ Clean 5-wave impulsive structure
🔓 Broke above Super Cycle Wave (1) high
📊 Confirmed initiation of Wave (3)
🟠 Micro Wave (ii)
🕰 2018–2020 (COVID crash)
🔻 Pulled back to 0.50 retracement of Wave (i)
📦 Retested key order blocks
💧 Liquidity swept beneath 2016–2018 lows
📈 Smart Money reaccumulation before major expansion
🟠 Micro Wave (iii) — Currently Unfolding
🕰 2020 – Expected top by end of 2025 or early 2026
🚀 Strongest wave in the structure
🔼 Targeting 2.618 Fibonacci extension of Wave (i)
🎯 Target zone: 30,941 (~32K)
📊 Multiple internal impulses have formed
🧠 Price delivery:
Consistent BoS
Minimal retracement
No parabolic blow-off yet → confirming institutional flow
🟠 Micro Wave (iv) — Correction Expected Next
🕰 Expected: 2026 to early 2027
🔻 Projected retracement:
0.382 – 0.5 of Wave (iii)
Target zone: 23,350 – 22,165
💧 Confluence with:
Sell-side liquidity pools
Prior OBs and imbalance zones
⚠️ Reaccumulation phase likely before final rally
🟠 Micro Wave (v) — Final Advance to Complete Supercycle Wave (3)
🕰 Expected top by 2029
🎯 Target range: Above 32,000, possibly toward 35,000+ depending on extensions
🔄 Will mark the peak of Supercycle Wave (3)
📉 Anticipate a major correction in Supercycle Wave (4) after that
📐 FIBONACCI LEVELS OF INTEREST
Structure Key Fib Levels
Supercycle (2) 0.618 retracement of (1)
Micro Wave (ii) 0.50 retracement of (i)
Micro Wave (iii) 2.618 extension of (i) → 30,941–32K
Micro Wave (iv) 0.382–0.5 retracement → 23,350–22K
Micro Wave (v) Possible extension to 38K+
🧠 SMART MONEY CONCEPTS (SMC)
🔓 Break of Structure (BoS) confirmed trend shifts at Wave (i), (ii), and internal impulses
📦 Order Blocks respected at retracement zones (2020 low, 2022 correction)
💧 Liquidity Grabs below previous lows fuel impulsive breakouts
🧱 Price Delivery = Institutional — no euphoric parabolas yet
🎯 Expect engineered liquidity sweep before Wave (iv) reaccumulation
📌 CONCLUSION
We are now nearing the completion of Micro Wave (iii) inside Super Cycle Wave (3) of the DAX. Price is approaching major extension targets (30,941–32,000), from where Wave (iv) correction is due.
This pullback (2026–2027) is expected to offer high-probability re-accumulation opportunities within a Smart Money demand zone before the final macro rally to new ATHs into 2029.
⚠️ After 2029 , expect a larger Supercycle Wave (4) correction phase.
📘 DISCLAIMER: This is a structural, educational market outlook. Not financial advice. Please do your own due diligence and risk management.
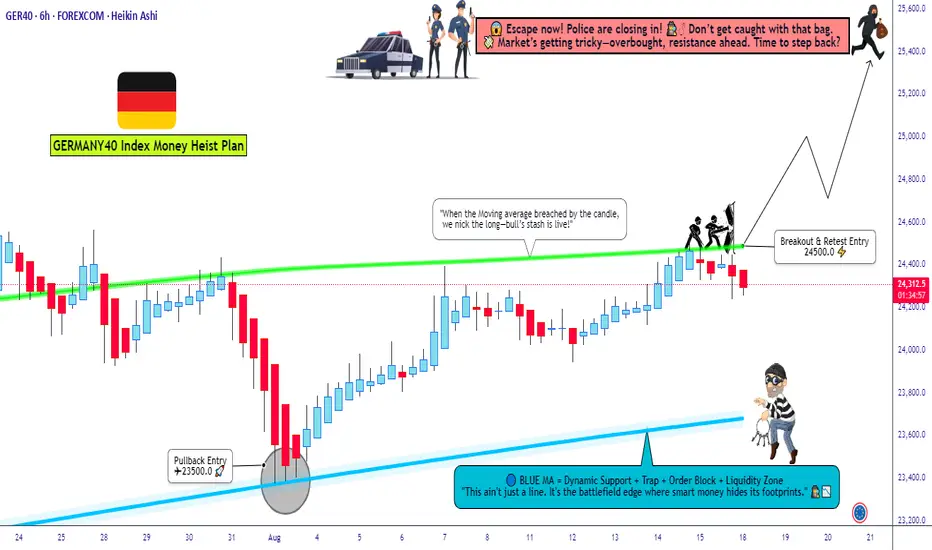
Breakout Alert! Germany 40 Targeting 25400 – Join the Robbery⚡GERMANY 40 INDEX CFD HEIST PLAN⚡
💸 Thief Trader Robbery Blueprint 💸
🎭 Dear Ladies & Gentleman, my Thief OG’s 🕶️🕵️♂️,
Welcome to another market heist – this time we’re targeting the GERMANY 40 INDEX CFD vault!
🚀 Plan: Bullish Breakout Robbery
The lock is weak around 24,500.0 ⚡ – once that vault door cracks open, we raid in style with layer entries.
🔑 Thief Layer Entry Method:
📍 First entry on breakout @ 24,500.0
📍 Layer extra buy limits @ 24,400.0 / 24,300.0 / 24,200.0 (stack your orders like pro robbers 😈)
👉 You can increase your layers depending on your appetite for stolen cash 💰.
🛑 Stop Loss (SL):
This is the Thief SL → @ 24,000.0 after breakout confirmation.
📌 Adjust your SL with caution, OG’s, depending on your risk & strategy. Protect the loot at all costs 🏴☠️.
🎯 Target (TP):
⚠️ Police barricade spotted @ 25,500.0 🚔🚨
👉 Escape before the sirens – cash out at 25,400.0 and vanish with the bags 🎒💸.
🏆 Thief Trader Reminder
📌 Stick to the layering strategy – multiple entries spread like a thief’s toolkit.
📌 Manage risk like a pro robber – don’t get caught with greedy hands.
📌 Escape clean – profit secured before the market traps you!
🔥💎 Support the Thief Gang by smashing that Boost Button 💥
Let’s keep robbing the markets together – smooth, stylish, and profitable.
Every heist, every day – Thief Trading Style. 🏆🕶️💰🚀
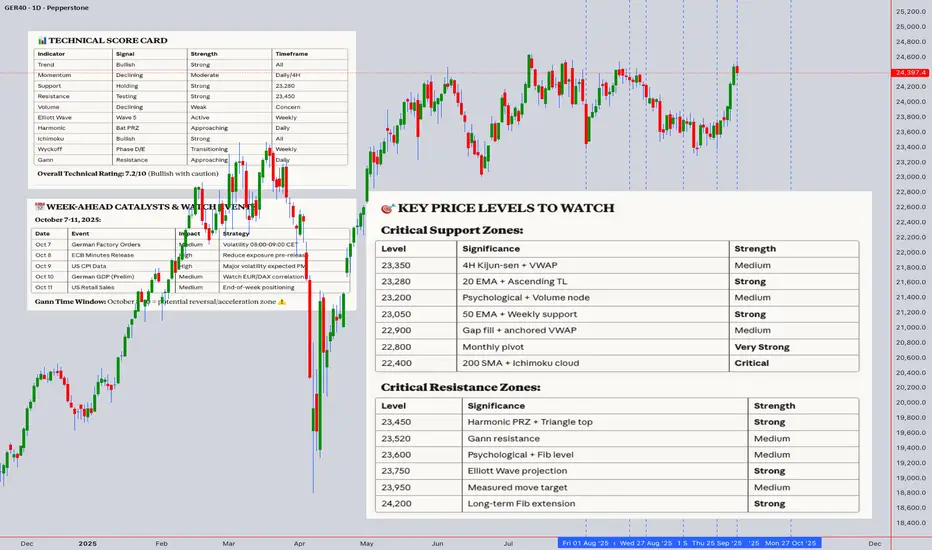
GER40 (DAX40) Technical Analysis & Trading OutlookCurrent Price: 23,397.40 | 4th October 2025, 12:54 AM UTC+4
📊 MARKET OVERVIEW & STRUCTURAL ANALYSIS
The DAX40 is trading near all-time highs, displaying robust bullish momentum following the breakout above 23,000. The index is currently in a consolidation phase after an extended rally, suggesting potential for either continuation or a corrective pullback.
Key Market Context:
Trend Structure: Primary uptrend intact across all major timeframes
Market Phase: Late-stage expansion with decreasing momentum divergence
Volatility: Moderate; Bollinger Bands showing compression on 4H/Daily charts
Volume Profile: Declining volume on recent highs suggests potential exhaustion
🎯 MULTI-TIMEFRAME ANALYSIS
MONTHLY CHART - Long-term Perspective
Elliott Wave Count: Currently in Wave 5 of a larger impulse structure from 2022 lows
Gann Analysis: Price approaching the 1x2 Gann angle from the 2022 pivot; resistance expected at 23,450-23,500
Ichimoku Cloud: Trading well above the Kumo; Tenkan-sen/Kijun-sen bullish crossover sustained
Key Support: 22,800 (monthly pivot) | 22,400 (cloud base)
Key Resistance: 23,500 (Gann resistance) | 23,850 (Wave 5 projection target)
WEEKLY CHART - Swing Trading Perspective
Pattern Recognition: Potential Bull Flag formation developing (consolidation after strong rally)
Wyckoff Analysis: Phase D (markup) transitioning to possible Phase E (redistribution)
RSI: 67.2 - approaching overbought territory but not yet extreme
VWAP (Anchored from Jan 2025): 22,950 - price trading above, bullish bias confirmed
Volume Analysis: Decreasing volume on upswings suggests weakening buying pressure
DAILY CHART - Swing & Position Trading
Harmonic Pattern: Potential Bat Pattern completion zone: 23,450-23,550 (PRZ)
Head & Shoulders Watch: No clear reversal pattern yet, but right shoulder formation risk if rejection occurs above 23,500
Bollinger Bands: Price at upper band (23,420); squeeze pattern suggests breakout/breakdown imminent
Moving Averages:
20 EMA: 23,280 (immediate support)
50 EMA: 23,050 (critical support)
200 SMA: 22,400 (long-term trend support)
RSI: 64.8 - neutral to slightly overbought
MACD: Bullish but histogram showing declining momentum
4-HOUR CHART - Intraday/Swing Bridge
Trend: Short-term consolidation within ascending channel
Ichimoku: Price above cloud; flat Kijun-sen at 23,350 = pivot zone
VWAP: 23,365 - current price trading slightly above, marginally bullish
Support Levels: 23,350 | 23,280 | 23,200
Resistance Levels: 23,450 | 23,520 | 23,600
Pattern: Ascending Triangle forming between 23,280 support and 23,450 resistance
1-HOUR CHART - Intraday Focus
Candlestick Pattern: Indecision candles (doji/spinning tops) suggesting hesitation
RSI: 58.4 - neutral zone
Bollinger Bands: Mid-band at 23,370; price oscillating around mean
Volume: Below average - lack of conviction
Gann Square of 9: Next resistance at 23,445 (45° from current pivot)
15-MINUTE & 5-MINUTE CHARTS - Scalping
Micro Structure: Range-bound between 23,370-23,420
VWAP: Acting as dynamic support/resistance at 23,385
Volume Spikes: Watch for breakout confirmation with volume >120% of 20-period average
RSI (15M): Oscillating between 45-60 (neutral range)
🔍 CRITICAL TECHNICAL SIGNALS
Bullish Indicators:
✅ Price above all major moving averages (20/50/200 EMA)
✅ Ichimoku Cloud bullish alignment across all timeframes
✅ Higher lows pattern maintained since September
✅ Golden Cross intact (50 EMA > 200 EMA)
✅ Volume-weighted averages showing institutional support
Bearish Warning Signs:
⚠️ Declining volume on rallies (distribution concern)
⚠️ RSI bearish divergence forming on 4H/Daily charts
⚠️ Approaching Gann resistance and harmonic PRZ
⚠️ MACD histogram declining (momentum weakening)
⚠️ Potential Bull Trap risk if rejection occurs above 23,450
Neutral/Watch Factors:
🔶 Bollinger Band squeeze on daily chart (breakout pending)
🔶 Wyckoff redistribution signs require confirmation
🔶 No clear Head & Shoulders pattern yet (monitoring right shoulder)
📈 INTRADAY TRADING STRATEGY (Next 5 Trading Days)
SCENARIO A: BULLISH BREAKOUT (Probability: 45%)
Trigger: Break and hold above 23,450 with volume confirmation
Entry Points:
Aggressive: 23,455 (immediate breakout)
Conservative: 23,470 (retest of breakout level)
Targets:
T1: 23,520 (short-term resistance)
T2: 23,600 (Gann 1x1 angle)
T3: 23,750 (measured move from triangle)
Stop Loss:
Below 23,350 (4H Kijun-sen)
Time Frames: 5M, 15M, 1H entries | Hold 4H-Daily for swing
Risk:Reward: Minimum 1:2.5
SCENARIO B: RANGE-BOUND CONSOLIDATION (Probability: 35%)
Range: 23,280 - 23,450
Long Entries:
23,280-23,300 (lower range support + 20 EMA)
23,350-23,365 (4H pivot + VWAP)
Short Entries:
23,430-23,450 (upper range resistance)
23,520-23,535 (false breakout rejection)
Targets:
Range midpoint: 23,365
Opposite range boundary
Stop Loss:
Longs: Below 23,250 (range invalidation)
Shorts: Above 23,480 (breakout confirmed)
Strategy: Mean reversion scalping on 15M/1H charts
SCENARIO C: BEARISH CORRECTION (Probability: 20%)
Trigger: Break and close below 23,280 (20 EMA + ascending trendline)
Short Entry Points:
Aggressive: 23,275 (break confirmation)
Conservative: 23,300 (retest as resistance)
Targets:
T1: 23,200 (minor support)
T2: 23,050 (50 EMA + psychological level)
T3: 22,900 (weekly VWAP + gap fill)
Stop Loss:
Above 23,370 (failed breakdown)
Confirmation Signals:
RSI breaking below 50
MACD bearish crossover on 1H/4H
Volume surge on breakdown
📊 SWING TRADING STRATEGY (1-4 Weeks Outlook)
BULLISH SWING SCENARIO
Entry Zone: 23,200-23,280 (pullback to 20 EMA support)
Position Sizing: Build in 3 tranches
40% at 23,280
30% at 23,200
30% at 23,050 (if deeper correction)
Targets:
T1: 23,750 (Elliott Wave 5 target - partial profit 40%)
T2: 23,950 (Measured move + Gann extension - 30%)
T3: 24,200 (Fibonacci 1.618 extension - runner 30%)
Stop Loss: Below 22,950 (daily close basis)
Hold Duration: 2-4 weeks
Ideal Setup:
Bullish engulfing candle on daily chart at support
RSI bounce from 40-45 zone
Volume increase on bounce
BEARISH SWING SCENARIO (Hedge/Counter-trend)
Entry Zone: 23,480-23,550 (harmonic PRZ + Gann resistance)
Confirmation Required:
Bearish reversal candlestick (shooting star, evening star)
RSI bearish divergence
MACD bearish crossover on daily chart
Break below 23,350 on closing basis
Targets:
T1: 23,050 (50 EMA - 40% cover)
T2: 22,800 (monthly pivot - 35% cover)
T3: 22,400 (200 SMA + cloud base - final 25%)
Stop Loss: Above 23,650 (daily close)
Risk Management: Tight stops; favor bullish bias unless clear reversal
⚡ ELLIOTT WAVE ANALYSIS
Current Count:
Primary Wave: Wave 5 of larger impulse from 2022 lows
Intermediate Wave: Subwave 5 of Wave 5 (terminal phase)
Minor Wave: Possible wave (iv) consolidation completing
Wave Projections:
Wave 5 Target (Equal legs): 23,750-23,800
Wave 5 Target (1.618 extension): 24,150-24,250
Corrective Wave A Target (if reversal): 22,800-22,900
Wave C Target (full correction): 22,200-22,400
Key Insights:
Wave structure suggests uptrend continuation likely
Terminal wave characteristics: decreasing momentum, longer time
Watch for five-wave completion signals near 23,750-24,000 zone
🔮 GANN ANALYSIS
Square of 9 (from 23,000 pivot):
45° Resistance: 23,445 ⚠️ (approaching)
90° Resistance: 23,667
180° Major Resistance: 24,000 (psychological confluence)
45° Support: 23,111
90° Support: 22,889
Gann Angles (from September 2024 low):
1x1 Angle: Currently at 23,580 (equilibrium)
1x2 Angle: 23,450 (major resistance) ⚠️
2x1 Angle: 23,100 (support)
Time Cycles:
Next significant Gann time window: October 8-10, 2025 (21 trading days from last pivot)
Potential reversal/acceleration zone
Price & Time Squaring:
Price at 23,400 squares with October 7th time projection
Suggests potential turning point early next week
🌊 ICHIMOKU KINKO HYO ANALYSIS
Current Status (Daily Chart):
Tenkan-sen (Conversion): 23,350 (flat = consolidation)
Kijun-sen (Base): 23,280 (critical support)
Senkou Span A: 23,100
Senkou Span B: 22,850
Chikou Span: Above price (bullish confirmation)
Cloud Analysis:
Price well above cloud = Strong Bull Trend
Cloud thickness = robust support structure
Future cloud (26 periods ahead) shows slight thinning = potential volatility increase
Key Signals:
TK Cross: Tenkan approaching Kijun from above (watch for bearish cross)
Price vs Kijun: Trading above = bullish, but proximity suggests correction risk
Chikou Span: Clear of price = trend continuation likely
Ichimoku Trading Signals:
Buy Signal: Pullback to 23,280-23,300 (Kijun support) with bullish rejection
Sell Signal: Daily close below Kijun (23,280) with bearish TK cross
Strongest Support: Cloud base at 22,850-23,100
📉 WYCKOFF MARKET CYCLE ANALYSIS
Current Phase Assessment: Late Phase D (Markup) / Early Phase E Watch
Characteristics Observed:
Accumulation (Complete): Built solid base 22,000-22,500 (July-August)
Markup Phase D: Strong advance from 22,500 to 23,400 (September-October)
Distribution Signs (Emerging):
Declining volume on rallies
Buying Climax (BC) potential near 23,500
Automatic Reaction (AR) risk if sharp rejection occurs
Secondary Test (ST) of supply likely
Wyckoff Price Levels:
Creek: 22,900-23,000 (major demand zone)
Spring Potential: 23,480-23,550 (if false breakout occurs)
Sign of Weakness (SOW): Break below 23,200 would signal distribution
Trading Implications:
If Markup Continues: Target 23,750-24,000 (Phase E)
If Distribution Begins: First support 23,000-23,050, major 22,800
Volume Confirmation Critical: Breakouts require 30%+ above average volume
Composite Operator Behavior:
Likely testing supply at current levels
Watch for shake-out below 23,280 to trap weak longs
Absorption of supply above 23,450 needed for continuation
🎪 HARMONIC PATTERN ANALYSIS
Active Pattern: Potential Bat Pattern Completion
Pattern Structure:
X: 22,450 (September low)
A: 23,150 (interim high)
B: 22,850 (retracement)
C: 23,350 (rally)
D (PRZ): 23,450-23,550 (reversal zone) ⚠️
Fibonacci Ratios:
AB: 0.382-0.500 retracement of XA ✓
BC: 0.382-0.886 retracement of AB ✓
CD: 1.618-2.618 extension of BC (target: 23,480-23,550)
XD: 0.886 retracement of XA (23,520) ⚠️
Trading Strategy:
Bearish Reversal Zone: 23,450-23,550
Entry: Short on bearish reversal confirmation in PRZ
Targets (if pattern activates):
38.2% CD: 23,200
61.8% CD: 22,950
100% CD: 22,650
Stop Loss: Above 23,600 (pattern invalidation)
Alternative Patterns:
Bullish Butterfly target at 23,750 if breakout sustains above 23,550
Gartley Pattern support at 23,050 on any correction
📊 INDICATOR SYNTHESIS
RSI (Relative Strength Index):
Daily: 64.8 (neutral/slightly overbought)
4H: 61.2 (neutral)
1H: 58.4 (neutral)
Divergence: Bearish divergence forming on 4H/Daily (price higher highs, RSI lower highs) ⚠️
Key Levels:
Overbought: >70 (not yet extreme)
Oversold: <30 (correction target)
Support: 50 level = trend strength gauge
Bollinger Bands:
Daily: Squeeze pattern (low volatility = breakout imminent)
4H: Price at upper band (23,420) = short-term extended
Bandwidth: Narrowing significantly = explosive move coming (direction TBD)
Strategy: Wait for band break + close outside, then enter in direction of break
VWAP Analysis:
Session VWAP: 23,385 (dynamic pivot)
Weekly VWAP: 23,290 (critical support)
Anchored VWAP (Jan 2025): 22,950 (major support)
Volume Profile: Highest volume node at 23,300-23,350 (strong support/resistance flip zone)
Moving Average Confluence:
20 EMA: 23,280 (immediate support)
50 EMA: 23,050 (medium-term support)
200 SMA: 22,400 (long-term trend)
Alignment: Bullish across all timeframes
Golden Cross: Active since August 2024 (50>200) = long-term bullish
MACD (Moving Average Convergence Divergence):
Daily: Bullish, but histogram declining (momentum loss)
4H: Approaching zero line (neutral)
Signal: Watch for bearish crossover on 4H as early reversal warning
Divergence: Confirming RSI bearish divergence on daily chart
🚨 TRAP IDENTIFICATION & AVOIDANCE
BULL TRAP Risk (HIGH ALERT): ⚠️⚠️⚠️
Scenario: False breakout above 23,450-23,500 followed by sharp reversal
Warning Signs:
Breakout with declining volume (no conviction)
Quick spike to 23,500-23,550 with long upper wicks
Inability to hold above 23,450 for more than 2 hours (1H chart)
RSI divergence + MACD histogram declining
Break below 23,350 after failed breakout
Protection Strategy:
Wait for retest of breakout level before entering longs
Require volume confirmation (>120% of 20-period average)
Set tight stops below 23,380 if entering on breakout
Reduce position size by 50% if entering in potential trap zone
Bull Trap Target (if triggered): 23,000-23,050 (trap participants' stops)
BEAR TRAP Risk (LOW-MODERATE):
Scenario: False breakdown below 23,280 followed by sharp recovery
Warning Signs:
Break on low volume
Quick recovery above 23,280 within 1-2 candles
Strong bullish reversal candlestick at support
RSI showing bullish divergence at lower levels
Protection Strategy:
Wait for daily close below 23,250 before aggressive shorts
Watch for volume confirmation on breakdown
Be ready to cover shorts if price reclaims 23,300 quickly
Don't short against major support zones without confirmation
🌍 MARKET CONTEXT & EXTERNAL FACTORS
Macroeconomic Considerations:
ECB Policy: Dovish stance supporting equity markets
German Economy: Manufacturing PMI showing signs of stabilization
EUR/USD: Correlation with DAX; watch 1.08-1.10 zone
US Markets: S&P 500 correlation strong; US data impacts DAX sentiment
Geopolitical: Middle East tensions = safe-haven flows (moderate risk)
Earnings Season:
German corporate earnings (October) = potential volatility catalyst
DAX constituent reporting: watch for sector rotation
Seasonal Patterns:
October historically volatile for European indices
End-of-month portfolio rebalancing (October 31st) = potential volatility
Volatility Indicators:
VDAX (DAX volatility): Currently moderate ~15-16
Complacency risk if volatility spikes above 18
🎯 COMPREHENSIVE TRADING PLAN
INTRADAY TRADERS (5M - 1H Charts):
Monday-Wednesday Outlook:
Primary Strategy: Range trading between 23,280-23,450
Scalp Zones:
Buy: 23,300-23,320 | Target: 23,380-23,400 | Stop: 23,275
Sell: 23,430-23,450 | Target: 23,370-23,350 | Stop: 23,475
Thursday-Friday Outlook:
Breakout Watch: Decision time for triangle pattern
If Bullish: Long 23,460+ | Target: 23,550 | Trail stop
If Bearish: Short <23,270 | Target: 23,150 | Stop: 23,320
Risk Management:
Maximum 1% risk per trade
2:1 minimum risk:reward
No more than 3 active positions simultaneously
Daily loss limit: 2% of account
SWING TRADERS (4H - Daily Charts):
PRIMARY SETUP: Buy the Dip
Entry Zone: 23,200-23,280 (expect pullback next week)
Confirmation: Bullish engulfing or hammer on daily chart
Position Size: 2-3% risk per trade
Targets: 23,750 (T1) | 24,000 (T2) | 24,250 (T3)
Stop Loss: 22,950 (daily close basis)
Time Horizon: 2-4 weeks
SECONDARY SETUP: Breakout Long
Entry: Break and hold above 23,480 (daily close)
Confirmation: Volume >1.5x average + consecutive closes above
Targets: 23,750 | 24,000 | 24,300
Stop Loss: 23,350
Hold: Trail stop to 20 EMA on daily chart
HEDGE SETUP: Short from Resistance
Entry: 23,500-23,550 with reversal confirmation
Confirmation: Shooting star + RSI divergence + MACD cross
Targets: 23,200 | 23,050 | 22,800
Stop Loss: 23,650 (strict)
Position Size: 50% of normal (counter-trend)
POSITION TRADERS (Weekly - Monthly Charts):
Long-Term Bullish Thesis:
Entry Strategy: Accumulate on corrections to 23,000-23,200
Core Position: Build over 2-3 weeks
Targets:
24,000 (3-month target)
24,500 (6-month target)
25,000 (12-month psychological)
Stop Loss: Weekly close below 22,600
Rationale: Elliott Wave 5 completion + breakout from multi-year consolidation
Portfolio Allocation:
60% long exposure at current levels
20% cash for pullback buying
20% hedges if approaching 23,800-24,000 zone
🔔 ALERT LEVELS & NOTIFICATIONS
Critical Price Alerts to Set:
✅ 23,480 (Breakout level - LONG signal)
✅ 23,450 (Harmonic PRZ - Watch for reversal)
✅ 23,350 (4H support - Breakdown warning)
✅ 23,280 (Daily 20 EMA - CRITICAL support)
✅ 23,200 (Buy zone activation)
✅ 23,050 (50 EMA - Major support test)
✅ 22,950 (Stop loss trigger for swings)
Indicator Alerts:
RSI crossing 70 (overbought) or 50 (weakness)
MACD bearish crossover on 4H/Daily
Bollinger Band break (either direction)
Volume spike >150% of average
📌 CONCLUSION & BIAS
Overall Bias: CAUTIOUSLY BULLISH 🟢 (60% probability)
Bullish Case (60%):
The primary trend remains intact with price above all major moving averages and strong cloud support. The consolidation near highs is healthy, and a resolution to the upside targeting 23,750-24,000 is the path of least resistance. Elliott Wave structure suggests one more push higher to complete Wave 5.
Bearish Case (20%):
Declining volume, RSI divergence, and approach of major resistance (Gann, harmonic PRZ) suggest caution. A failed breakout above 23,500 could trigger a correction to 23,000-22,800. Wyckoff distribution signs require monitoring.
Neutral/Range Case (20%):
Continued consolidation between 23,200-23,500 for 1-2 weeks is possible as the market digests recent gains and awaits economic catalysts.
Best Trading Approach:
Intraday: Range trade 23,280-23,450 until breakout
Swing: Wait for pullback to 23,200-23,280 for optimal risk:reward longs
Position: Maintain core long exposure with stops below 22,800
Key Success Factors:
Patience: Wait for high-probability setups at defined levels
Discipline: Honor stop losses without exception
Flexibility: Adapt to price action; market is always right
Confirmation: Require volume and indicator alignment before major trades
🎓 FINAL RECOMMENDATIONS
For Aggressive Traders:
Trade both sides of the range
Quick profits (50-100 points)
Tight stops (50-80 points)
High frequency (5-10 trades/week)
For Conservative Traders:
Wait for 23,200-23,280 pullback
Larger position size with better risk:reward
Wider stops (150-200 points)
Target 23,750+ for 1:3+ reward
Low frequency (1-2 trades/month)
For Long-Term Investors:
Accumulate on any dip toward 23,000
Hold through minor volatility
Target 24,500+ over 3-6 months
Stop only on weekly close <22,600
Disclaimer: This analysis is for educational purposes only and should not be construed as financial advice. Trading involves substantial risk of loss. Always conduct your own research and consult with a licensed financial advisor before making investment decisions. Past performance does not guarantee future results.
Bearish reversal off swing high resistance?DAX40 (DE40) is reacting off the pivot, which has been identified as a multi swing high resistance and could reverse to the 1st support.
Pivot: 24,550.50
1st Support: 24,231.02
1st Resistance: 24,660.54
Disclaimer:
The above opinions given constitute general market commentary, and do not constitute the opinion or advice of IC Markets or any form of personal or investment advice.
Any opinions, news, research, analyses, prices, other information, or links to third-party sites contained on this website are provided on an "as-is" basis, are intended only to be informative, is not an advice nor a recommendation, nor research, or a record of our trading prices, or an offer of, or solicitation for a transaction in any financial instrument and thus should not be treated as such. The information provided does not involve any specific investment objectives, financial situation and needs of any specific person who may receive it. Please be aware, that past performance is not a reliable indicator of future performance and/or results. Past Performance or Forward-looking scenarios based upon the reasonable beliefs of the third-party provider are not a guarantee of future performance. Actual results may differ materially from those anticipated in forward-looking or past performance statements. IC Markets makes no representation or warranty and assumes no liability as to the accuracy or completeness of the information provided, nor any loss arising from any investment based on a recommendation, forecast or any information supplied by any third-party.

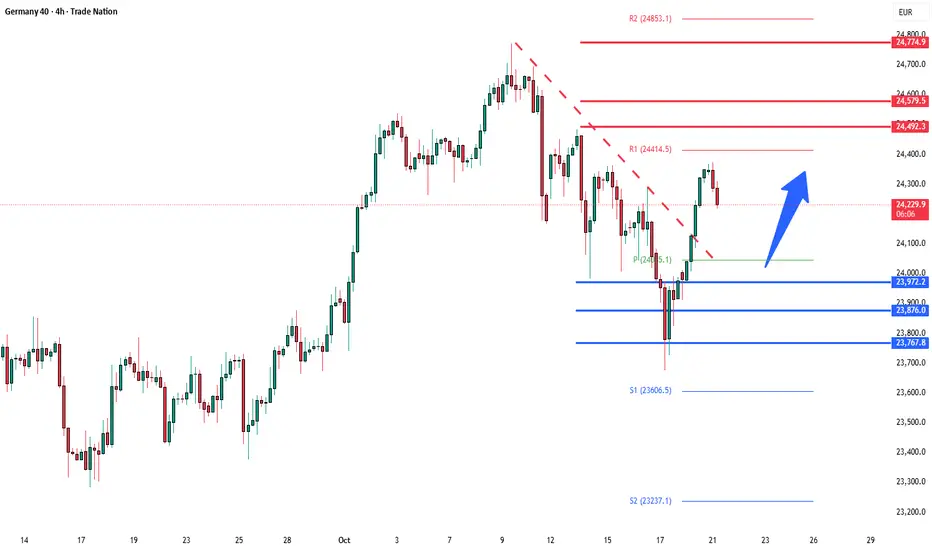
DAX Bullish resistance breakout supported at 24250 The DAX remains in a bullish trend, with recent price action indicating a potential oversold rally within the broader uptrend.
Support Zone: 24250 – a key level from previous consolidation. Price is currently testing or approaching this level.
A bullish rebound from 24250 would confirm ongoing upside momentum, with potential targets at:
24550 – initial resistance
24650 – psychological and structural level
24800 – extended resistance on the longer-term chart
Bearish Scenario:
A confirmed break and daily close below 24250 would weaken the bullish outlook and suggest deeper downside risk toward:
24100 – minor support
24000 – stronger support and potential demand zone
Outlook:
Bullish bias remains intact while the Dax40 holds above 24250. A sustained break below this level could shift momentum to the downside in the short term.
This communication is for informational purposes only and should not be viewed as any form of recommendation as to a particular course of action or as investment advice. It is not intended as an offer or solicitation for the purchase or sale of any financial instrument or as an official confirmation of any transaction. Opinions, estimates and assumptions expressed herein are made as of the date of this communication and are subject to change without notice. This communication has been prepared based upon information, including market prices, data and other information, believed to be reliable; however, Trade Nation does not warrant its completeness or accuracy. All market prices and market data contained in or attached to this communication are indicative and subject to change without notice.

GER40 Critical Level: Which Way Will It Break?📊 GER40 Critical Breakout Analysis
Hello Guys,
By popular demand, I’ve prepared a GER40 analysis. Every single follower matters to me, and that’s why I’m sharing this breakdown with you.
🔹 Buy scenario: Price needs to break above 23,895 and close a candle there.
🔹 Sell scenario: Price needs to drop below 23,278 and close a candle under it.
I’ll be watching both levels closely. Once a breakout happens, I’ll update you right away.
Every like is my biggest motivation to keep sharing these analyses.
Thanks to everyone supporting me!

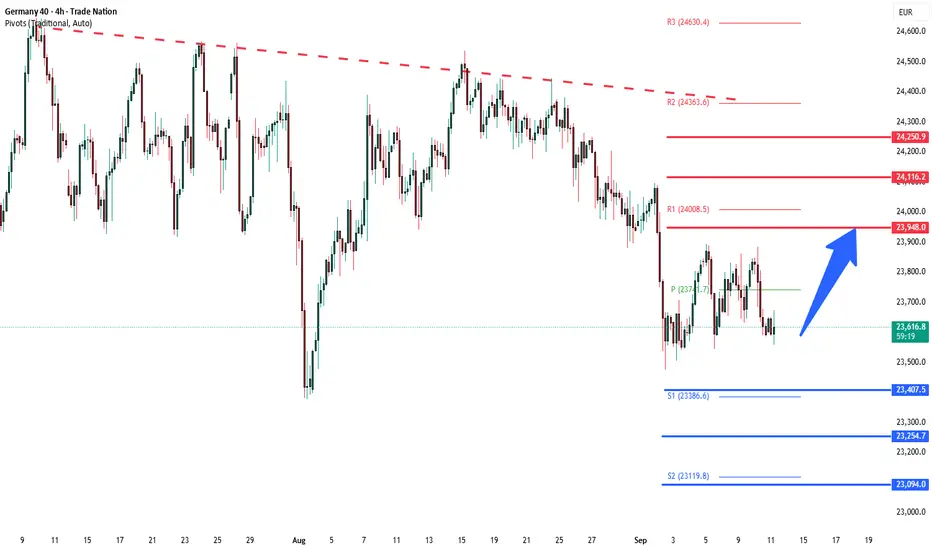
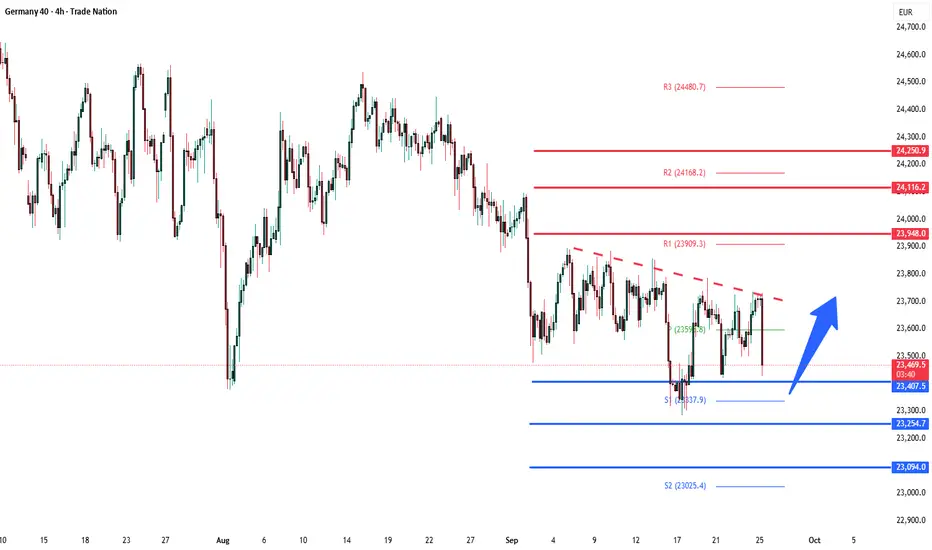
DAX breakout retest at pivotal 23600The DAX remains in a bullish trend, with recent price action indicating a potential oversold rally within the broader uptrend.
Support Zone: 23400 – a key level from previous consolidation. Price is currently testing or approaching this level.
A bullish rebound from 23400 would confirm ongoing upside momentum, with potential targets at:
23950 – initial resistance
24116 – psychological and structural level
24250 – extended resistance on the longer-term chart
Bearish Scenario:
A confirmed break and daily close below 23400 would weaken the bullish outlook and suggest deeper downside risk toward:
23250 – minor support
23094 – stronger support and potential demand zone
Outlook:
Bullish bias remains intact while the Dax40 holds above 23400. A sustained break below this level could shift momentum to the downside in the short term.
This communication is for informational purposes only and should not be viewed as any form of recommendation as to a particular course of action or as investment advice. It is not intended as an offer or solicitation for the purchase or sale of any financial instrument or as an official confirmation of any transaction. Opinions, estimates and assumptions expressed herein are made as of the date of this communication and are subject to change without notice. This communication has been prepared based upon information, including market prices, data and other information, believed to be reliable; however, Trade Nation does not warrant its completeness or accuracy. All market prices and market data contained in or attached to this communication are indicative and subject to change without notice.

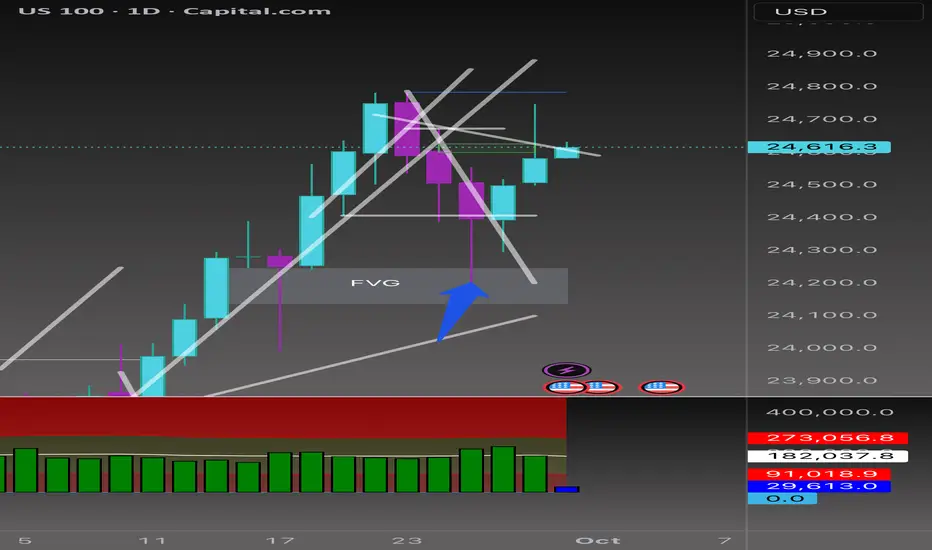
Beyond the Chart - NAS100 Through Technicals & FundamentalsCAPITALCOM:US100 The trendline I drew on the lower timeframe yesterday worked perfectly, and price is still respecting it. We did see a break, but right after that, a Bearish FVG and a Breaker Block formed. This trendline will remain my pilot line for analysis.
NASDAQ Daily Analysis 📊
On the daily chart, the FVG formed on Sep 15th has been revisited, but price couldn't hold in this zone and was quickly rejected. The trendline I've drawn is still active and guiding the move.
⚡️Volatility note: Daily volatility is starting to compress (blue print on my model), meaning the next breakout move could expand strongly. If price breaks above the trendline with momentum, buyers may look beyond 24,650 toward 24,720–24,800 before reevaluating. If rejection holds, compressed volatility could fuel an accelerated drop into the 24,520 → 24,440 FVG zone, and possibly 24,300.
🦖 If a bullish candle closes back above the trendline, I’ll be looking at 24,650 as a buy trigger. A confirmed break here could open the door toward 24,720 → 24,780 liquidity levels.
🐼 If sellers keep control below the trend, downside targets remain at the FVGs around 24,520 → 24,440, and potentially 24,300 (Discount PD Array).
⚡️ Bottom line:
Today’s US data (Chicago PMI, JOLTS, Consumer Confidence) + multiple FOMC speeches will likely decide direction.
📉 Hot data or hawkish tone → sellers push deeper.
📈 Softer numbers or dovish Fed comments → bulls may retest higher levels.
DAX/GER - TIME FOR A SHORTTeam,
DAX, bets to short at this range 23830-23850 - STOP LOSS at 24015
Target 1 - 23756-50 - take partial 70% and bring stop BE
target 2 - 23715-25
lets go.

GER40: 24K FORTRESS UNDER SIEGE! European Bull Run 🚀 GER40: 24K FORTRESS UNDER SIEGE! European Bull Run 📊
Current Price: 23,763.00 | Date: Sept 27, 2025 ⏰
📈 INTRADAY TRADING SETUPS (Next 5 Days)
🎯 BULLISH SCENARIO
Entry Zone: 23,720 - 23,780 📍
Stop Loss: 23,650 🛑
Target 1: 23,920 🎯
Target 2: 24,080 🚀
🎯 BEARISH SCENARIO
Entry Zone: 23,800 - 23,850 📍
Stop Loss: 23,920 🛑
Target 1: 23,600 🎯
Target 2: 23,450 📉
🔍 TECHNICAL ANALYSIS BREAKDOWN
📊 KEY INDICATORS STATUS:
RSI (14): 63.7 ⚡ Bullish Territory Hold
Bollinger Bands: Upper Band Test 🔥
VWAP: 23,740 - Critical Pivot 💪
EMA 20: 23,680 ✅ Strong Uptrend Base
Volume: Above Average Flow 📊
🌊 WAVE ANALYSIS:
Elliott Wave: Wave 3 Impulse Active 🌊
Fibonacci Extension: 24,200 Target 🎯
🔄 HARMONIC PATTERNS:
Bullish Gartley Completion at 23,650 ✨
Cypher Pattern PRZ Active 🔄
⚖️ SWING TRADING OUTLOOK (1-4 Weeks)
🚀 BULLISH TARGETS:
Psychological: 24,000 🏆
Weekly Resistance: 24,150 🌙
Gann Square: 24,300 ⭐
📉 BEARISH INVALIDATION:
Weekly Support: 23,500 ⚠️
Critical Break: 23,300 🚨
🎭 MARKET STRUCTURE:
Trend: Ascending Channel 💪
Momentum: Building Steam 🔥
Wyckoff Phase: Mark-up Active 📈
Ichimoku: Bullish Breakout 🟢
🏰 24K FORTRESS BATTLE:
Resistance Cluster: 23,950-24,050 ⚔️
Volume Spike Needed: Above 24,000 💥
Breakout Confirmation: 24,080 hold 🔓
⚡ RISK MANAGEMENT:
Max Risk per Trade: 1.2% 🛡️
R:R Ratio: Minimum 1:2.5 ⚖️
European Session: Prime Trading 📏
🌍 EUROPEAN CATALYSTS:
ECB Policy Supporting Growth 🏛️
German Economic Data Resilient 📈
Export Sector Momentum Strong 🚢
🔥 CRITICAL LEVELS:
Breakout: 23,850 decisive close 💥
Support: 23,700 | 23,620 | 23,500 🛡️
Resistance: 23,900 | 24,000 | 24,150 🚧
🎯 FINAL VERDICT:
DAX storming toward 24K BREAKTHROUGH! 🚀
European strength driving momentum! 💪
Bull channel intact - trend your friend! 📈
Trade Management: Buy dips to VWAP support 💎
Key Battle: 24K psychological fortress! 🏰
---
⚠️ Disclaimer: Trading involves substantial risk. Use proper position sizing. Educational content only.
For individuals seeking to enhance their trading abilities based on the analyses provided, I recommend exploring the mentoring program offered by Shunya Trade. (Website: shunya dot trade)
I would appreciate your feedback on this analysis, as it will serve as a valuable resource for future endeavors.
Sincerely,
Shunya.Trade
Website: shunya dot trade
🔔 Follow European Markets | 💬 Share Your DAX 24K Strategy
DAX retesting key support at 23400The DAX remains in a bullish trend, with recent price action indicating a potential oversold rally within the broader uptrend.
Support Zone: 23400 – a key level from previous consolidation. Price is currently testing or approaching this level.
A bullish rebound from 23400 would confirm ongoing upside momentum, with potential targets at:
23950 – initial resistance
24116 – psychological and structural level
24250 – extended resistance on the longer-term chart
Bearish Scenario:
A confirmed break and daily close below 23400 would weaken the bullish outlook and suggest deeper downside risk toward:
23250 – minor support
23094 – stronger support and potential demand zone
Outlook:
Bullish bias remains intact while the Dax40 holds above 23400. A sustained break below this level could shift momentum to the downside in the short term.
This communication is for informational purposes only and should not be viewed as any form of recommendation as to a particular course of action or as investment advice. It is not intended as an offer or solicitation for the purchase or sale of any financial instrument or as an official confirmation of any transaction. Opinions, estimates and assumptions expressed herein are made as of the date of this communication and are subject to change without notice. This communication has been prepared based upon information, including market prices, data and other information, believed to be reliable; however, Trade Nation does not warrant its completeness or accuracy. All market prices and market data contained in or attached to this communication are indicative and subject to change without notice.
DAX40 consolidation breakout supported at 23400The DAX remains in a bullish trend, with recent price action indicating a potential oversold rally within the broader uptrend.
Support Zone: 23400 – a key level from previous consolidation. Price is currently testing or approaching this level.
A bullish rebound from 23400 would confirm ongoing upside momentum, with potential targets at:
23950 – initial resistance
24116 – psychological and structural level
24250 – extended resistance on the longer-term chart
Bearish Scenario:
A confirmed break and daily close below 23400 would weaken the bullish outlook and suggest deeper downside risk toward:
23250 – minor support
23094 – stronger support and potential demand zone
Outlook:
Bullish bias remains intact while the Dax40 holds above 23950. A sustained break below this level could shift momentum to the downside in the short term.
This communication is for informational purposes only and should not be viewed as any form of recommendation as to a particular course of action or as investment advice. It is not intended as an offer or solicitation for the purchase or sale of any financial instrument or as an official confirmation of any transaction. Opinions, estimates and assumptions expressed herein are made as of the date of this communication and are subject to change without notice. This communication has been prepared based upon information, including market prices, data and other information, believed to be reliable; however, Trade Nation does not warrant its completeness or accuracy. All market prices and market data contained in or attached to this communication are indicative and subject to change without notice.

DAX40 Oversold bounce resistance at 23950The DAX remains in a bullish trend, with recent price action indicating a potential oversold rally within the broader uptrend.
Support Zone: 23400 – a key level from previous consolidation. Price is currently testing or approaching this level.
A bullish rebound from 23400 would confirm ongoing upside momentum, with potential targets at:
23950 – initial resistance
24116 – psychological and structural level
24250 – extended resistance on the longer-term chart
Bearish Scenario:
A confirmed break and daily close below 23400 would weaken the bullish outlook and suggest deeper downside risk toward:
23250 – minor support
23094 – stronger support and potential demand zone
Outlook:
Bullish bias remains intact while the Dax40 holds above 23950. A sustained break below this level could shift momentum to the downside in the short term.
This communication is for informational purposes only and should not be viewed as any form of recommendation as to a particular course of action or as investment advice. It is not intended as an offer or solicitation for the purchase or sale of any financial instrument or as an official confirmation of any transaction. Opinions, estimates and assumptions expressed herein are made as of the date of this communication and are subject to change without notice. This communication has been prepared based upon information, including market prices, data and other information, believed to be reliable; however, Trade Nation does not warrant its completeness or accuracy. All market prices and market data contained in or attached to this communication are indicative and subject to change without notice.

DAX coiling price pattern support at 23950The DAX remains in a bullish trend, with recent price action indicating a potential oversold rally within the broader uptrend.
Support Zone: 23400 – a key level from previous consolidation. Price is currently testing or approaching this level.
A bullish rebound from 23400 would confirm ongoing upside momentum, with potential targets at:
23950 – initial resistance
24116 – psychological and structural level
24250 – extended resistance on the longer-term chart
Bearish Scenario:
A confirmed break and daily close below 23400 would weaken the bullish outlook and suggest deeper downside risk toward:
23250 – minor support
23094 – stronger support and potential demand zone
Outlook:
Bullish bias remains intact while the Dax40 holds above 23950. A sustained break below this level could shift momentum to the downside in the short term.
This communication is for informational purposes only and should not be viewed as any form of recommendation as to a particular course of action or as investment advice. It is not intended as an offer or solicitation for the purchase or sale of any financial instrument or as an official confirmation of any transaction. Opinions, estimates and assumptions expressed herein are made as of the date of this communication and are subject to change without notice. This communication has been prepared based upon information, including market prices, data and other information, believed to be reliable; however, Trade Nation does not warrant its completeness or accuracy. All market prices and market data contained in or attached to this communication are indicative and subject to change without notice.

ALERT: DAX40 IS Reversing and Pulling Everybody With It!DAX40 is showing a great weakness as it has closed under the EMA and SMA. in addition the Stochastic Oscillator is over sold, as a result I am shorting.
Disclaimer: This is not a financial advice, do your homework.
Good Luck For All of Us.
Markets Titan

DAX bullish consolidation support at 23950The DAX remains in a bullish trend, with recent price action indicating a potential oversold rally within the broader uptrend.
Support Zone: 23400 – a key level from previous consolidation. Price is currently testing or approaching this level.
A bullish rebound from 23400 would confirm ongoing upside momentum, with potential targets at:
23950 – initial resistance
24116 – psychological and structural level
24250 – extended resistance on the longer-term chart
Bearish Scenario:
A confirmed break and daily close below 23400 would weaken the bullish outlook and suggest deeper downside risk toward:
23250 – minor support
23094 – stronger support and potential demand zone
Outlook:
Bullish bias remains intact while the Dax40 holds above 23950. A sustained break below this level could shift momentum to the downside in the short term.
This communication is for informational purposes only and should not be viewed as any form of recommendation as to a particular course of action or as investment advice. It is not intended as an offer or solicitation for the purchase or sale of any financial instrument or as an official confirmation of any transaction. Opinions, estimates and assumptions expressed herein are made as of the date of this communication and are subject to change without notice. This communication has been prepared based upon information, including market prices, data and other information, believed to be reliable; however, Trade Nation does not warrant its completeness or accuracy. All market prices and market data contained in or attached to this communication are indicative and subject to change without notice.