DAX Correction very likely. Target 17100.DAX (DE40) is extending a very strong Bullish Leg, which started after the previous short-term correction ended on January 17 2024 with a contact on the 1D MA50 (blue trend-line). This is part of an overall Bullish Wave that emerged on the latest Higher Low (October 27 2023) of the 1.5 year Channel Up.
However as the 1D MACD is about to form a Bearish Cross (which has been a sell signal within this pattern) while the price is already on the -0.382 Fibonacci extension level (which is where it was rejected on the previous Bullish Leg on March 07 2023), we are turning bearish on DAX on the medium-term, targeting the previous Resistance at 17100.
-------------------------------------------------------------------------------
** Please LIKE 👍, FOLLOW ✅, SHARE 🙌 and COMMENT ✍ if you enjoy this idea! Also share your ideas and charts in the comments section below! This is best way to keep it relevant, support us, keep the content here free and allow the idea to reach as many people as possible. **
-------------------------------------------------------------------------------
💸💸💸💸💸💸
👇 👇 👇 👇 👇 👇
Daxsignals

DAX Time to respect the 17-year Channel and correct.Exactly 3 months ago (December 06 2023, see chart below), we set a 17800 Target on DAX (DE40) and the index hit that level yesterday:
At the time DAX was the first major stock index to hit new All Time Highs (ATH) and as we mentioned it "sent a message to indices globally". And followed they did, as all markets followed this lead and rose aggressively.
This time however, DAX is sending a bearish signal as by hitting 17800 it reached the top (Higher Highs trend-line) of the 17-year Channel Up that started on the July 2007 High, right at the peak of the U.S. Housing Crisis.
At the same time it almost hit the 1.382 Fibonacci extension, which is a key level as every time the index (nearly) hit it (May 2014, January 2018, February 2020), it corrected by at least -15%. As a result we think a test of January's Low at 16350 would be a modest target, even though it might seem unrealistic under the current market sentiment. A -15% decline would even test the 1M MA50 (blue trend-line) for the first time since November 2022 and the post Inflation Crisis recovery.
Note that we currently only starting the 3rd Mega Cycle. Both previous 2 peaked their Higher Highs on the 2.0 Fibonacci extension (measuring from Sine Wave Top to Sine Wave Top). So on a multi-year basis, as investors we look to take advantage of these corrections and buy for an ultimate 2028 Target at 20500.
-------------------------------------------------------------------------------
** Please LIKE 👍, FOLLOW ✅, SHARE 🙌 and COMMENT ✍ if you enjoy this idea! Also share your ideas and charts in the comments section below! This is best way to keep it relevant, support us, keep the content here free and allow the idea to reach as many people as possible. **
-------------------------------------------------------------------------------
💸💸💸💸💸💸
👇 👇 👇 👇 👇 👇

DAX Trading plan based on the 1D MA50DAX (DE40) is on a short-term Channel Up, supported by the 1D MA50 (blue trend-line), which has held twice in the past month (January 17 and February 13). As long as it holds, we will most likely see a break of the long-term Channel Up, which in time could complete a +20.90% rise as the July 31 2023 High. In that case, we will target 17400 on the short-term.
If however the 1D MA50 breaks, we will open a sell and target the 1D MA200 (orange trend-line) at 16200. Based on the 1D RSI, which is showing a consolidation following a Channel Down, there are more probabilities of replicating the April - May 2023 bullish sequence.
-------------------------------------------------------------------------------
** Please LIKE 👍, FOLLOW ✅, SHARE 🙌 and COMMENT ✍ if you enjoy this idea! Also share your ideas and charts in the comments section below! This is best way to keep it relevant, support us, keep the content here free and allow the idea to reach as many people as possible. **
-------------------------------------------------------------------------------
💸💸💸💸💸💸
👇 👇 👇 👇 👇 👇

DAX Will it drop at the top of the 1-year Channel Up?DAX (FDAX1!) is currently trading at the top (Higher Highs trend-line) of the Channel Up pattern that started on the December 20 2022 Low. This is a more than 1-year trading structure and as long as its stays intact, we should see a rejection below the 1D MA50 (blue trend-line) and towards the 1D MA200 (orange trend-line).
Based on the previous declines within the pattern, there are high probabilities of seeing a minimum of -6.50% pull-back. That gives us a Sell Target at 16000. The absolute bottom on the long-term based on the 2023 price action is the 1W MA100 (yellow trend-line), which formed the market Lows of March 20 2023 and October 27 2023.
If the index closes a 1D candle above the top (Higher Highs trend-line) of the Channel Up, then we will drop the sell and buy the break-out instead, targeting 17600, which would complete a +20.90% rise from the October Low, symmetrical to the rise on the December 20 2022 Low.
-------------------------------------------------------------------------------
** Please LIKE 👍, FOLLOW ✅, SHARE 🙌 and COMMENT ✍ if you enjoy this idea! Also share your ideas and charts in the comments section below! This is best way to keep it relevant, support us, keep the content here free and allow the idea to reach as many people as possible. **
-------------------------------------------------------------------------------
💸💸💸💸💸💸
👇 👇 👇 👇 👇 👇

DAX Channel Down aiming at 16000DAX (DE40) has transitioned into a Channel Down pattern following the December 14 top rejection on the Higher Highs trend-line. The 1D MA50 (blue trend-line) is fast approaching as the first level of Support but we expect it downtrend to bottom lower as resembles the declines of August 2023, March 2023 and December 2022 both on price and 1D RSI terms.
All those declines have been extended at least to -6.50% so if the current pattern continues to replicate them, we expect a 1D MA200 (orange trend-line) test. As a result our Target is 16000, exactly at the top of the Support Zone. We will buy for the medium-term once the 1D RSI starts making Higher Lows (buy on the 2nd Higher Low) at below neutral levels. The 1W MA100 (yellow trend-line) is the long-term Support.
-------------------------------------------------------------------------------
** Please LIKE 👍, FOLLOW ✅, SHARE 🙌 and COMMENT ✍ if you enjoy this idea! Also share your ideas and charts in the comments section below! This is best way to keep it relevant, support us, keep the content here free and allow the idea to reach as many people as possible. **
-------------------------------------------------------------------------------
💸💸💸💸💸💸
👇 👇 👇 👇 👇 👇

DAX The decline isn't over but MACD can give a timely buy.DAX (DE40) gave us an excellent sell signal last time we looked into it (December 14 2023, see chart below), as the 1D MACD Bearish Cross, was our sell signal:
Our 16500 short-term target has already been hit, and we now shift our focus on the medium-term as it appears that this pull-back will most likely be extended to the 1D MA50 (blue trend-line) at least.
It was a similar correction on December 13 2022, which after almost reaching the 1.382 Fibonacci extension level (as the currrent High), it got rejected back to the 1D MA50 on a -6.50% decline. As a result our sell target is now 16150 (1D MA50 contact) and we will buy again for the long-term only when the 1D MACD makes a Bullish Cross, which was the case on January 03 2023.
-------------------------------------------------------------------------------
** Please LIKE 👍, FOLLOW ✅, SHARE 🙌 and COMMENT ✍ if you enjoy this idea! Also share your ideas and charts in the comments section below! This is best way to keep it relevant, support us, keep the content here free and allow the idea to reach as many people as possible. **
-------------------------------------------------------------------------------
💸💸💸💸💸💸
👇 👇 👇 👇 👇 👇

DAX Will the 1D Golden Cross pull it back like last time?DAX (DE40) is trading within a 16-month Channel Up and is currently on the second most aggressive bullish leg, about to form the 2nd 1D Golden Cross within that time span. The 1D RSI is above 85.00 touching historically overbought levels while the price is approaching the 1.382 Fibonacci extension from the previous Higher High of the Channel, which is below where the Channel's first bullish leg of October - November 2022 peaked and then, after a 1D Golden Cross formation, pulled back to its middle trend-line and the 1D MA50 (blue trend-line).
Despite those bearish indicators, we will sell only after the 1D MACD forms a Bearish Cross, which has been the most consistent sell signal throughout this period of time and target 16500 (Channel's middle). On the other hand, if the index breaks above the 1.382 Fib first, we will buy the break-out and target 18000, which is the top (Higher Highs trend-line) of the Channel Up and +24.20% rise from the bottom (similar to the November 2022 rally).
-------------------------------------------------------------------------------
** Please LIKE 👍, FOLLOW ✅, SHARE 🙌 and COMMENT ✍ if you enjoy this idea! Also share your ideas and charts in the comments section below! This is best way to keep it relevant, support us, keep the content here free and allow the idea to reach as many people as possible. **
-------------------------------------------------------------------------------
💸💸💸💸💸💸
👇 👇 👇 👇 👇 👇

DAX's new All Time High sends a message to indices globallyDAX hit a new All Time High level, leading world stock indices on this rally and sending a clear message to markets globally: This rally has only just started.
As you see on this 1M (monthly) time-frame, with the obvious exception of the COVID crash anomaly (Black Swan event), the index has been trading within a very stable Channel Up pattern since the start of the 2008 crisis. The 1M MA200 (orange trend-line) has been the absolute Support during this time, holding even during the COVID market crash.
The recent November rally after October's bottom on a 3 month straight decline, is completing a very rare but powerful bullish signal that has only happened another 3 times during this 16-year pattern (5 if we count smaller occasions). As you can see, every time the index broke above a dashed Lower Highs trend-line of a correction wave, it then pulled-back to test it and after it held, it initiated a strong and lengthy rally.
There have been two major Highs on this Channel Up pattern, and those are displayed perfectly on the Sine Waves peaks (April 2015, January 2022). Both have been exactly on the 2.0 Fibonacci extension since the first correction following a market High (July 2007, April 2015). Those occasions that are matched with the current rebound more accurately based on the 1M RSI are marked with a blue circle.
The minimum % rise that those 5 events have delivered is the +22.10% of February 2020, which of course could have been higher if it wasn't cut short by the COVID crash. In any case a +22.10% rise from the October 2023 Low would match perfectly the top of the Channel Up and will make a technical Higher High for the pattern. As a result, our target is 17800 on DAX.
What the blue-print of the Sine Waves show though for long term investors is that the Cyclical Peak therefore target around the end of 2028 - beginning 2029 is 20500. Those that patiently wait for corrections to take advantage of and buy, will get rewarded based on this historic behavioral pattern.
-------------------------------------------------------------------------------
** Please LIKE 👍, FOLLOW ✅, SHARE 🙌 and COMMENT ✍ if you enjoy this idea! Also share your ideas and charts in the comments section below! This is best way to keep it relevant, support us, keep the content here free and allow the idea to reach as many people as possible. **
-------------------------------------------------------------------------------
💸💸💸💸💸💸
👇 👇 👇 👇 👇 👇

DAX Buy the pull-back and target the All Time HighDAX eventually broke to the upside following our previous trade idea (see chart below) and hit both our 15635 and 15995 targets:
The index is now approaching Resistance 1 (16535), which is the All Time High (ATH) but the 1D CCI shows a Bearish Divergence and potential short-term pull-back. That would serve as an excellent accumulation opportunity for an end-of-the-year rally. We are waiting for a buy at 15800 (1D MA200) in order to target 16535.
-------------------------------------------------------------------------------
** Please LIKE 👍, FOLLOW ✅, SHARE 🙌 and COMMENT ✍ if you enjoy this idea! Also share your ideas and charts in the comments section below! This is best way to keep it relevant, support us, keep the content here free and allow the idea to reach as many people as possible. **
-------------------------------------------------------------------------------
💸💸💸💸💸💸
👇 👇 👇 👇 👇 👇

DAX Watch this low risk November trading plan.It's been a bit long since we last took a trade on DAX (DE40) but it didn't disappoint as it hit both our buy and sell targets (see chart below) within the 3-month Channel Down:
The rebound took place within the 6-month Support Zone and slightly under the 1W MA100 (green trend-line), similar to the March 20 rebound. The fractals are identical as they both rebounded aggressively, indicating strong demand inside the Support Zone. Both also formed a strong 1D MACD Bullish Cross straight after they bottomed.
The price is now on the 1D MA50 (blue trend-line) at the top of the Channel Down, and the last two days failed to close the 1D candle above the MA50, despite breaking it. The Resistance pressure is getting stronger since this is also the 0.382 Fibonacci retracement level from the July 31 top.
As a result, we are willing to sell the Lower Highs top of the Channel Down and target 15050 (can go even to the 0.618 Fib level but we seek short-term exposure for now) but only as long as the candles close below the 1D MA50. Upon the first 1D candle closing above the 1D MA50, we will take the loss and resume buying, targeting the 1D MA200 (orange trend-line) at 15635.
-------------------------------------------------------------------------------
** Please LIKE 👍, FOLLOW ✅, SHARE 🙌 and COMMENT ✍ if you enjoy this idea! Also share your ideas and charts in the comments section below! This is best way to keep it relevant, support us, keep the content here free and allow the idea to reach as many people as possible. **
-------------------------------------------------------------------------------
💸💸💸💸💸💸
👇 👇 👇 👇 👇 👇

DAX has started the new Channel Down bullish legDAX hit last week the bottom (Lower Highs trend-line) of the Channel Down that started after the July 31 High. Technically that is a short-term buy signal, aimed at the 1D MA50 (blue trend-line) and the top of the Channel Down. Our current target is 15500 (also on a +3.70% symmetry with the previous bullish leg of the Channel).
A 1D candle close above the Channel Up will be a bullish break-out signal targeting 15920 (0.618 Fibonacci retracement level). But until it does, the trend will remain bearish within the Channel Down, targeting the 1W MA100 (green trend-line) at 14750.
-------------------------------------------------------------------------------
** Please LIKE 👍, FOLLOW ✅, SHARE 🙌 and COMMENT ✍ if you enjoy this idea! Also share your ideas and charts in the comments section below! This is best way to keep it relevant, support us, keep the content here free and allow the idea to reach as many people as possible. **
-------------------------------------------------------------------------------
💸💸💸💸💸💸
👇 👇 👇 👇 👇 👇

DAX Bottom rebound buy opportunity to 15650.DAX (DE40) has made a short-term bottom near the Lower Lows trend-line of the Channel Down after hitting the 1W MA50 (red trend-line). This is a short-term buy signal to at least 15650, which is on the Channel's top and represents a symmetrical +3.66% rise similar to the previous Lower High leg. If it doesn't get rejected, this is where the Fibonacci retracement levels come forward. The 0.382 Fib is almost exactly on our target.
A break above, which would also be a break above the 1D MA50 (blue trend-line), targets Resistance 1 (15995), which is exactly on the 0.618 Fib. Only a candle closing above that Resistance justifies a bullish reversal for the long-term.
If the 1D MA50 doesn't break, we expect the Channel Down to look for a 1W candle closing below the 1W MA50, which can technically deliver a downward extension towards the 1W MA100 (green trend-line) on the 6-month Support Zone. If that scenario prevails, we will need to see a clear indication that this will be the same High Demand Zone as during March 15 - 24, when all attempts to break it reversed emphatically as most candles closed above it leaving long wicks inside the Zone.
-------------------------------------------------------------------------------
** Please LIKE 👍, FOLLOW ✅, SHARE 🙌 and COMMENT ✍ if you enjoy this idea! Also share your ideas and charts in the comments section below! **
-------------------------------------------------------------------------------
💸💸💸💸💸💸
👇 👇 👇 👇 👇 👇

DAX Bullish as long as the 1D MA200 holds.DAX (DE40) has been neutral on the 1D time-frame, trading sideways within the 1D MA50 (blue trend-line) and 1D MA200 (orange trend-line) since August 03. We can see two clear Support and Resistance Zones. Today the price is approaching once more the 1D MA200, following yesterday's Fed Rate Decision, so it is a buy opportunity again. Target the bottom of the Resistance Zone at 16000.
Apart from that, the Fibonacci retracement levels since the July 31 High, make solid Supports and Resistances, with the 0.5 Fib currently being one.
-------------------------------------------------------------------------------
** Please LIKE 👍, FOLLOW ✅, SHARE 🙌 and COMMENT ✍ if you enjoy this idea! Also share your ideas and charts in the comments section below! **
-------------------------------------------------------------------------------
💸💸💸💸💸💸
👇 👇 👇 👇 👇 👇

DAX Trading plan within this 1H Channel DownDAX is within a Channel Down pattern on the 1H time-frame and just bounced back to its top (Lower Highs trend-line), hitting the 1H MA50 (blue trend-line) immediately. As long as the price remains within the Channel Down, sell and target the Inner Lower Lows trend-line at 15525.
With the 1H MACD just forming a Bullish Cross that high for the first time since September 01, it is equally likely to see a bullish break-out above the Channel. We will buy if it breaks above the 0.5 Fibonacci level, which should coincide with a 1H MA200 (orange trend-line) test. In that case our target will be 15940 (the 0.786 Fibonacci).
-------------------------------------------------------------------------------
** Please LIKE 👍, FOLLOW ✅, SHARE 🙌 and COMMENT ✍ if you enjoy this idea! Also share your ideas and charts in the comments section below! **
-------------------------------------------------------------------------------
💸💸💸💸💸💸
👇 👇 👇 👇 👇 👇

DAX40 H4 - Short SetupDAX40 H4
We are now into that 16000 resistance region, a nice area of supply and resistance sitting on our H4 and D1 level. We also note, FTSE100 sitting on that 7500 psychological price. UK and EU based indices sitting on some pretty large numbers.
FTSE100 already aimed to make a couple of slightly rejections from that resistance price, as has DAX. Looking for a deeper pulldown now to see some downside swing potential.

DAX Buy opportunity on the 1D MA200 and bottom of Channel Up.DAX is on the 3rd straight green 1D candle after it almost hit the 1D MA200 (orange trend-line) last Friday, which is intact since November 10 2022. This rebound comes as a natural reaction to the long-term Support dynamic of the 1D MA200 as well as the presence of Support 1 from the July 07 Low.
As long as it holds, we will take it as a buy opportunity and target 16700 (Internal Higher Highs trend-line). If it closes a 1D candle below the 1D MA200, we will take the small loss and open a sell targeting Support 2 at 14470.
Notice how even the 1D RSI almost hit the 34.70 Support and is rebounding, which is an additional buy signal. Don't neglect also the fact that Friday's low was formed at the bottom of the 7-month Channel Up pattern.
-------------------------------------------------------------------------------
** Please LIKE 👍, FOLLOW ✅, SHARE 🙌 and COMMENT ✍ if you enjoy this idea! Also share your ideas and charts in the comments section below! **
-------------------------------------------------------------------------------
💸💸💸💸💸💸
👇 👇 👇 👇 👇 👇

DAX Found Support on the Megaphone's Higher Lows.DAX is on the 8th straight sideways 1D candle as it found Support on the bottom (Higher Lows trend-line) of the long-term Bullish Megaphone pattern. The 1D MA50 (blue trend-line) is the short-term Resistance while the price is trading around the 1D MA100 (green trend-line) as pivot.
We are bullish, targeting the Internal Higher Highs trend-line at 17000, as long as the Megaphone's bottom holds. The bullish extension may be even higher considering the fact that the medium-term pattern could be an Inverse Head and Shoulders (IH&S) that technically targets the 2.0 Fibonacci extension at 17400.
If however the price breaks below the Higher Lows trend-line, we will short-term sell targeting the 1D MA200 (orange trend-line) where a 1D candle close below it, would justify a bearish extension to Support 2 at 14470.
For now the trend remains bullish, as illustrated by the 1D RSI also which is on an 8-month Support Zone.
-------------------------------------------------------------------------------
** Please LIKE 👍, FOLLOW ✅, SHARE 🙌 and COMMENT ✍ if you enjoy this idea! Also share your ideas and charts in the comments section below! **
-------------------------------------------------------------------------------
💸💸💸💸💸💸
👇 👇 👇 👇 👇 👇

DAX above the 1D MA50, has already started the new rally.DAX broke yesterday above the 1D MA50 (blue trend-line) again after rebounding at the bottom (Higher Lows trend-line) of the December 2022 Bullish Megaphone pattern. This is the new technical bullish leg that will aim to form the next Higher High. On a similar way with the previous bottom rebound on March 20, the Low was also priced after the 1D MA100 (green trend-line) broke.
Their RSI patterns are also identical, with the current attempting to test its Lower Highs trend-line before breaking it. The MACD Bullish Cross that was just formed is also in line with the previous two (March 29 and January 03). Every Cross below 0.0 is a long-term buy opportunity.
Our target is just under the Internal Higher Highs trend-line at 16800.
-------------------------------------------------------------------------------
** Please LIKE 👍, FOLLOW ✅, SHARE 🙌 and COMMENT ✍ if you enjoy this idea! Also share your ideas and charts in the comments section below! **
-------------------------------------------------------------------------------
💸💸💸💸💸💸
👇 👇 👇 👇 👇 👇

DAX potential pull-back.DAX had an excellent run since our buy signal (see chart below) more than two months ago (March 21) but after it broke above the former All Time High (ATH) on May 19, it has formed a top and is pulling back:
As long as the price is closing the 1D candle above the 1D MA50 (blue trend-line), it will be a buy opportunity targeting the top of the (dotted) Channel Up at 16600. If however it breaks below the 1D MA100 (green trend-line) we will quick sell towards the Channel's bottom at 15350 and add a new buy there. In either case, the target remains intact at 16600.
-------------------------------------------------------------------------------
** Please LIKE 👍, FOLLOW ✅, SHARE 🙌 and COMMENT ✍ if you enjoy this idea! Also share your ideas and charts in the comments section below! **
-------------------------------------------------------------------------------
💸💸💸💸💸💸
👇 👇 👇 👇 👇 👇

DAX Can decline more before finding a bottomDAX had an excellent run since our buy signal two months ago (March 21) but has since formed a top and is pulling back (see chart below):
The price is below the 4H MA50 (blue trend-line) and today is testing the 1D MA50 (red trend-line) for the first time since March 29. The 1D RSI is still neutral around the 50.00 mark, meaning that there is still more room left on this downside. The next technical Support is the 1D MA100 (green trend-line), which is on a significant Support cluster as it is just above the October 01 Higher Lows trend-line.
We expect a bottom to be made at 15500, it offers a solid R/R ration for buying and that is what we will go, targeting 16300 and the previous High, which was the first target of the late March rebound.
An addition signal to help with taking the best buy entry possible, can be the 1D RSI. A Double Bottom at least (especially as close to the 37.80 Support as possible) would be ideal.
-------------------------------------------------------------------------------
** Please LIKE 👍, FOLLOW ✅, SHARE 🙌 and COMMENT ✍ if you enjoy this idea! Also share your ideas and charts in the comments section below! **
-------------------------------------------------------------------------------
💸💸💸💸💸💸
👇 👇 👇 👇 👇 👇

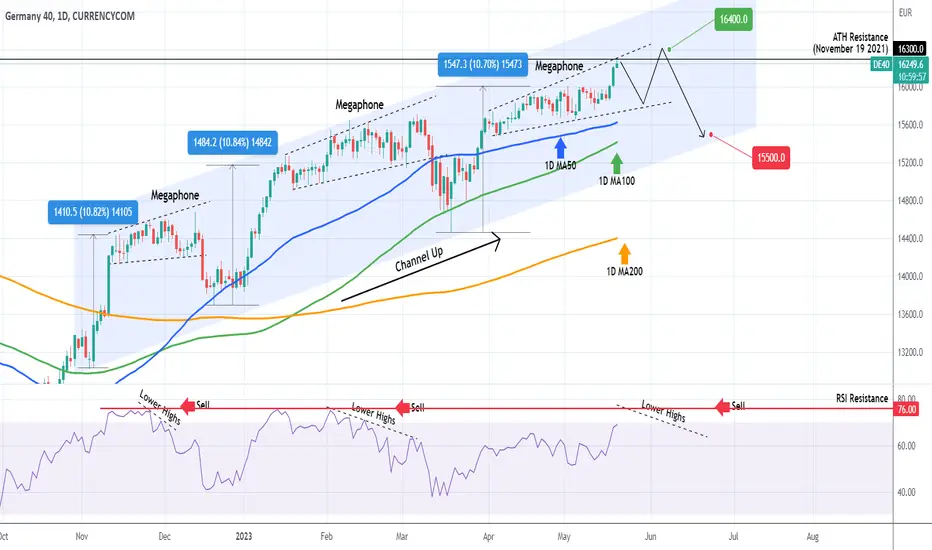
DAX Testing its All Time High but upside may be limited!DAX had an excellent run since our previous buy signal on March 21 (see chart below) that hit its target yesterday:
The index is right now moments away from hitting the 16300 Resistance, which is the All Time High (ATH) of November 19 2021. The long-term pattern since the end of October 2022 has been a Channel Up and within it, three Megaphone patterns have guided the price to each Higher High before an eventual correction back towards its bottom. The symmetry is evident even on the +10.80% rallies that it has done three times.
The 1D RSI usually hits the 76.00 Resistance and then after a series of Lower Highs, we get the top confirmation to sell. Right now the RSI has just hit the 70.00 overbought barrier. In our opinion the upside is limited to around 16400 but as mentioned, we will only sell after we see Lower Highs forming. On the first Channel Up pull-back, it was the 1D MA50 (blue trend-line) that supported, on the second it was the 1D MA100 (green trend-line) and this time it should be lower. Our early projection is 15500.
-------------------------------------------------------------------------------
** Please LIKE 👍, FOLLOW ✅, SHARE 🙌 and COMMENT ✍ if you enjoy this idea! Also share your ideas and charts in the comments section below! **
-------------------------------------------------------------------------------
💸💸💸💸💸💸
👇 👇 👇 👇 👇 👇
DAX is starting a long-term rally to 16100DAX is now testing the 1D MA50 (blue trend-line) having rebounded at the bottom of its long-term (since the October 03 Low) Channel Up and the 1D MA100 (green trend-line). With the 1D RSI coming out of its Accumulation Zone, as in the previous two Lows (late September and late December 2022), we expect this first long-term wave to hit at least 16100 and the middle (0.5 Fibonacci) of the Channel Up.
-------------------------------------------------------------------------------
** Please LIKE 👍, FOLLOW ✅, SHARE 🙌 and COMMENT ✍ if you enjoy this idea! Also share your ideas and charts in the comments section below! **
-------------------------------------------------------------------------------
💸💸💸💸💸💸
👇 👇 👇 👇 👇 👇

DAX on the strongest bullish momentum of all, targeting 16350.DAX gave us both the sell profit we aimed for last week as well as the break-out buy signal above Resistance 1:
This time we are moving on a higher time-frame (1D), as the index is showing incredible bullish momentum on the long-term. Trading within a Channel Up since the October 03 2022 market bottom, the structure is best viewed using the Fibonacci Channel levels. Since October 21 the 0.236 - 0.382 Fib Zone has been the ultimate buy zone, with the most recent entry being on March 02 right above the 1D MA50 (blue trend-line).
With the 1D RSI coming out of its newest Accumulation Phase, the index can now target the 0.786 - 1.0 Fibonacci Zone, with our long-term target being at 16350.
-------------------------------------------------------------------------------
** Please LIKE 👍, FOLLOW ✅, SHARE 🙌 and COMMENT ✍ if you enjoy this idea! Also share your ideas and charts in the comments section below! **
-------------------------------------------------------------------------------
💸💸💸💸💸💸
👇 👇 👇 👇 👇 👇
