EURUSD: Next Weeks! for Swing and Day TradersHello Traders!
This is the daily chart of EURUSD!
You have two options!
1st is to wait for the pair to reach the zone and buy there!
2nd is for intraday traders! you can search for sell opportunities in the path to reach the zone and then start to search for long trades from there!
in case of intraday trading just be cautions in reaction to the midline of the channel!
Daytrading

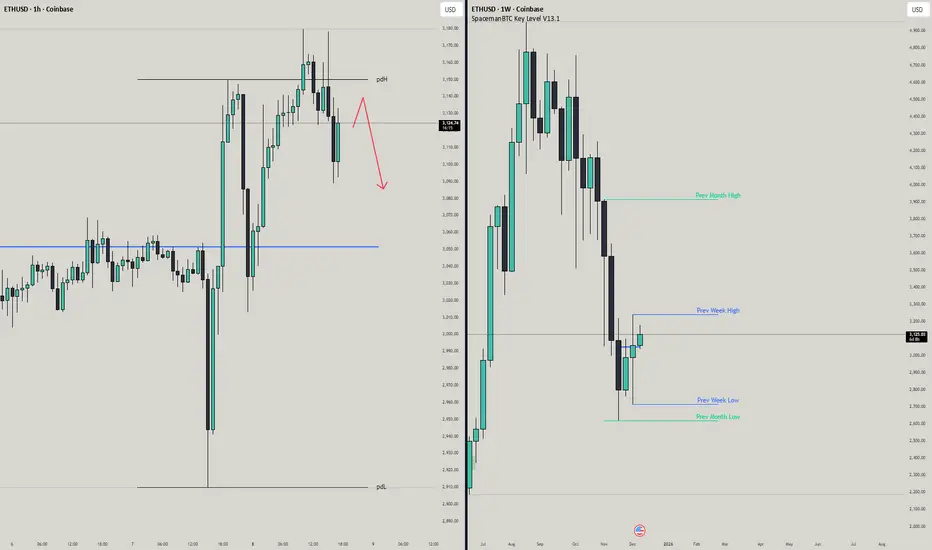
ETHUSD | RejectedEthereum showed a big rejection from the previous day high, same with bitcoin.
Will be looking for a retest of this level before going into any short positions.
When this retest happens I will be looking for a 15-30 minute candle close under the PDH.
Will be very careful entering though, daily chart is starting to look funky, with the weekly showing 2 green candles as well.
There certainly has been some bullish momentum that came in the last few days.
Let me know what your analysis is!
Stay safe out there and do your own due diligence, this is not investment advise!
$YM Long the pullback.In the Dow today, we're coming off yestserday's fresh breakout to the upside, which makes us bullish for today.
We're simply waiting for a pullback on the 30 minute chart. We want a touch of the Weekly VWAP +1 standard deviation. Stop loss just above Weekly-VWAP.
Manage your risk and wait for the real pullback! Happy trading.

EU Market Structure UpdateHello Traders, I hope you’re having a fantastic week.
Today in the EU , we saw a clear break of a weak higher high (HH) on the 4-hour chart. With that structure now broken, I’ve been waiting for a fractal market structure shift (MSS) on the 4-hour timeframe to set up a counter-trend play. Additionally, the continuation flip point of interest (POI) is very close. If we get confirmation at either POI, it could present a solid trading opportunity.

How to Build a Consistent Execution Checklist on TradingViewMost trading mistakes don’t come from bad strategy, they come from inconsistent execution.
An execution checklist removes guesswork and replaces it with structure.
When your actions follow a routine, your results stabilize.
TradingView gives you everything you need to build a checklist that stays visible, actionable, and tied directly to your chart.
1. Define Your Core Conditions
Before any trade, the bigger picture must be clear.
Start your checklist by answering three questions:
What is the higher-timeframe direction
Where is price relative to key levels
Is price approaching with strength or weakness
Use TradingView’s drawing tools to mark support, resistance, value zones, and session highs and lows.
Add a simple text note on the chart listing your core conditions so they are always visible.
If the market context fails this first screen, the trade is already invalid.
2. Build Confirmation Criteria
Once structure is confirmed, you move to evidence.
Mark confirmation areas directly on your chart:
Liquidity pools
Fair value zones or imbalances
Previous session highs and lows
Asian range or New York open
If your strategy uses indicators, document exact conditions:
Moving average position and slope
Volume behavior
VWAP location
Volatility expansion or contraction
Define rules that don’t change based on emotion.
Confirmation should prove your bias, not justify your urge to trade.
3. Validate Risk Before Execution
Every setup must survive a risk checkpoint before it’s allowed to go live.
Your checklist must answer:
Where is my invalidation level
How much capital am I risking
Does this violate any daily limits
Is the reward worth the risk
Use TradingView’s long or short position tool to visualize risk directly on the chart.
Save it as a template so your risk process stays uniform across all trades.
No trade is valid if risk isn’t clean.
4. Create a Pre-Execution Routine
A checklist only works if you actually follow it.
Add a short pre-trade process directly to your chart notes using checkboxes or bullet points:
Example execution checklist:
Market phase confirmed
Level identified
Confirmation present
Risk valid
Entry condition active
Walk through this list before clicking buy or sell.
If one item fails, the trade fails.
Over time, this routine removes emotional impulse completely.
5. Review and Refine Weekly
Your checklist isn’t static, it evolves.
Every week ask:
Where did I break my rules
What conditions led to losses
Which confirmations work best
What rules saved me from bad trades
Use TradingView’s trade replay and journaling features to review execution quality, not just profit.
Consistency improves when your system evolves with you.
Final Thought
A checklist doesn’t restrict your trading, it frees you from emotion.
When your process is clear, your confidence increases.
When your confidence increases, discipline follows.
Good traders make decisions.
Great traders execute procedures.
Stay Green!
BTCUSD BearishBitcoin has consolidation between 58150-60300 levels. Now bears control the market. 54800 level is bearish target.

$YM | Get long the pullback!Today we go through plans in $YM. After a large bull day, it's not the best day to trade as the market often needs a 'day of rest'. However, we were able to dig into our tools and come up with a solid plan to potentially get long.
Hopefully you can learn something from this video about how to make plans admit the chaos of the market.

AUDCHF: Price Cross Below H1 ATLDaily TF:
Price is ranging with a weak bearish bias
Strong trend indication will occur after price breaches below HTL
H1 TF:
Price crosses below ATL
Sell stop triggered as downside momentum is expected to pick up

NZDCHF: Trend ContinuationDaily TF
Not much to say other than price is in a clear downtrend
H1 TF
Price crossed below ATL and is holding
EMA20 is barely below EMA60 so this is a weak downtrend confluence
Trading: definitely proceed with caution and consider reducing size and then scaling in momentum picks up

Market Update — Long Opportunities on BTC, ETH & SOL📊 Market Update — Long Opportunities on BTC, ETH & SOL
Using Pro Trading Indicator by Dr. Hafiz
After a sharp downside move across the crypto market, our Pro Indicator has detected fresh long signals from major demand zones on BTC, ETH, and SOL. Price has reacted strongly from discounted levels, indicating the possibility of a technical rebound.
🟢 BTCUSDT — Long Signal Activated
Entry: 89,640
Stop Loss: 88,349
Targets: 91,181 → 92,490 → 93,799
RR: 1:3.22
Analysis:
BTC formed a clean bullish reaction from a strong demand block. A higher-timeframe support is holding well, and the Pro Indicator signal confirms buying momentum. As long as BTC stays above 88,800, the recovery should extend toward 91,200 and above.
🟢 ETHUSDT — Strong Reversal Zone
Entry: 2,920
Targets: 3,020 → 3,097 → 3,160
RR: 1:4.47
Analysis:
ETH printed one of the cleanest reversal patterns today. A bullish engulfing candle formed directly at our mapped support zone. With ETH leading recovery movements historically, breaking 3,020 is key for continuation toward higher targets.
🟢 SOLUSDT — Demand Zone Bounce
Entry: 133.10
Stop Loss: 129.92
Targets: 136.60 → 139.67 → 142.75
RR: 1:3.03
Analysis:
SOL showed quick strength soon after touching the support area highlighted by our Pro Indicator. If SOL maintains above 130.40, bullish continuation toward the 137–143 range is expected.
📌 Summary
The market is currently reacting from major support zones after the panic drop.
Our Pro Trading Indicator by Dr. Hafiz has captured premium long setups with excellent RR ratios. If BTC continues to hold above its base, altcoins may follow with more upside.

EURUSD 4H – Alligator “Sleep Phase” Before Next MoveAlligator lines have tightened after a bullish leg and are starting to turn down while price sits under the descending trendline → short-term momentum is weakening. The chart shows a clear triangle/descending resistance and support zones marked for targets.
What Alligator is saying
Sleeping / compressing now → wait for the Alligator to open (lines separate) before taking a directional trade.
If the Alligator opens down (green < red < blue) = bearish continuation.
If the Alligator opens up (green > red > blue) after a clean break above the trendline = bullish continuation.
Trade ideas (4H)
Bear (preferred while price below trendline):
Entry: Short on a close below 1.157 with Alligator stacking bearish.
1st TP: 1.1500 (support zone).
2nd TP: 1.1480–1.1460 (lower support cluster).
Stop: 1.1620–1.1640 (above consolidation / Alligator cluster).
Bull (counter / breakout):
Buy on a clean close above the descending trendline / 1.1610–1.1620 with the Alligator reopening upward.
Targets: 1.1647 (near resistance) → 1.1700 (upper target zone).
Stop: below 1.154 (recent swing low / Alligator cluster).
Risk & execution notes
Alligator tangled = no edge; prefer confirmed line separation and candle close for entries.
Use proper position sizing (1–2% risk), look for volume confirmation on breakouts.
Timeframe: this is a 4H read — check daily for stronger confirmation.

ENA/USDT Trading Analysis - SHORT PositionMarket Context
We're currently observing a well-defined bearish structure on ENA/USDT. After reaching peaks around 1.20 USDT, the pair is evolving within a descending channel characterized by lower highs and lower lows. Price has just completed a 5-wave Elliott impulse to the downside and is now forming an ABC correction that provides us with an excellent selling opportunity.
The major resistance zone sits at 0.2854 USDT, where the 20, 50, 100, and 200-period exponential moving averages converge. This technical confluence creates a strong ceiling that buyers will struggle to break through. Momentum remains weak with the RSI struggling to push above the neutral zone, confirming the exhaustion of bullish dynamics.
Trading Setup
I'm gradually entering a short position in the current zone between 0.2735 and 0.2767 USDT. This range represents an initial intermediate resistance where price is already showing rejection signs. If the market offers us a retest of the 0.2850-0.2854 zone, I'll add to my position as this is where our major resistance lies with the EMA convergence.
My stop loss is strategically placed at 0.2867 USDT, just above the critical resistance zone. This limits my risk to approximately 3.14% from the average entry point. For targets, I'm first aiming for 0.2401 USDT where significant historical support lies, then 0.2366 USDT which corresponds to our final technical projection. These levels offer us an attractive risk-reward ratio exceeding 1:2.
Key Operation Points
Entries:
Zone 1: 0.2735-0.2767 USDT ( immediate entry )
Zone 2: 0.2850-0.2854 USDT ( if retest occurs )
Exits:
Take Profit 1: 0.2401 USDT
Take Profit 2: 0.2366 USDT
Stop Loss: 0.2867 USDT
This solid technical configuration, combined with dominant bearish momentum and well-identified resistances, fully justifies this short position with excellent profit potential relative to the risk taken.

Risk Management for Automated SystemsAutomation gives you speed, consistency, and emotionless execution, but it also has a dark side.
A bot can follow rules perfectly, but if the rules are risky, it will amplify the danger with mechanical precision.
That’s why risk management is the backbone of every successful automated strategy.
It doesn’t matter how good your code is — without proper risk control, even the smartest system can fail fast.
Below are five core pillars of risk management that every trader should build into their automation framework.
1. Know Your Maximum Drawdown
Every trading system, even the best one, goes through losing streaks.
What matters isn’t avoiding them, but controlling how deep they cut.
Setting a maximum drawdown limit defines the exact point where your bot pauses or shuts down.
Whether it’s 5%, 10%, or 20%, this boundary protects your capital and your mindset.
Why it matters:
Prevents “death spirals” during high volatility
Stops the system if market conditions change
Forces you to step back and evaluate logic
Protects the account from black swan trends
A bot that can’t stop itself, is a bot that will eventually blow up.
A bot that knows when to stop, survives.
2. Position Sizing Is Everything
You can have the best entry logic in the world, but if your position sizes are inconsistent or too large, the system becomes unstable.
Smart position sizing adapts to:
Account balance
Market volatility
Asset liquidity
A fixed-percentage model, such as risking 1–2% per trade, keeps performance steady even during rough periods.
It also allows your system to grow naturally without taking oversized risks.
Think of sizing as the volume knob of your bot — turn it too high, and you distort everything.
3. Avoid Correlated Exposure
Running several bots doesn’t automatically mean you are diversified.
Many traders make the mistake of running multiple strategies that all rely on the same market behavior.
For example:
Three momentum bots on BTC, ETH, and SOL are still highly correlated
Two trend systems may fail at the same time if the market suddenly ranges
Several “dip-buying” strategies will all get hit hard during a crash
True diversification means mixing:
Uncorrelated assets
Different signal types
Varying timeframes
Both trend and mean-reversion logic
The goal is for your bots to perform differently, not identically.
4. Review Your System’s Risk Profile
Markets change, and so should your risk model.
Volatility increases and decreases, spreads widen, volume dries up, and certain assets become more unpredictable.
Regular reviews ensure your system stays aligned with real conditions.
What to check:
Has drawdown increased over the last quarter?
Are trades becoming larger than planned due to volatility shifts?
Has your system entered a new market phase it wasn’t designed for?
Are win rates or profit factor weakening?
A quarterly or monthly audit reveals issues before they explode.
Risk management isn’t a one-time setup — it’s a continuous process.
A strategy tester can be very good tool to help you manage risk properly and evaluate risk.
Here is an example from one of our strategies.
5. Let Risk Management Be Automated Too
If your entries are automated but your risk controls aren’t, you’re only half-protected.
Risk management logic you can automate:
Stop-loss placement
Progressive stop tightening
Position scaling
Reducing size after a losing streak
Pausing after reaching a daily or weekly limit
Complete shutdown at max drawdown
This turns your bot into a self-regulating system that responds to both opportunity and danger.
The more risk rules you automate, the less emotional interference you’ll face — and the more consistent your results become.

NZDUSD: Downtrend ConfluenceDaily TF Observations
Price is in a clean downtrend
H1 TF Observations
Price faked out of one ascending trend line (ATL)
However, price is making a clean break below the second ATL
EMA20 is also below EMA60

ETH/USD – Low-Volume Accumulation Breakout SetupETH/USD – Low-Volume Accumulation With Potential Early-Session Breakout Ahead
ETH/USD has been trading inside a tight, low-volume consolidation zone over the past few sessions. The daily volume profile shows a consistent drop in participation, indicating that larger players have stepped aside temporarily. Whenever price moves sideways on contracting volume, it often suggests accumulation or absorption, not weakness.
Historically on this chart, each period of suppressed volume has been followed by an impulsive breakout, as shown by the repeated patterns on the left side. The current structure is forming a similar setup.
Price continues to respect the Daily Value Area and is holding above a key support shelf, showing that sellers are failing to push the market lower—even with low volume. This is a sign of strength from passive buyers.
If today’s session also closes with muted volume, it sets the stage for a potential early-session expansion tomorrow, likely targeting the imbalance and low-volume area highlighted above.
The projected target zone aligns with the next liquidity cluster on the volume profile, where the market may attempt to print a new short-term high before deciding its next macro move.

Will gold continue to rise? XAUUSD forecast 10/14/251. Fundamental Analysis
Yesterday, gold dropped ~100 points from 4248 → 4145 due to information that after the US Government reopens, some important economic data (CPI, employment) might not be released on schedule.
This has lowered the expectation of a December rate cut to <50%, causing a technical adjustment.
➡ The major trend is still upward – today prioritize BUY.
Key level: 4208–4213
Above 421x: end of adjustment → prioritize BUY.
Below 421x: price may retest a lower BUY zone.
2. BUY zones (priority) – SL 10 points, TP 10–20 points (RR 1:1 → 1:2)
zone 1 : 4140–4143
Zone 2: 4134–4130
zone 3: 4120–4112
3. SELL reaction zones – SL 10 points, TP 10 points (RR 1:1)
zone 1: 4245–4248
zone 2: 4280–4285
zone 3: 4300–4305
4. Notes
Today is Friday → trade safely, quick TP.
Do not chase orders, only enter when price hits the zone.

GOLD HOLDS STRONG ABOVE $4,200! 🚀 XAUUSD DAILY MARKET ANALYSIS
Thursday, November 14, 2025
💰 GOLD HOLDS STRONG ABOVE $4,200! 📈
Current Price: $4,189 - $4,235 💎
Yesterday's Close: $4,231 (+0.86%)
Weekly Gain: +5.4% (MASSIVE!) 🔥
Status: 🟢 CONSOLIDATING AT HIGHS
🎯 MARKET UPDATE - WHAT'S HAPPENING NOW?
Gold is CONSOLIDATING above the critical $4,200 level after yesterday's explosive breakout! The market is catching its breath after a 5-day winning streak that pushed prices up over $330 from last month's lows.
Key Developments:
✅ Government Shutdown ENDED - US House passed funding bill
✅ Strong Above $4,200 - Holding key psychological level
✅ Fed Rate Cut at 80% - Economists now predicting December cut
✅ Four Consecutive Green Days - Bullish momentum intact
✅ Testing $4,235 - Approaching critical resistance zone
📊 TECHNICAL ANALYSIS
Market Structure: BULLISH CONSOLIDATION 🟢
The rally has paused for a healthy consolidation. This is NORMAL and HEALTHY after a 5.4% weekly gain. Gold is building a base for the next leg up!
Key Observation: Price is respecting the $4,189-$4,235 range today - this is a coiling pattern before the next move.
Critical Support Levels (BUY ZONES) 🔵
Support 1: $4,189 - $4,200 (MAJOR - Former resistance)
Support 2: $4,157 - $4,160 (Strong base)
Support 3: $4,114 - $4,120 (Key level)
Support 4: $4,048 - $4,060 (Breakout point)
Support 5: $3,987 - $4,002 (November open)
Key Resistance Levels (SELL/TARGET ZONES) 🔴
Resistance 1: $4,235 - $4,243 (Current test)
Resistance 2: $4,252 - $4,254 (Critical breakout level)
Resistance 3: $4,313 - $4,320 (Next target)
Resistance 4: $4,356 - $4,382 (All-time high zone)
📈 TECHNICAL INDICATORS
RSI (14): 64 (Bullish but cooling - Room to move higher) ✅
MACD: Positive and rising - Strong bullish signal ✅
Stochastic: Neutral zone - Allows for upward movement ✅
Moving Averages:
Price WELL ABOVE all EMAs ✅
EMA 20/50/200 all aligned bullish ✅
Golden Cross confirmed ✅
Volume: Strong on rallies, lighter on dips (Healthy) ✅
Bollinger Bands: Price near upper band - Volatility expansion mode
🎯 TODAY'S TRADING STRATEGIES
SCENARIO 1: BREAKOUT CONTINUATION 🚀 (65% Probability)
IF Gold Breaks Above $4,252:
This is the CRITICAL LEVEL to watch! A close above $4,252 signals resumption of the major uptrend.
LONG Setup:
Entry: Break and close above $4,252 with volume
Targets:
TP1: $4,313 📍 (+60 pips)
TP2: $4,356 📍 (+104 pips)
TP3: $4,382 📍 (+130 pips - All-time high retest)
Stop Loss: $4,210 (Below consolidation)
Risk/Reward: Excellent 1:3+ ratio ✅
SCENARIO 2: HEALTHY PULLBACK 📉 (35% Probability)
IF Gold Breaks Below $4,189:
A pullback would be healthy and provide better entry opportunities.
BUY THE DIP Strategy:
Entry Zone 1: $4,157-$4,170 (Best value)
Entry Zone 2: $4,114-$4,120 (Strong support)
Targets:
TP1: $4,200 📍
TP2: $4,243 📍
TP3: $4,280 📍
Stop Loss: Below $4,100
⚠️ NOTE: Dips are BUYING opportunities in this bullish trend!
💎 BEST TRADE SETUP FOR TODAY
CONSERVATIVE APPROACH (Recommended) 🎯
WAIT for one of these clear setups:
Option A - Breakout Trade:
Entry: Above $4,252 (confirmed break)
Target: $4,313 → $4,356
SL: $4,210
Option B - Pullback Trade:
Entry: $4,157-$4,170 (on dip)
Target: $4,243 → $4,280
SL: $4,135
DO NOT CHASE at $4,220-$4,240! Wait for clear direction.
🌍 FUNDAMENTAL ANALYSIS
BULLISH CATALYSTS ⬆️⬆️⬆️
✅ Fed Rate Cut Odds: 80% - Economists now strongly expect December cut
✅ Government Reopening - But delayed data creates uncertainty = Gold support
✅ Missing Economic Data - October CPI/jobs reports delayed/may never release
✅ Weak Labor Market - 11,000+ weekly job losses continue
✅ Dollar Weakness - DXY struggling at resistance
✅ Central Bank Demand - 634 tonnes purchased YTD, expecting 750-900 total
✅ ETF Inflows - $64 billion added in 2025
✅ Safe-Haven Demand - Geopolitical tensions persist
Risk Factors ⬇️
⚠️ Overbought Short-Term - RSI 64, near 70 threshold
⚠️ Profit Taking Risk - After 5-day rally (+5.4%)
⚠️ Resistance Zone - $4,235-$4,252 is strong barrier
⚠️ Data Clarity - If delayed data shows strength, could pressure gold
🔥 MARKET SENTIMENT: BULLISH WITH CAUTION
Analyst Consensus:
Short-term: Consolidation before next leg (Most likely)
Medium-term: Target $4,300-$4,400
Long-term: $4,700-$5,000 by 2026 (UBS/Goldman)
This Week:
Expected to test $4,252 resistance. Break above = Rally to $4,313+
End of November:
Analysts predict $4,230-$4,300 range
💡 PROFESSIONAL GAME PLAN
For DAY TRADERS:
⚡ Scalp the Range - Trade between $4,189-$4,235 with tight stops (20-30 pip targets)
Buy: $4,190-$4,200
Sell: $4,230-$4,235
Breakout: Above $4,252 → GO LONG aggressively
For SWING TRADERS:
📊 Wait for Clarity
Either breakout above $4,252 → Hold to $4,356
Or pullback to $4,157 → Buy for retest of $4,252
For LONG-TERM INVESTORS:
💎 Accumulate on Dips
Target: $4,150-$4,180 range
Goal: Hold for $4,500+ (2026 target)
Strategy: Dollar-cost averaging
📅 KEY EVENTS TO WATCH
THIS WEEK:
🎤 FOMC Speakers - Watch for rate cut signals
📊 Economic Data - Delayed reports may start releasing
🏛️ Government Funding - Impact on market sentiment
NEXT WEEK:
📈 November 21 - US Manufacturing & Services PMI
🎬 BOTTOM LINE (TL;DR)
Price: $4,189-$4,235 (Consolidating)
Bias: 🟢 BULLISH (Pullbacks are buying opportunities)
Key Level: $4,252 (Break this = Rally resumes)
Best Action: WAIT for breakout above $4,252 OR dip to $4,157
Risk Level: MEDIUM-HIGH (Volatility expected)
🔔 TODAY'S CRITICAL LEVELS
DO NOT CHASE between $4,220-$4,240!
BUY SIGNALS:
✅ Break above $4,252 with volume → GO LONG
✅ Dip to $4,157-$4,170 → BUY THE DIP
SELL SIGNAL:
❌ Break below $4,114 → Exit longs, potential reversal
NEUTRAL ZONE:
⚪ Between $4,189-$4,235 → Wait for direction
📊 TECHNICAL OUTLOOK
Trend: STRONGLY BULLISH ⬆️
Momentum: STRONG (but cooling) ⚡
Support: SOLID at $4,189-$4,200 🛡️
Resistance: TOUGH at $4,252 🚧
Pattern: Ascending channel with bullish flag forming
Next Move: Break $4,252 → Target $4,313-$4,382
⚠️ RISK MANAGEMENT RULES
✅ Position Size: Max 2% risk per trade
✅ Stop Loss: ALWAYS required - No exceptions!
✅ Take Profits: Lock 50% at TP1, trail rest
✅ Don't Chase: Wait for your setup patiently
✅ Respect $4,252: This is the make-or-break level
🎯 SWING TRADE SETUP (Multi-Day Hold)
Setup A - Breakout Play:
Entry: $4,254-$4,260 (after confirmed break)
Target 1: $4,313 (Hold 2-3 days)
Target 2: $4,356 (Hold 5-7 days)
Target 3: $4,382 (Hold 1-2 weeks)
Stop Loss: $4,210
Setup B - Pullback Play:
Entry: $4,150-$4,170 (if it dips)
Target 1: $4,243 (Hold 3-5 days)
Target 2: $4,313 (Hold 1 week)
Stop Loss: $4,120
🏆 PROFESSIONAL ANALYSIS SUMMARY
Gold has successfully rallied 5.4% this week and is now consolidating at the $4,200 psychological level. This is textbook healthy behavior after a strong rally.
The Setup:
Consolidation forms a bull flag pattern
Next move determines short-term direction
$4,252 is the line in the sand
Most Likely Scenario:
Brief consolidation (1-2 days) → Break above $4,252 → Rally to $4,313-$4,356
Alternative Scenario:
Healthy pullback to $4,157-$4,170 → Strong bounce → Retest $4,252
Either way, the TREND IS UP! 📈
💪 TRADING PSYCHOLOGY TIP
After a big rally, markets MUST consolidate. Don't panic if price pulls back slightly. Use dips as OPPORTUNITY, not fear. The trend is your friend - and this trend is BULLISH! 🚀
🎓 LESSON: THE BULL FLAG PATTERN
What we're seeing now is a BULL FLAG:
✅ Strong rally (flagpole) - Done
✅ Consolidation (flag) - Happening now
⏳ Breakout (continuation) - Coming soon!
Action: Wait for flag breakout above $4,252, then go LONG!
🔮 FORECAST
Today: Range between $4,180-$4,240
Tomorrow: Test of $4,252 or pullback to $4,157
This Week: Break $4,252 → Rally to $4,300+
End November: $4,280-$4,350 range
December: Potential retest of all-time high $4,382
⚠️ FINAL DISCLAIMER
This analysis is for educational and informational purposes only. Trading gold and forex involves substantial risk of loss. Never trade with money you cannot afford to lose. Always use proper risk management including stop losses. Past performance does not guarantee future results. Consult a financial advisor before making investment decisions.
📱 Like this analysis? Share it!
💬 Drop your trade setups in comments
🔔 Follow for daily 8:00 AM updates
👍 Hit that like button!
#Gold #XAUUSD #ForexTrading #TechnicalAnalysis #TradingView #GoldAnalysis #ForexSignals #DayTrading #SwingTrading #MarketAnalysis #BullFlag #TradingStrategy #GoldForecast

GBPUSD - 30min | OutlookGBPUSD looks like there's still some bullish momentum heading up to 1.323xx where new opportunities could present themselves, if GBPUSD manages to successfully break the diagonal resistance and close above 1.325xx we could expect to see more bullish momentum leading up to 1.35xxx and based on the current Outlook on the $-index we could see a weakening USD thus fueling the current bullish narrative, else if GBPUSD fails to break 1.324xx we could expect to see new short term bearish opportunities.

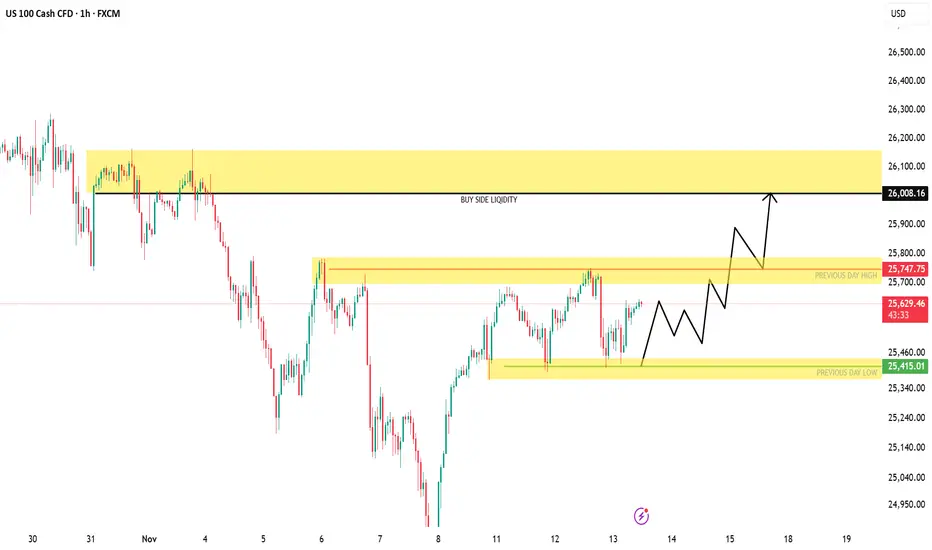
US100 | Building Liquidity for a Potential Push Toward 26,000NASDAQ (US100) is consolidating between 25,400–25,750, forming a potential accumulation zone below short-term liquidity. A clean break and retest above 25,750 could trigger a bullish expansion toward the 26,000–26,200 range, where major buy-side liquidity sits.
Market Structure:
Bias: Bullish (HTF structure shifting higher)
Key Demand Zone: 25,400 – 25,450
Breakout Zone: 25,750
Target Zone: 26,000 – 26,200
Invalidation: Below 25,400
Concepts: Liquidity Grab | Market Structure Shift | Demand Zone | Breaker Block | Smart Money Flow
GBPUSD: Testing Daily HTLKey Observations
- On the D1 TF, price is in a downtrend; however, it's currently testing a key HTL
- If price is able to hold below this level, this is a good indication of keeping my bearish bias
- However, the bullish daily bars is not a great sign for downside strength
- ATL had to be drawn multiple times, which is signaling a weaker price action and a point of concern for the downtrend strength

GBPCAD: Price Cross Below H1 ATLKey Observations
On the D1 TF, price is showing a weak bearish trend
EMA20 barely crossed below EMA60, however, price is showing more inside bars than what I'd like to see
On the H1 TF, price crossed below the ATL
Price is also accelerating away from the EMA band

Backtesting on TradingViewBased on the massive feedback from our previous article about backtesting we decided to make a follow up on how to backtest your strategy.
Every trader talks about strategy.
Few actually test it.
Backtesting is where ideas meet data — and TradingView makes it surprisingly simple.
Whether you code your own system or use built-in tools, backtesting shows you how your logic performs before you risk a single dollar.
1. Open the Strategy Tester
Start by opening the chart of the asset you want to test.
Click “Strategy Tester” at the bottom of the screen.
This activates TradingView’s built-in engine that simulates your system’s historical trades automatically.
You’ll see three tabs appear:
Overview: a summary of your results.
Performance Summary: key stats like profit, drawdown, and win rate.
List of Trades: every single historical trade your strategy executed.
2. Load or Create a Strategy
Go to the Indicators & Strategies tab.
TradingView separates indicators from strategies — only strategies can trigger trades for backtesting!
You have two options:
Use a built-in or public strategy: like “MACD Strategy” or “Moving Average Crossover.”
Paste your own Pine Script strategy: under “Pine Editor,” then click “Add to Chart.”
Once applied, TradingView automatically calculates historical trades based on your logic.
Tip: Indicators are for signals, strategies are for testing execution.
3. Adjust the Test Parameters
To make your test realistic, click the ⚙️ icon next to your strategy name.
In the Properties tab, you can define:
Initial capital (e.g. $10,000)
Position size (fixed or percent-based)
Commission and slippage
Pyramiding (how many positions can stack)
Then set your date range in the Strategy Tester — for example, test from 01-01-2022 to 01-01-2024.
The goal is to simulate what your system would have done under real conditions.
4. Analyze the Results
Once the test runs, TradingView gives you a detailed breakdown:
Net Profit (%) — your total gain or loss.
Max Drawdown — your biggest loss from peak to trough.
Win Rate & Profit Factor — how often you win and how much you win versus lose.
Average Trade — the mean result per trade.
Equity Curve — how your balance evolved over time.
Scroll through the List of Trades to see how each entry and exit behaved.
If you spot clusters of losses, note the pattern — that’s where improvements start.
This is the part where you analyze and think why did a trade fail and how can I avoid it.
TradingView also enables you to export data in excel so its super easy to analyze and look for improvement.
5. Refine and Forward-Test
Once you’ve seen how your system performs historically, make small adjustments.
Change one parameter at a time — like EMA length, RSI threshold, or stop-loss distance — and rerun the test.
When you find consistent results across timeframes or markets, move to paper trading mode.
Forward-testing confirms your backtest logic under real conditions, including live volatility and execution timing.
If your live and backtested results align closely, you’ve built something solid and you are ready to make money.
A big tip here, even a small thing such as a change in stop loss or timeframe change from 15 minutes to 14 minutes can make a huge difference so try out different conditions.
$YM | "Resistance" Zone, or low key breakout area? Let's analyzeToday, we discuss some nuance, so put on your analyst hats and let's dive in!
