Decred is set to hit a target of $162 in a flash (PP: 560%)Later on, you cannot say that you weren't warned. I am reminding you now.
To say that this chart is extremely bullish would be a huge understatement. It would be a lie.
Which adjective goes beyond "extreme"? Hyper?
DCRUSDT (Decred) is hyper bullish right now... Everything points higher.
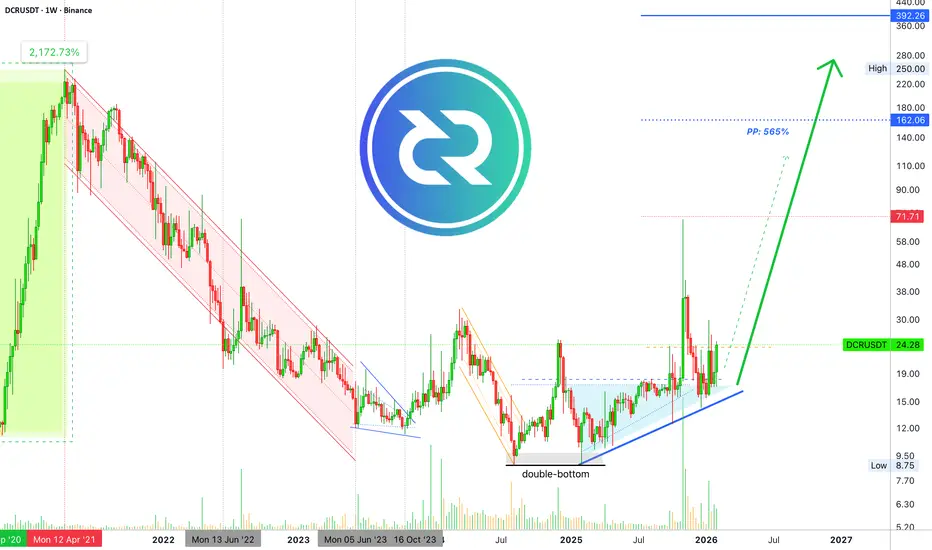
It has been rising since last year, February 2025. In November, it hit a target of $70 and after a retrace it started to produce higher lows. This gives us the chart we have today.
The current weekly session is full green and ready to perform another sudden fast huge bullish jump.
Since we have plenty of higher lows coupled with high volume and long-term growth, a higher high comes next. This opens up $162 as the next target, and this gives us more than 555% profits potential from current price on the next bullish jump.
Are you ready for a wild bullish wave?
I hope you are ready. You've been warned!
Namaste.
Dcr
DCRUSDT Forming Bullish MomentumDCRUSDT is forming a clear bullish momentum pattern, a classic bullish reversal signal that often indicates an upcoming breakout. The price has been consolidating within a narrowing range, suggesting that selling pressure is weakening while buyers are beginning to regain control. With consistent volume confirming accumulation at lower levels, the setup hints at a potential bullish breakout soon. The projected move could lead to an impressive gain of around 190% to 200% once the price breaks above the wedge resistance.
This bullish momentum pattern is typically seen at the end of downtrends or corrective phases, and it represents a potential shift in market sentiment from bearish to bullish. Traders closely watching DCRUSDT are noting the strengthening momentum as it nears a breakout zone. The good trading volume adds confidence to this pattern, showing that market participants are positioning early in anticipation of a reversal.
Investors’ growing interest in DCRUSDT reflects rising confidence in the project’s long-term fundamentals and current technical strength. If the breakout confirms with sustained volume, this could mark the start of a fresh bullish leg. Traders might find this a valuable setup for medium-term gains, especially as the pattern completes and buying momentum accelerates.
✅ Show your support by hitting the like button and
✅ Leaving a comment below! (What is your opinion about this Coin?)
Your feedback and engagement keep me inspired to share more insightful market analysis with you!

DCRUSDT Forming Falling WedgeDCRUSDT is forming a clear falling wedge pattern, a classic bullish reversal signal that often indicates an upcoming breakout. The price has been consolidating within a narrowing range after the recent decline, suggesting that selling pressure is steadily weakening while buyers are quietly stepping in to regain control. With consistent volume confirming accumulation at these lower levels, the setup is pointing toward a potential bullish breakout in the near term. If the price breaks decisively above the wedge resistance, the projected move could deliver an impressive gain of around 90% to 100% from the breakout point.
This falling wedge pattern is typically seen at the end of downtrends or during corrective phases, and it serves as a strong sign that market sentiment may be shifting from bearish to bullish. Traders closely watching DCRUSDT are observing a similar strengthening momentum as it approaches its own breakout zone. The healthy trading volume supporting the pattern adds real confidence, showing that market participants are getting positioned early in anticipation of a reversal.
The growing interest in DCRUSDT is fueled by increasing belief in the project’s long-term fundamentals combined with this attractive technical structure. A confirmed breakout backed by sustained volume could trigger the start of a fresh bullish leg. Traders might view this as a compelling setup for medium-term gains, especially once the wedge pattern fully resolves and buying pressure starts to accelerate.
✅ Show your support by hitting the like button and
✅ Leaving a comment below! (What is your opinion about this Coin)
Your feedback and engagement keep me inspired to share more insightful market analysis with you!

DCRUSDT Forming Falling WedgeDCRUSDT is forming a clear falling wedge pattern, a classic bullish reversal signal that often indicates an upcoming breakout. The price has been consolidating within a narrowing range, suggesting that selling pressure is weakening while buyers are beginning to regain control. With consistent volume confirming accumulation at lower levels, the setup hints at a potential bullish breakout soon. The projected move could lead to an impressive gain of around 190% to 200% once the price breaks above the wedge resistance.
This falling wedge pattern is typically seen at the end of downtrends or corrective phases, and it represents a potential shift in market sentiment from bearish to bullish. Traders closely watching DCRUSDT are noting the strengthening momentum as it nears a breakout zone. The good trading volume adds confidence to this pattern, showing that market participants are positioning early in anticipation of a reversal.
Investors’ growing interest in DCRUSDT reflects rising confidence in the project’s long-term fundamentals and current technical strength. If the breakout confirms with sustained volume, this could mark the start of a fresh bullish leg. Traders might find this a valuable setup for medium-term gains, especially as the wedge pattern completes and buying momentum accelerates.
✅ Show your support by hitting the like button and
✅ Leaving a comment below! (What is your opinion about this Coin?)
Your feedback and engagement keep me inspired to share more insightful market analysis with you!

DCR/USDT – Major Demand Zone: Accumulation or Breakdown?From a higher-timeframe perspective, DCR remains in a bearish / corrective structure after failing to sustain the previous distribution area following the impulsive rally. Price has now returned to a major historical demand zone (yellow block at 19 – 15.7), which previously acted as a strong base before a significant bullish expansion.
This zone is a critical decision area:
Holding → potential accumulation & reversal
Breaking → continuation of the bearish trend
---
Key Levels
Major Demand / Support:
🟨 19.0 – 15.7 (Yellow Zone)
Key Resistance Levels:
22.5
25.5
36.1
43.8
Previous Low: 13.3
Previous High: 70.0
---
Pattern & Structure Analysis
🔹 1. Descending Market Structure
Price continues to print lower highs and lower lows, confirming a broader bearish trend. However, the current price action shows compression and slowing momentum as it enters the demand zone.
🔹 2. Demand Zone Re-test
The yellow zone represents:
A former consolidation base
The origin of a strong impulsive bullish move
A re-test of such zones often triggers either a strong bounce or a decisive breakdown.
🔹 3. Possible Base Building / Early Accumulation
If price holds this zone and starts forming higher lows with increasing volume, the structure may evolve into an accumulation phase (early Wyckoff-style).
---
Bullish Scenario 📈
Valid if price holds above 15.7 and forms a higher low
Bullish Confirmation:
Strong rejection from the demand zone
Daily close above 22.5
Increasing volume on breakout
Bullish Targets:
🎯 22.5 (minor resistance)
🎯 25.5 (range high)
🎯 36.1 (major resistance)
🎯 43.8 (upper supply zone)
➡️ Bias: Accumulation → Trend Reversal
➡️ Optimal Buy Zone: 19 – 16
➡️ Risk: False breakout if volume remains weak
---
Bearish Scenario 📉
Valid if a strong daily close occurs below 15.7
Bearish Confirmation:
Breakdown of the major demand zone
Failed retest (support flips into resistance)
Bearish Targets:
🎯 13.3 (previous low)
🎯 Lower levels if selling pressure accelerates
➡️ Bias: Bearish continuation
➡️ Warning: A breakdown from a higher-timeframe demand zone often leads to fast expansion moves.
---
Conclusion
DCR is currently trading at a high-probability decision zone.
📌 The 19 – 15.7 area will determine whether price transitions into accumulation or continues its bearish trend.
Patience is key — wait for clear price action and volume confirmation before committing to aggressive positions.
---
#DCRUSDT #Decred #CryptoAnalysis #TechnicalAnalysis
#DemandZone #Accumulation #BearishTrend
#Altcoins #PriceAction #MarketStructure

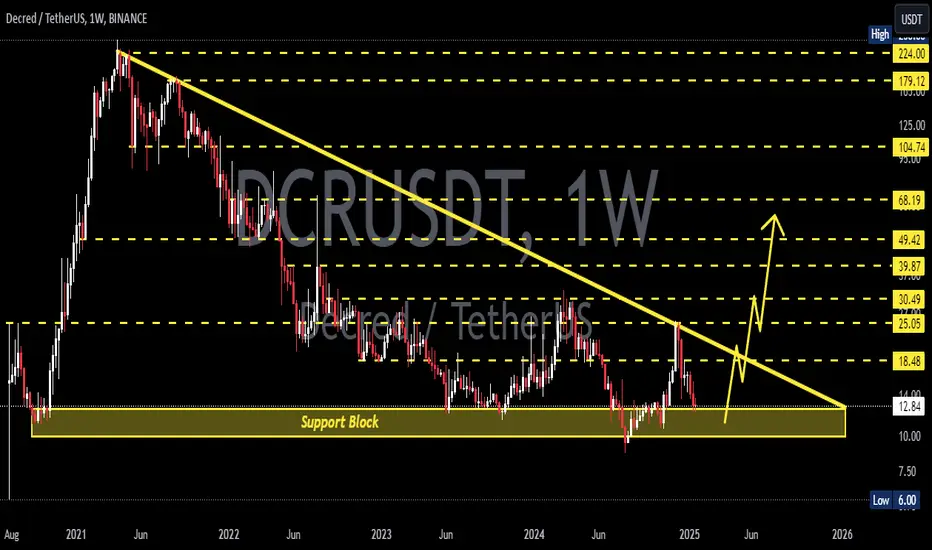
DCRUSDT — Long-Term Downtrend Pressure vs Major Demand ZoneDecred (DCR) on the Weekly timeframe is still trading within a long-term bearish structure, characterized by a clear sequence of lower highs and lower lows since the 2021 peak. However, price is currently sitting inside a major historical demand zone at 14.5 – 11.5, which has repeatedly acted as a strong accumulation base in the past.
This zone is a critical decision area that will determine whether DCR can form a macro reversal or continue its long-term decline.
---
Pattern Explanation
1. Descending Trendline (Primary Resistance)
The descending yellow trendline represents a long-term bearish resistance originating from the 2021 all-time high.
Multiple breakout attempts have failed, with price consistently getting rejected and continuing lower.
2. Base Accumulation / Long-Term Demand Zone
The yellow box at 14.5 – 11.5 marks a strong demand area that:
Previously acted as major resistance
Hosted extended consolidation phases
Has absorbed selling pressure multiple times
This behavior suggests possible long-term accumulation.
3. False Breakout & Strong Rejection
The sharp impulse toward the 39–44 zone was followed by aggressive rejection, indicating a liquidity grab rather than a sustainable bullish breakout.
---
Key Levels
Major Support (Demand Zone): 14.5 – 11.5
Immediate Resistance: 17.5 – 18.5
Mid Resistance: 24.7 – 28.4
Major Resistance: 39.4 – 44.0
Long-Term Bullish Extensions: 67.8 – 104 – 179
---
Bullish Scenario
Price holds firmly above the 14.5 – 11.5 demand zone
A weekly higher low is formed
A confirmed weekly close above the descending trendline
Additional bullish confirmation if:
Price reclaims the 18 – 20 area
Volume expands during the breakout
Bullish Targets (Step by Step):
18.5 → 24.7 → 28.4
Long-term extensions toward 39 – 44, and potentially 67+ if the broader market cycle supports it
---
Bearish Scenario
Price fails to hold the 14.5 – 11.5 zone
A weekly close below 11.5
This breakdown would likely trigger:
Bearish continuation
Potential acceleration toward the 7 – 6 (ATL zone)
A loss of this demand area would confirm that the long-term bearish trend remains dominant.
---
Conclusion
DCRUSDT is currently trading at a make-or-break zone on the macro timeframe.
The 14.5 – 11.5 demand zone is the key level defining the next major move.
Holding above it → macro reversal potential
Breaking below it → bearish continuation risk
Until price breaks and holds above the descending trendline, patience and confirmation remain essential on the weekly timeframe.
---
#DCRUSDT #Decred #CryptoAnalysis #WeeklyChart #MacroAnalysis #Downtrend #DemandZone #SupportResistance #AltcoinAnalysis #PriceAction #MarketStructure #CryptoTrading

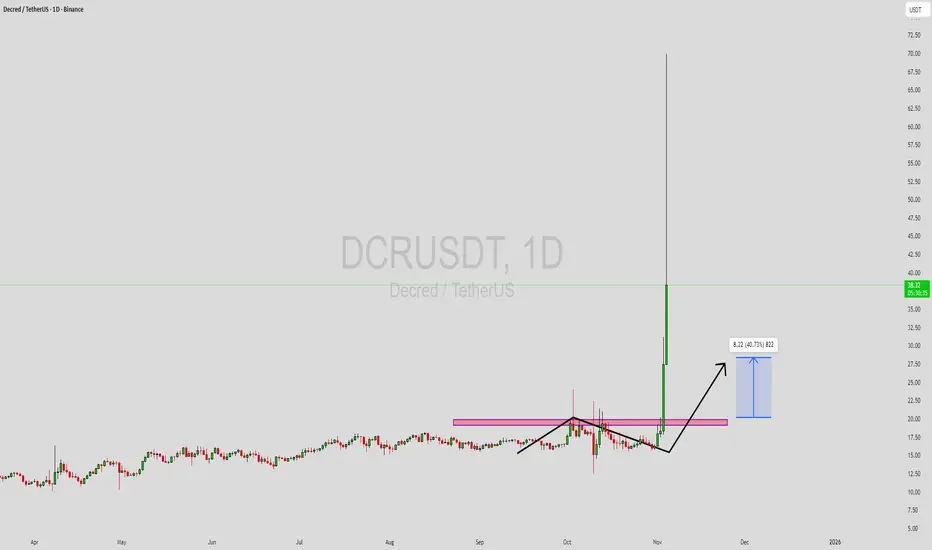
DCR is testing the red resistance zone 🚨📊 DCR Update
DCR is testing the red resistance zone 🔴.
If breakout happens, first target = green line level 🟩🎯.

DCR Update🚨📊 DCR Update
DCR is testing the red resistance zone 🔴.
If price breaks out above this level,
the first target will be the green line level 🟢.
This zone is the key barrier standing in the way of the next bullish move.

DCRUSDT Forming Bullish Momentum DCR/USDT is starting to show very encouraging bullish momentum, suggesting that Decred (DCR) could be gearing up for a meaningful move. On-chain, price has held up after recent consolidation, and trading volume is climbing — signs that accumulation may be occurring and that bullish participants are stepping back in. This shift could set the stage for a breakout if DCR can push past its near-term resistance levels with strength.
From a fundamental standpoint, Decred is a deeply ambitious project. It’s built on a hybrid consensus model that combines proof-of-work with proof-of-stake, giving both miners and stakers a meaningful role in governance. This governance by stake model is central to its value, as holders can vote on protocol changes and budget allocations, making the network highly decentralized and community-driven. The supply dynamics also work in its favor: Decred has a capped maximum supply of 21 million DCR, with roughly 17 million currently in circulation, which supports scarcity.
Strategically, the key will be to watch for a clean breakout above consolidation. If DCR breaks higher on strong volume and holds that level, it would confirm genuine bullish conviction. A pullback to retest this breakout could offer an ideal risk-reward entry. On the downside, placing a stop just below the recent support zone would provide a defined invalidation point. Given the fundamentals and structural setup, the upside potential is compelling if the momentum continues to build.

DCR Update📊 DCR Update
DCR is testing the blue support zone 🔵
A break below this level is possible, which could signal further downside 🔻
Watch this zone closely — it’s a key level for the next move.

DCRUSDLooks like Decred is ready for a huge race in the next hours. Let's see how it performs.
This is not a financial advice. Do Your Own Research

DCR Update📊 DCR Update
DCR is testing the red resistance zone 🔴
If it breaks out above, it could confirm a bullish setup 📈
The first target would be the green line level 🟢

DCR Update📊 PSX:DCR Update
PSX:DCR is testing the red resistance zone 🔴
If it breaks out above, it could confirm a bullish setup 📈
The first target would be the green line level 🟢

DCR - The Calm Before the Next Impulse!📈DCR has recently surged in a parabolic manner, posting one of its strongest rallies in months. However, after such a vertical move, a correction phase was inevitable, and that’s exactly what we’re seeing now.
📉At the moment, price is retracing within a clear descending channel, approaching a massive confluence zone marked by the demand area and the lower red trendline. This intersection represents a key area of interest to look for potential long setups.
⚔️If buyers manage to defend this zone, DCR could soon resume its next impulsive leg upward, potentially breaking out of the correction structure and extending the broader bullish momentum.
⚠️ Disclaimer: This is not financial advice. Always do your own research and manage risk properly.
📊All Strategies Are Good; If Managed Properly!
~Richard Nasr

DCRUSDT Forming Bullish MomentumDCRUSDT is currently showing a strong bullish momentum pattern, signaling a potential continuation of its upward trajectory. The market structure suggests that buyers are gaining control, and recent price action reflects growing investor confidence. With solid trading volume supporting this movement, DCRUSDT is positioned for a possible breakout that could deliver gains of 30% to 40% in the short to medium term. This kind of setup often attracts both technical and fundamental traders looking to capitalize on early trend shifts.
The bullish momentum pattern forming on DCRUSDT indicates a clear shift from consolidation to accumulation, with higher lows gradually building the base for a stronger rally. The consistent buying pressure combined with favorable market sentiment adds weight to the bullish scenario. If the price maintains its strength above key support zones and breaks through resistance with conviction, it could ignite a sustained upward move that aligns with the projected profit range.
As trading volume remains healthy and investor interest continues to grow, DCRUSDT appears to be in the early stages of a bullish wave. This coin has shown resilience even during market corrections, suggesting strong underlying demand and potential for continued upside. Traders watching this setup should look for confirmation of a breakout, as momentum indicators are already hinting at increased strength in the trend direction.
✅ Show your support by hitting the like button and
✅ Leaving a comment below! (What is You opinion about this Coin)
Your feedback and engagement keep me inspired to share more insightful market analysis with you!
Just In: Decred ($DCR) Spike Nearly 100% Today Amidst Market DipThe price of Decred ( PSX:DCR ) saw a noteworthy uptick of nearly 100% today albeit market bloodbirth. Tokens like $ZCASH, NASDAQ:DASH , and CRYPTOCAP:ICP followed the same pattern too.
As of the time of writing, PSX:DCR is up 43% trading within a broken symmetrical triangle with an RSI of 67 as per the 4-hour price chart.
Momentum is still going up, however, caution should be taken in the case of a pullback.
About Decred
Decred, launched in 2016, represents a significant evolution in the cryptocurrency space, emphasizing a blend of security, user empowerment, and adaptability. It stands out due to its innovative consensus mechanism that combines Proof-of-Work (PoW) and Proof-of-Stake (PoS), a method designed to ensure that both miners and coin holders contribute to the network's decision-making process.

DCR/USDT Breaks 3-Year Downtrend – Macro Reversal in Motion📍 Macro Overview:
After being trapped in a multi-year downtrend since early 2021, Decred (DCR) has now shown signs of a major breakout from the long-term descending trendline. This moment could mark a pivotal shift from accumulation to expansion, offering a strong bullish macro setup.
🧠 Technical Pattern & Structure Analysis:
🔸 Dominant Pattern:
A long-standing descending triangle has formed, with a solid demand zone between $11.00 - $13.00, tested multiple times over the past 2 years.
While traditionally a bearish pattern, breaking to the upside here signals a reversal structure and the start of bullish momentum.
🔸 Breakout Confirmation:
Price has now clearly broken above the long-term downtrend line originating from the 2021 top.
This breakout implies a macro trend shift, opening the door for a series of higher highs and higher lows.
🔸 Strong Accumulation Zone:
The yellow zone ($11–$13) has proven to be a high-conviction demand area, likely indicating institutional accumulation.
✅ Bullish Scenario (High Probability):
If the breakout holds and volume confirms:
📌 Key Upside Targets:
1. $24.71 → First major resistance
2. $28.44 → Psychological level and historical S/R flip
3. $34.00 → Local top from recent past
4. $39.46 → Strong horizontal resistance
5. $67.89 → 2022 resistance and bullish confirmation level
6. $104.40 → Mid-term parabolic extension target
📈 Likely structure: Breakout → Retest → Multi-wave rally upward.
> Strategy: Ideal for Buy on Retest or Swing Long setups.
❌ Bearish Scenario (Low Probability – Risk Management):
If the breakout fails and price dips back below $13:
Expect potential pullback to $11.00 - $10.00 support
Worst-case bearish continuation could revisit $6.00 (macro support)
Would signal a false breakout and continuation of the bearish trend
> Risk Strategy: Watch the volume – weak volume could imply a fakeout.
🔍 Supporting Technical Signals:
📊 Volume: Strong volume confirmation is essential for breakout validity
📈 Indicators Supporting Bullish Bias:
Weekly RSI hovering at neutral-bullish zones
Potential for a weekly EMA crossover (golden cross)
OBV shows signs of increasing accumulation pressure
🧭 Conclusion & Strategy Insight:
This chart is signaling a high-conviction macro opportunity.
Breaking out from a 3-year downtrend is a rare technical event that has historically led to exponential moves. The key is confirmation through volume and healthy consolidation above the breakout line.
> "The longer the base, the stronger the breakout."
#DCR #Decred #AltcoinBreakout #MacroReversal #CryptoChartAnalysis #BullishSetup #CryptoTechnicalAnalysis #TrendReversal #AltcoinSeason

DCR (SPOT )BINANCE:DCRUSDT
DCR / USDT
(4H + 1D) time frames
analysis tools
____________
SMC
FVG
Trend lines
Fibonacci
Support & resistance
MACD Cross
EMA Cross
______________________________________________________________
Golden Advices.
********************
* Please calculate your losses before any entry.
* Do not enter any trade you find it not suitable for you.
* No FOMO - No Rush , it is a long journey.
Useful Tags.
****************
My total posts
www.tradingview.com

DCRUSDT 1WDCR ~ 1W Analysis
#DCR Buy gradually from here with a short -term target of at least 20%+. This is a very good support to start buying again.

DCRUSDT 1WDCR ~ 1W Analysis
#DCR In Time Frame 1W re -test this support block. Buy from here if you still have a Conviction on this coin with a minimum target of 20%+
DCRUSDT Analysis: Key Demand Zone IdentifiedThe blue box displayed on the chart represents a valuable demand zone , where potential buying interest could arise. This area is carefully chosen based on advanced analysis techniques.
Highlights:
Demand Zone: The blue box is a strong candidate for a reaction from buyers.
Market Awareness: Align trades with overall market conditions for better success.
Confirmation Tools:
When trading within the blue box, I rely on indicators such as:
CDV (Cumulative Delta Volume)
Liquidity Heatmap
Volume Profile
Volume Footprint
Upward Market Structure Breaks on Lower Time Frames
Want to Learn?
If you'd like to learn how to use these techniques effectively, DM me for guidance on trading with precision.
Reminder:
Maintain disciplined risk management and always adapt to market conditions. Wishing you successful trades!
If you think this analysis helps you, please don't forget to boost and comment on this. These motivate me to share more insights with you!
I keep my charts clean and simple because I believe clarity leads to better decisions.
My approach is built on years of experience and a solid track record. I don’t claim to know it all, but I’m confident in my ability to spot high-probability setups.
If you would like to learn how to use the heatmap, cumulative volume delta and volume footprint techniques that I use below to determine very accurate demand regions, you can send me a private message. I help anyone who wants it completely free of charge.
My Previous Analysis (the list is long but I think it's kinda good : )
🎯 ZENUSDT.P: Patience & Profitability | %230 Reaction from the Sniper Entry
🐶 DOGEUSDT.P: Next Move
🎨 RENDERUSDT.P: Opportunity of the Month
💎 ETHUSDT.P: Where to Retrace
🟢 BNBUSDT.P: Potential Surge
📊 BTC Dominance: Reaction Zone
🌊 WAVESUSDT.P: Demand Zone Potential
🟣 UNIUSDT.P: Long-Term Trade
🔵 XRPUSDT.P: Entry Zones
🔗 LINKUSDT.P: Follow The River
📈 BTCUSDT.P: Two Key Demand Zones
🟩 POLUSDT: Bullish Momentum
🌟 PENDLEUSDT.P: Where Opportunity Meets Precision
🔥 BTCUSDT.P: Liquidation of Highly Leveraged Longs
🌊 SOLUSDT.P: SOL's Dip - Your Opportunity
🐸 1000PEPEUSDT.P: Prime Bounce Zone Unlocked
🚀 ETHUSDT.P: Set to Explode - Don't Miss This Game Changer
🤖 IQUSDT: Smart Plan
⚡️ PONDUSDT: A Trade Not Taken Is Better Than a Losing One
💼 STMXUSDT: 2 Buying Areas
🐢 TURBOUSDT: Buy Zones and Buyer Presence
🌍 ICPUSDT.P: Massive Upside Potential | Check the Trade Update For Seeing Results
🟠 IDEXUSDT: Spot Buy Area | %26 Profit if You Trade with MSB
📌 USUALUSDT: Buyers Are Active + %70 Profit in Total
🌟 FORTHUSDT: Sniper Entry +%26 Reaction
🐳 QKCUSDT: Sniper Entry +%57 Reaction
📊 BTC.D: Retest of Key Area Highly Likely
I stopped adding to the list because it's kinda tiring to add 5-10 charts in every move but you can check my profile and see that it goes on..

Decred: Big PUMP comingForgotten currency, however, it continues in full development. Nothing has changed.
Total supply: 16.51M DCR (61.90 % of circulating supply is locked in stake).

DCRUSDT: Blue Box as a Buyer ZoneThe blue box on the chart represents a key buyer zone, identified through meticulous technical analysis. This area signals a region where the price is likely to find strong support and attract buying interest, potentially leading to a reversal or upward movement.
1. Understanding the Buyer Zone
A buyer zone is a specific area on the chart where demand exceeds supply, often causing the price to bounce or rally.
Significance of the Blue Box: This zone highlights a demand area where institutional or retail buyers are expected to show interest.
Confluence Factors: The zone is supported by technical indicators such as Fibonacci retracements, historical support levels, or order block formations.
2. Why This Zone?
The blue box is not arbitrarily drawn; it is derived from a combination of the following analyses:
Market Structure: Price has consistently respected this area as a key level in the past, indicating its reliability.
Volume Analysis: High volume at this price range suggests a strong likelihood of buyer activity.
Fibonacci Retracement: The zone aligns with critical retracement levels, further solidifying its validity.
3. How to Trade the Blue Box
The blue box should be approached with a clear plan to manage risk and maximize returns.
Entry Strategy: Wait for the price to enter the blue box and look for confirmation signals like bullish candlestick patterns or volume spikes before entering a long position.
Stop-Loss Placement: Position your stop-loss just below the lower boundary of the blue box to account for false breakouts.
Take-Profit Levels: Target recent resistance areas or Fibonacci extensions for a favorable risk-to-reward ratio.
4. Key Notes
Keep an eye on market conditions and additional confirmations to refine your trade setup.
Volume spikes or bullish divergences can further validate the zone's strength.
Breakouts above nearby resistance after bouncing from the blue box may indicate a continuation of the uptrend.
I keep my charts clean and simple because I believe clarity leads to better decisions.
My approach is built on years of experience and a solid track record. I don’t claim to know it all, but I’m confident in my ability to spot high-probability setups.
My Previous Analysis
🐶 DOGEUSDT.P: Next Move
🎨 RENDERUSDT.P: Opportunity of the Month
💎 ETHUSDT.P: Where to Retrace
🟢 BNBUSDT.P: Potential Surge
📊 BTC Dominance: Reaction Zone
🌊 WAVESUSDT.P: Demand Zone Potential
🟣 UNIUSDT.P: Long-Term Trade
🔵 XRPUSDT.P: Entry Zones
🔗 LINKUSDT.P: Follow The River
📈 BTCUSDT.P: Two Key Demand Zones
🟩 POLUSDT: Bullish Momentum
🌟 PENDLEUSDT: Where Opportunity Meets Precision
🔥 BTCUSDT.P: Liquidation of Highly Leveraged Longs
🌊 SOLUSDT.P: SOL's Dip - Your Opportunity
🐸 1000PEPEUSDT.P: Prime Bounce Zone Unlocked
🚀 ETHUSDT.P: Set to Explode - Don't Miss This Game Changer
🤖 IQUSDT: Smart Plan
⚡️ PONDUSDT: A Trade Not Taken Is Better Than a Losing One
💼 STMXUSDT: 2 Buying Areas
