DCRUSD $72+? Elliot Wave AnalysisMy thesis on why DCR will hit $72 and is in an excellent spot to enter currently:
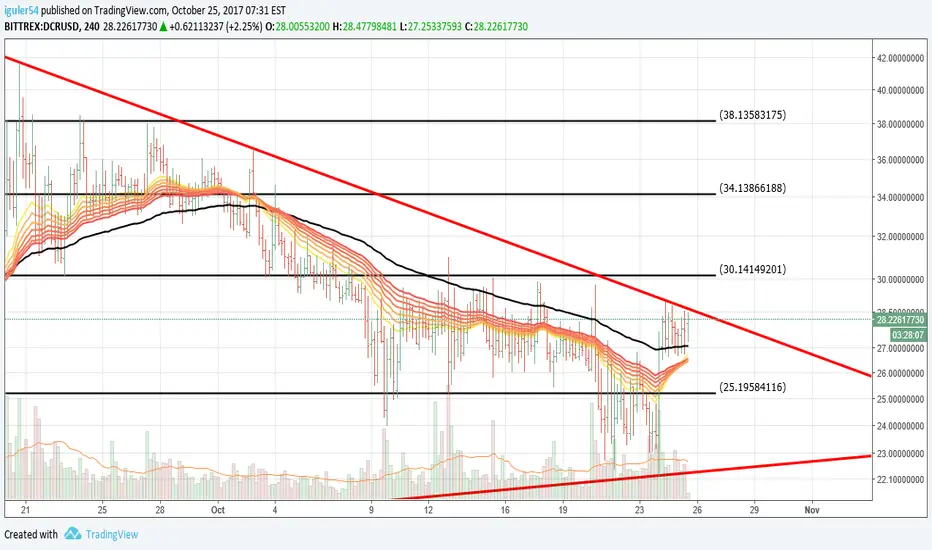
-Trading at the bottom of the support of the wave 4 triangle
-5 ABC patterns already completed (drawn on 15m candles)
-Still well above the cloud on 2h and 1d timeframes, currently at near the bottom of the support of the cloud on 1h making it an excellent entry
-Conversion-line still above base-line on 2h and 1d candles
-Cloud green on 1h, 2h, and 1d candles
-Substantial P/L ratio, even with minimum PT of 1.618 extensions of W1-2. If it reaches the stop loss, then the trade is complete void, and the waves invalidated. In other words, a 5:1+ P/L ratio for the worst good scenario and the worst, worst case scenario.
-This Elliot wave analysis comes after a breakout of a considerable consolidation phase showing that it isn't just a fluke
Please leave any feedback in the comments below. I have been unable to respond to comments recently, so if you have a question feel free to PM me. I am trying some new changes to my strategy in hopes of better success.
DCRUSD

Decred Closer to a BreakoutI think Decred is inching closer towards breaking out of the symmetrical triangle pattern that it's in. My guess is we break out before the end of 2017 and begin a rally towards a much higher price base.

DCR end of consolidation / Looking for a doubleDECRED has ended it's long consolidation, flag pole target is looking for at least 70 USD
MAs are flat
Lightning network activates in 3 days!
Should be getting payment integration too which will really make it blow up imo.
I'm staking my long term stash of DCR (yes PoS PoW hybrid with governance) - do your research!


DCRUSDDECRED
Positive long-term view. Elliott wave+ fibonacci levels. Now moving in triangle. Waiting for break out resistance line on triangle
