How to use Order Flow / Delta Volume Indicator for IntradayWhat you’re seeing
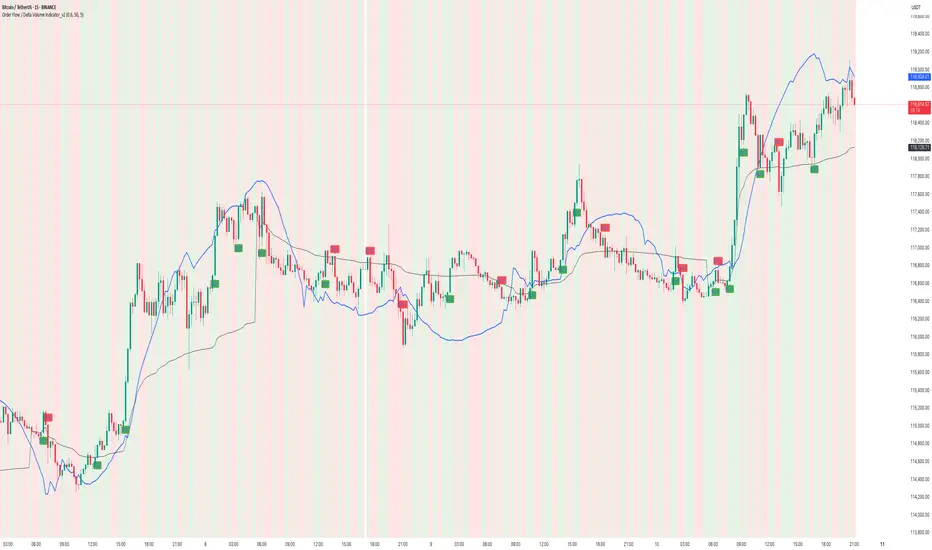
This idea visualizes an intraday session with my Order Flow / Delta Volume study applied. The chart overlays three things that matter for short-term context:
• Cumulative delta (blue line) : running sum of delta, rescaled so it’s easy to compare to price swings.
• VWAP (grey line) : session anchor for bias and mean-reversion context.
Signal logic (kept simple & rule-based)
A bar is considered imbalanced when one side’s volume dominates the bar’s total volume.
• Imbalance: upVol / totalVol > 0.60 → buy-side imbalance; downVol / totalVol > 0.60 → sell-side imbalance.
• Trend/strength filters (optional but enabled here):
• VWAP filter → longs only when price > VWAP; shorts only when price < VWAP.
• RSI(14) filter → longs only if RSI > 50; shorts only if RSI < 50.
• Noise throttle: minimum 5 bars between signals + price must exceed the prior close by ±ATR(14) to avoid tiny wiggles.
These rules try to capture moments when flow (delta) and context (VWAP/RSI) line up, while the ATR and cooldown help skip low-quality, back-to-back prints.
How to read the chart
• Rising blue cumulative-delta with price above VWAP → constructive backdrop for longs; fading/ranging delta warns to de-risk or wait.
• Green “ BUY ” labels plot when a buy-side imbalance clears the filters; red “ SELL ” labels mark sell-side imbalances with bearish context.
• Background tints briefly highlight where the raw imbalance occurred (light green/red), even when a trade filter blocks a signal.
Walk-through of the attached example
• Trend leg after a base: cumulative delta turns up first and price reclaims VWAP → several filtered BUY signals print into the push; ATR gate avoids chasing the very first small upticks.
• Mid-session chop: delta flips around the zero line and price hovers near VWAP → far fewer signals; most imbalances are filtered out by RSI/VWAP or fail the ATR move requirement.
• Late expansion: a swift VWAP reclaim with strong positive delta → clustered BUY signals that track the follow-through, while opposing sell imbalances near VWAP are rejected by filters.
Inputs used on this chart
• Imbalance threshold: 0.60
• VWAP filter: On
• RSI filter: On, threshold 50
• Cooldown: 5 bars
• ATR length: 14
Notes
• This is not a trade recommendation. Signals highlight where participation leans, not certainty of direction.
• Best paired with your execution plan (risk unit, stop location, partials near prior S/R or VWAP).
• In fast spikes, delta can be extreme—ATR and the cooldown help, but slippage and whipsaws are always possible.
• For instruments with very low volume or during illiquid hours, consider raising the imbalance threshold or disabling signals altogether.
Takeaway
Order-flow imbalance by itself fires often; layering VWAP, RSI, and an ATR-based movement check concentrates signals to moments when both flow and context align. The attached session shows that behavior clearly: fewer prints in chop, more conviction when cumulative delta trends and price holds its side of VWAP.
Educational post for discussion only. No financial advice.
Deltavolume
HOW To use Order Flow / Delta Volume Indicator to identify TrapOrder Flow / Delta Volume Indicator: Performance & Trap Identification Analysis
### Overview
The Order Flow / Delta Volume Indicator analyzes real-time buying and selling imbalances , accurately capturing momentum shifts and highlighting potential market traps . This analysis clearly demonstrates the indicator’s effectiveness in pinpointing trend reversals, momentum shifts, and identifying price traps.
Indicator Functionality
- ** Order Flow Dynamics **: Tracks cumulative buy/sell volumes, indicating shifts in market sentiment.
- ** Delta Volume Analysis* *: Highlights buyer-seller imbalances, pinpointing precise moments of significant market activity or divergences.
- **Signal Logic**:
- ** Buy Signals **: Generated when positive order flow aligns with positive delta, suggesting buying dominance.
- ** Sell Signals **: Produced when negative order flow and negative delta indicate increased selling pressure.
- ** Trap Identification **: Divergence between cumulative delta and price direction signals potential market traps . For instance, rising prices with declining cumulative delta suggest weakening buying pressure and possible bearish reversals (traps).
Performance Insights (from chart)
1. **Bullish & Bearish Signal Accuracy**
- Clear, timely bullish and bearish signals aligned precisely with genuine market momentum shifts.
- Robust performance capturing sharp upward and downward price movements, validated by volume spikes.
2. **Effective Market Trap Identification**
- Detected key divergences between cumulative delta and price movement, effectively highlighting potential market traps.
- Example highlighted: recent market scenario where price rose while cumulative delta declined, signaling weakening bullish momentum and indicating a potential bearish reversal.
3. **Momentum Shift Reliability**
- Successfully differentiated significant momentum changes from short-lived price movements.
- Signals consistently matched subsequent market behavior, reinforcing the indicator’s reliability.
Key Takeaways
✅ Accurate and timely identification of trend reversals and continuation.
✅ Effective in highlighting divergences, significantly aiding in identifying market traps.
✅ Clear volume-based signals, ensuring traders can easily interpret market conditions.
✅ Consistent performance across diverse market scenarios, demonstrating strong analytical capability.
The Order Flow / Delta Volume Indicator remains an essential tool, reliably capturing crucial market turns and effectively highlighting potential traps through clear cumulative delta divergences.

How to Spot Market Turns using Order Flow & Delta Volume Ind.Overview
The Order Flow / Delta Volume Indicator combines order flow dynamics with delta volume analysis , pinpointing market shifts by tracking buying and selling pressure . This chart analysis demonstrates how effectively the indicator identifies precise moments of market turns and shifts in momentum.
How It Works
Order Flow Dynamics
Tracks cumulative buying and selling volumes.
Identifies potential reversals by highlighting shifts in order flow direction.
Delta Volume Analysis
Measures the difference between buying and selling volume (delta).
Pinpoints exact candles where buyer-seller imbalance occurs.
Signal Generation Logic
Buy signals emerge when order flow and delta volume confirm rising buying pressure.
Sell signals appear when order flow combined with negative delta signals increased selling activity.
Signal Confirmation (Magical part of this Indicator), Blue line inlines with trend to confirm the strength, else it's a trap move.
Performance in This Case Study
Market Reversal Precision
Accurately highlighted buy signals at key reversal points where bullish order flow resumed.
Provided timely sell signals precisely at points of bearish order flow dominance.
Trend Confirmation
Signals effectively filtered market noise, clearly distinguishing actual trend shifts from temporary price fluctuations.
Consistent alignment of signals with subsequent price action confirmed robust indicator performance.
Volume-Based Clarity (Blue Line)
Delta volume effectively differentiated real momentum changes from false breakouts.
Order flow dynamics reliably indicated market sentiment shifts, offering clarity in volatile conditions.
Key Takeaways
✅ Order flow shifts clearly indicated genuine trend reversals.
✅ Delta volume accurately pinpointed moments of market imbalance.
✅ Signals reliably differentiated between temporary fluctuations and meaningful market movements.
✅ Indicator performance remained robust across varying market conditions.
This indicator's precise alignment with market behavior underscores its practical utility in identifying and analyzing market turns.

Volume Delta explained : BTC exampleHello community,
One of the most powerful indicators added by TradingView recently is the Volume Delta indicator.
Practical Explanations :
The volume delta indicator serves as a crucial tool for traders, providing insights into the ongoing war between buyers and sellers in the market. 📊 Without it, relying solely on standard volume charts leaves traders blind to who's winning the battle between the bulls 🐻 and the bears🐂 . Moreover, a high volume on its own doesn't necessarily signify a dominant presence of either bulls or bears. Sometimes, amidst the roar of high volumes, the battle is evenly matched, leaving traders unable to discern the potential direction of the market.
Volume Delta indicator shows the net difference between buying and selling volume during the selected timeframe. When the volume delta is positive, it indicates that buying volume is higher than selling volume, suggesting bullish sentiment. Conversely, when the volume delta is negative, it suggests bearish sentiment as selling volume exceeds buying volume.💡
What do spikes in Volume Delta really mean?
If the closing price is far from the upper tail of a green delta volume candle, it suggests that despite the initial surge in buying activity (represented by the tall tail), the price didn't sustain its upward momentum and closed lower. Many examples can be given :
- Buyers bought their coins and sent them to cold wallets
- Presence of liquidation price level or profit taking orders being triggred so Delta volume reached it's maximum.
Traders can use the volume delta indicator to confirm trends, identify potential reversals, and make informed trading decisions based on changes in market dynamics.
Happy learning !

short it : NZDUSD Hello, traders. The support and resistance level of 0.620 may soon be reached by the New Zealand dollar, which is currently going through a correction phase. The trend is downward at the moment. Throughout this trading week and the one after it, we'll keep an eye on NZDUSD in case a selling opportunity appears at the 0.620 zone. We've launched a short position to meet with money and risk management standards, and we'll add more in the zone.
Daily chart
Weekly Chart

USDJPY AnalysisHello, traders. The support and resistance area of 139 may soon be approached by the USDJPY, which is now in a correction phase. The trend is currently upward. Throughout this and the following trading week, we'll be keeping an eye on USDJPY in case a buying chance presents itself close to the 139 zone.

AUDUSD Selling opportunity Good day, traders. The Australian dollar, which is now in a correction phase, may shortly hit the support and resistance level of 0.680. Right now, the trend is downward. We'll be monitoring AUDUSD during the current trading week and the one after it in case a selling opportunity arises at the 0.680 area.

EURUSD full weekly AnalysisSMA 20 of Daily chart alamost matches with SMA 480 of hourly chart.
SMA20 of daily chart was a great trend detector for the pair recently so I'll use 480 in hourlt chart.
According the SMA20 we are still bullish.
By deeper look at Daily chart a bullish channel could be seen that proves bullish trend. Also a great SNR zone is obviously clear in daily chart.
I think last week was just a correction.
By looking at 1H zone, we could see conflux of mighty SMA480, Camarilla pivot level of S3, Daily S&R zone and also a strong Delta Volume important zone.
There is a high probability of rejection from the zone.
About the delta volume: There were strong buyers in last bullish move, but in some points there were slightly stronger sellers, market tends to reverse from those critical points.
Looking at IG sentiment factor we'll get that sentiment indicators worked reversely in recent weeks. So strong sellers can not hesitate me.
Market may avoid sharp moves before FOMC meeting at Wednesday.
TP1 : 1.116
TP2 : 1.121
TP3 : 1.130

My Positional view on #DELTACORP After i good upside rally now NSE:DELTACORP is ready to take some rest or retracement.
As per my analysis. Best level to buy DELTACORP LTD is :
Entry level (Buy level) 204
Target 1: 229 (15 Points Gain)
Target 2: 250 (46 Points Gain)
Target 2: 271 (67 Points Gain)
Stop loss will be : 189 (Risk 15 Points only)
Note: This is per personal analysis, only for learning
