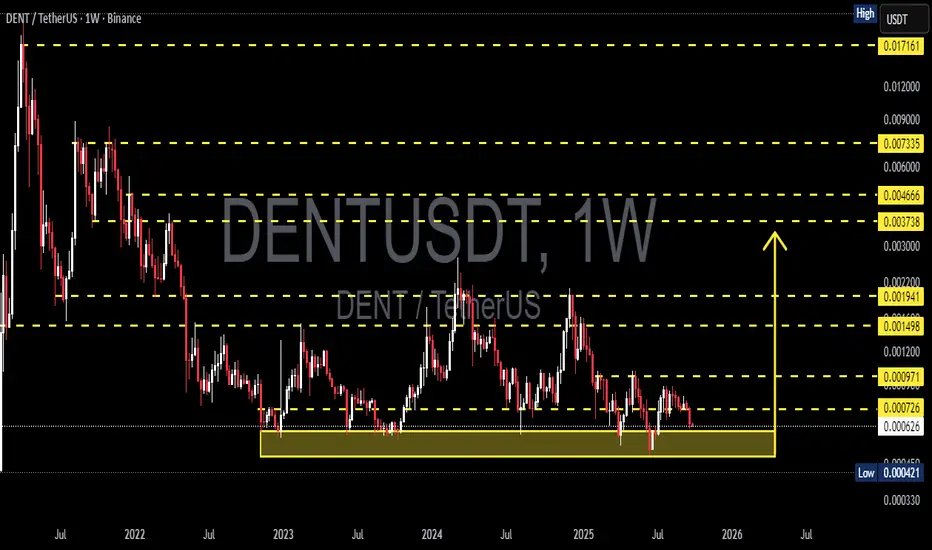
DENT/USDT – Major Accumulation Phase at Critical Support!Main Structure
On the weekly timeframe, DENT/USDT shows a prolonged bearish trend since 2021, followed by a long sideways accumulation phase from 2022 until today. Price is now sitting again at the critical historical support zone (0.00042 – 0.00063), a key “basement” level where buyers have repeatedly stepped in.
Key resistance levels:
0.00097 → first pivot resistance
0.00150 → psychological resistance, early trend confirmation
0.00194 → major validation of bullish reversal
0.00374 – 0.00466 → strong historical resistance, mid-term target
0.00734 – 0.01716 → long-term reversal targets
---
📈 Bullish Scenario
1. Rebound from Basement Support
Holding above 0.00042 – 0.00063 would confirm an accumulation / double bottom structure.
A weekly close above 0.00097 with strong volume would be the first bullish confirmation.
2. Upside Targets
Target 1: 0.00150 (+100% from current price)
Target 2: 0.00194
If momentum sustains, the move could extend to 0.0037 – 0.0046
3. Additional Confirmation
Look for volume spikes on breakout.
Watch RSI for potential bullish divergence on new lows.
---
📉 Bearish Scenario
1. Breakdown of Key Support
A weekly close below 0.00042 would invalidate the 2-year accumulation base.
This could trigger new lower lows and potentially a capitulation phase.
2. Bearish Consequences
Longs near the basement may face large stop-loss triggers.
Market could enter a deeper consolidation or distribution zone.
---
🔍 Price Structure & Pattern
Range-bound Accumulation: DENT has moved sideways for almost 3 years, forming a potential base.
Lower Highs: Macro structure remains bearish until a weekly higher high above 0.00194 is confirmed.
Critical Zone: The 0.00042 – 0.00063 range is the “life support” for bulls. A breakdown would flip sentiment to strongly bearish.
---
🎯 Conclusion
DENT is at a make-or-break level:
Bullish case: Holding the basement support could trigger a strong rebound, especially above 0.00097, with targets toward 0.00150 and 0.00194.
Bearish case: A breakdown below 0.00042 ends the multi-year accumulation and risks deeper lows.
For traders, risk management is essential:
Aggressive entries can be taken near support with tight stops.
Conservative traders may wait for confirmation above 0.00097 or 0.00150.
---
#DENTUSDT #DENT #CryptoAnalysis #Altcoins #Accumulation #SupportResistance #BullishScenario #BearishScenario #CryptoTrading
Dentcoin
DENTUSDT 1W AnalysisDENT ~ 1W Analysis
#DENT This trade is very high risk. Buy if you still have confidence in this coin with a short term target of at least 20%+ from this support.

DENTUSDT 1D AnalysisDENT ~ 1D Analysis
#DENT Buy when re -testing this support block with a short -term target of at least 10%+ from here.

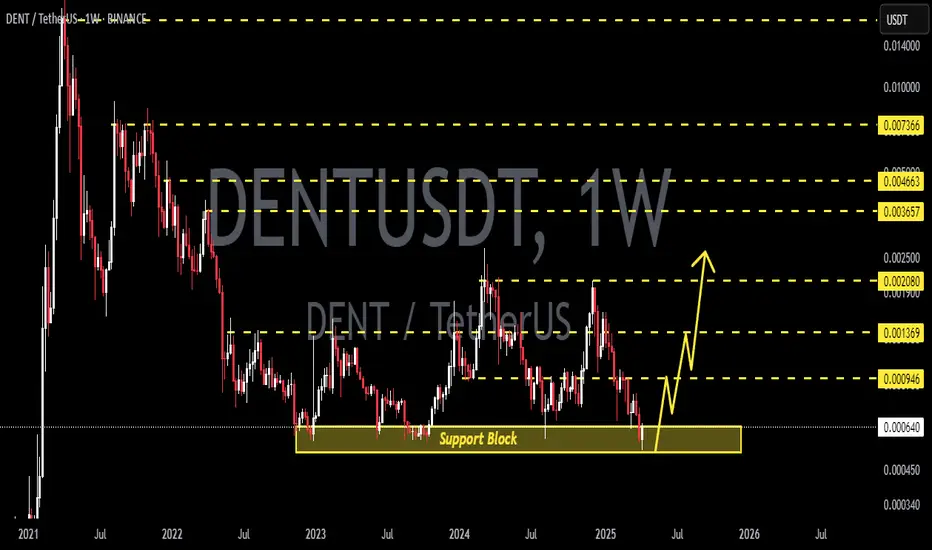
DENTUSDT 1WDENT ~ 1W Analysis
#DENT Support blocks that you might be able to consider to start buying back from here with a short -term target of at least 20%+.
DENTUSDT 6DDENT ~ 6D
#DENT So far it still maintains its bullish structure. Buy from here with a minimum target of 20%++

DENT Price AnalysisThe price of the DENT is in a downtrend, characterized by a series of lower highs and lower lows within a well-defined descending channel. This pattern has been in play since March 2024, indicating sustained bearish pressure on the asset. The price has repeatedly attempted to break out of this channel but has consistently been met with selling pressure, driving it back down.
Key resistance zones (Green) have formed at $0.001489 - $0.001578. The Green zone has historically acted as a strong resistance, as seen from multiple failed attempts to breach this zone. A breakout above $0.000933 level could signal a potential trend reversal, but the prevailing downtrend suggests that this level will likely continue to cap any upside attempts.
On the support side, the price has recently found footing at $0.000730 level and the price recently bounced from the middle of the descending channel. This level is crucial for the bulls, as a breakdown below it could lead to further declines, with the next significant support zone (Blue) at $0.000557 - $0.000582 . This latter level is particularly noteworthy, as it represents a previous low from October 2023, marking a possible target if the bearish momentum persists.
Currently, the price is hovering around $0.000785, near the support level at $0.000730, following a minor rebound from the middle on the descending channel. This recent price action appears to be more of a corrective bounce within the overall downtrend, rather than a signal of a trend reversal. Unless the price manages to break above the $0.000933 resistance and the descending channel, the bearish outlook remains dominant.

DENT Technical Analysis and Trade Idea #DENT USDT has exhibited bearish tendencies on the higher time frame. Currently, we are witnessing a significant move into a key support level. In the accompanying video, we explore a potential trading opportunity, contingent upon the development of favorable price action. We identify key support and resistance levels, we look at chart patterns, price action analysis, and a particular form of price behavior that, if advantageous, would warrant market entry. As a disclaimer, the information provided is solely for educational purposes and should not be construed as financial advice. Trading carries inherent risks, and it is imperative to implement sound risk management practices at all times.

DENTUSDT 150% PotencialDENTUSDT Technical analysis update
DENTUSDT price exceeded its resistance zone on the day chart after a 650-day consolidation period. While this could indicate a potential breakout. if the price breaks we can expect a 150% up move.
Buy zone: Below $0.00155
Stop Loss:$0.00120
Regards
Hexa

DENTUSD 1W#DENT ~ 1W
Buy here, Minimum Target 15%++, This will be a Rocket after Breaking this Resistance Line.

#dent will pump like old days?- Very well and long accumulated chart
- Price tightened and falling wedge formed
- Lies on vertical historical support
If fails, price will surely test the lower box.
NOT FINANCIAL ADVICE.

Dent Building up For Massive Breakout Building Up for Massive breakout Formed Falling Wedge & trying To break It While Testing Crucial Horizontal Resistance Once Both Got cleared Recovery Will Be Massive Expecting 250 to 280% bullish Wave In Midterm Incase Of breakout

DENT DENT looks bullish for me with saving the support line ( red line )
break the the red line will go directly to the box below for the accumulation
peace :)

Dent Coin Looking Good For Midterm Forming Falling Wedge In Higher Timeframes
Incase Of breakout Expecting 500 to 600% bulish Move
Keep Eyes On For breakout Dont Enter Without breakout

DENT : INCREASE VIEWDent seems to have some volume trend, we will follow the coin to see if it can gain volume coming time


DENT token formed big bullish BAT for upto 13% pumpHi dear friends, hope you are well, and welcome to the new update on Dent token with Bitcoin pair.
Previously we had a pump of DENT:
DENT token has formed bullish Butterfly for 12% move
Now on a 4-HR time frame chart, DENT has formed a bullish BAT pattern.
Note: Above idea is for educational purpose only. It is advised to diversify and strictly follow the stop loss, and don't get stuck with trade

DENT token has formed bullish Butterfly for 12% moveHi dear friends, hope you are well, and welcome to the new update on Dent token with Bitcoin pair.
On a 4-r time frame DENT has formed a bullish Butterfly pattern:
Note: Above idea is for educational purpose only. It is advised to diversify and strictly follow the stop loss, and don't get stuck with trade


DENT/USDTdent is in a very good position compared to Ethereum and Bitcoin and also to Tether. If the current support is maintained, we will have the following goals.
tp1:0.004$
tp2:0.006$
tp3:0.008$
tp4:0.012$
tp5:0.015$

#DENTUSDT Could Explode and Rally 500%+ Here's Why!!Welcome to this SPOT TRADE SETUP.
Reasons to Follow me?
*9 Years in Trading!
*7 years in Crypto
*Certified Technical Analyst
*Record Holder of Most liked Bitcoin Chart on Tradingview.
*Consistent updates on Markets and Trade Setups
*No Bias
*All-time Top Author on various assets and index charts globally.
*Very Active Community during both bull and Bear Market
Let's get to the chart.
Last time Dent broke out and pumped like crazy.
Almost 5000%+ for almost 60 days.
Since this pump Dent has been forming this triangle.
Once it breaks out. There's a possibility for an easy 5x to 10x from this coin.
IMHO, Enter on the breakout or you can simply buy now and add on the dips later to DCA.
Am not gonna tell you any entry or Target.
The chart says it all.
Please observe.
Invalidation:- Close below the triangle support trendline.
If you want me to post more trades do hit the like button and share your views in the comment section.
Thank you
#PEACE

Good opportunity Dent On Binance -100% Target-Dent Usdt on Binance Daily Chart
I think this is a good opportunity for holders ( Mid-Term )
Entry Now 0.00235
Safe Entry after a Daily Close above 0.00275
StopLoss Daily Close Below 0.0021$
TP1 0.0048
TP2 0.0084
DYOR.

