USDJPY - Bigger picture - Minus all the noises..
i.imgur.com
i.imgur.com
USDJPY Monthly -
This offcourse is a bigger sketch view and doesn't carry noises..
Though under 103 if happening it be a brutal drop sequence.
Derivatives

USDCAD.. USDCAD..
i.imgur.com
USDCAD 2 hr - 302X supp; more like break point.. IF cranks up; shows a test of 2950-6X.. Later spot ideal for longs...

GBPUSD ..GBPUSD...
Overall the pair can use a dip down to 394X and a bounce off there could make its way to testing 425X or so. As of now there are chances of a drop to post double bottom formation to 399X low and a bounce or drop fuller as per 8 hr to do 394X and then a lift off.
The pair has taken more of a back seat and looking up on chart does give an impression this has more erratic swings on it then a st line most would prefer.
i.imgur.com
GBPUSD 2 hr - Incase double bottoms
i.imgur.com
GBPUSD 8 hr - Preferred playout - down to 394X and then a bounce for having a temp low then to be in

GBPJPY UPDATE....
The pair end up bouncing off the weekly minor supp off 151.6X and done a decent retrace so far.
However; I think we just may dip once more and get to post a double bottom formation.
Spotting a possible Bear Flag formation on 15 & 30 mins time frame and we just may top out rt around to 154 handle for the slide to take it back to testing lows..
Initial resis kick starts off 153.6X but hoping to see it makes it to around 154 handle.. 152.30-4X likely to find bids on the drop now ..
i.imgur.com
GBPJPY 15 mins - Possible Bear Flag


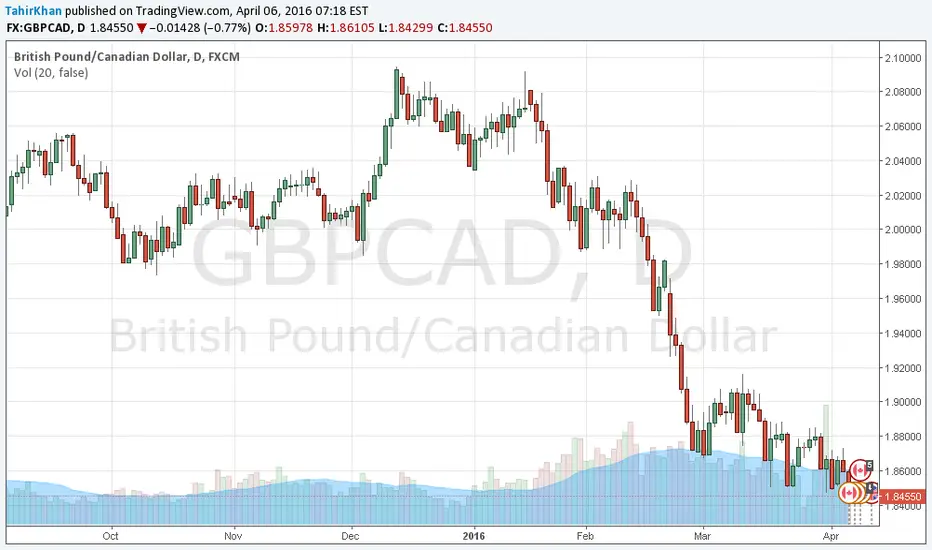
GBPCAD - UPDATE
GBPCAD UPDATE.. Clockwork orange..
Sub 8400 supp was met and got the bounce; now likley to do fuller up towards or around 853X making it time to go short once again..
i.imgur.com
GCAD 15 mins
i.imgur.com
GCAD 4 hr - 853X or around and likely time to be short on it..

GBPJPY.. Tentative View.. 151.50-7X may provide temp bottom ..IT seems everyone is hitting longs on the GBPJPY; where as it shows some significant drop. It is difficult to chart on smaller time frame; hence weekly is what I'm going with.. 155.2X been a break point could come into retest.. I suspect 151.50-7X could form a temp bottom to get some lift off towards 155.XX. A failure to say 155.5X and we can see new bigger leg down towards 148.XX.
i.imgur.com
i.imgur.com
GBPJPY Weekly -
Alternatively incase this is in no mercy mode; GBPJPY can simply drag all the way down to 148.XX before rebounding. That also would make sense; since as long as traders would think it can't drop any further it would just do the opposite and take most of the traders trading into bias to the butchery, before reversing

GBPCAD - 839X decent looking supp - 830X main suppGBPCAD..
Approaching initial decent supp to 839X but does show fuller channel moves can end up heading for a 830X spot if gets a clean break under 8380-9X..
i.imgur.com
GBPCAD 2 hr
i.imgur.com
GBPCAD 8 h - Main channel
i.imgur.com
GBPCAD 8 hr
i.imgur.com
This we were looking on to yesterday and shorted nicely.. Though wish we had it intact now but squared out to 862X we had in mind back then..
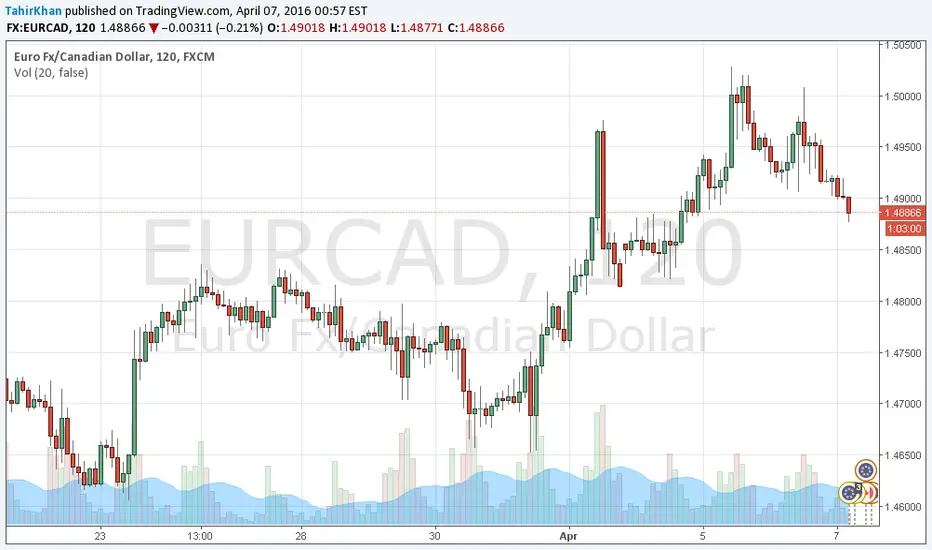
EURCAD .. Expecting more fallout...EURCAD..
Yesterday...
i.imgur.com
ECAD 30 mins.
i.imgur.com
ECAD 30 mins - Present
i.imgur.com
EURCAD Daily - Bigger Picture - We may have put in a temporary top and more decline favors.
i.imgur.com
EURCAD 4 hr - Play off within channels
i.imgur.com
EURCAD 2 hr - 484X been a soft tgt of the drop.
Cross Ladder Quantitative Analysis ExampleUsing the Harmonic Mean (Pythagorean Means), we focus on "three values" using the Cross Ladder Problem by drawing the geometric shape - vectored R/S points. These values are taken from the harmonic mean of "B" "A" "h". The calculation inputs are Log Normal, Exponential, and Skewness. (Arithmetic mean gives higher data points that will error your weight); Harmonic Mean gives equal weight to each data point. This is in part; a computation set in our Optimal Geo-Ratio (OG) Model. One would want to incorporate the Intrinsic/Time Value to carry out the time horizon price target. We typically apply the STDEV*SQRT(45 days/252) equation to the two outcomes. You may use a short cut divisor 1/16 per incremental price input for jump diffusion if preferred, integrated with a Beta stochastic volatility model. Square Time Value and Excess Kurtosis are not shown in this example.
Just remember volatility is the standard deviation of expected returns. Volatility is proportional not directional. Peace.
