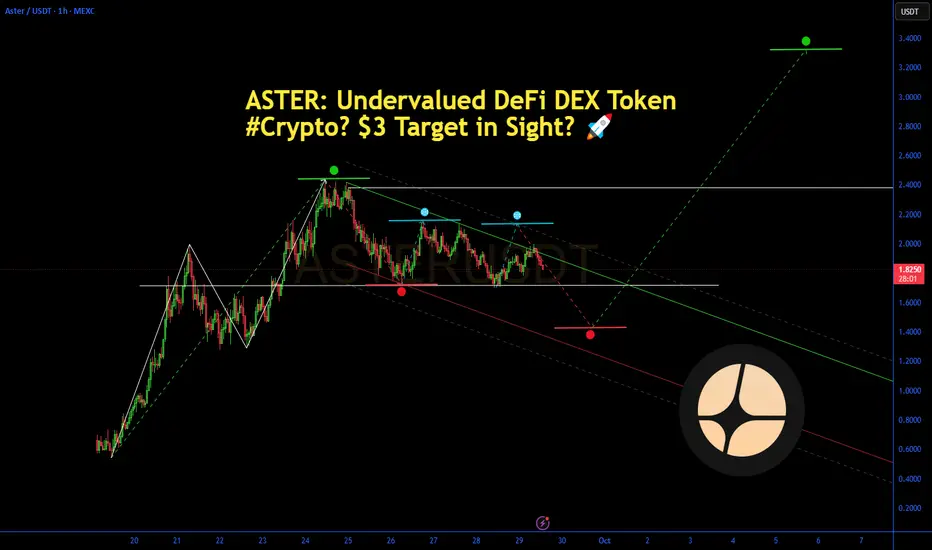
ASTER: Undervalued DeFi DEX Token $3 Target in Sight?ASTER: Undervalued DeFi DEX Token Amid #Crypto? $3 Target in Sight? 🚀
ASTER at $1.84 (+10.49%), undervalued with multi-chain DEX features and $400M+ TVL amid Mr. Beast whale moves and X buzz—analysts project $3 average target for 2025, 51% upside, pondering if MEV-free trading fuels rally. 📈
**Fundamental Analysis**
Market cap $3.3B with 24h volume $1.2B; undervalued vs. peers on capital efficiency (yield-generating collateral), high ROI from RWA integrations and community governance, fundamentals boosted by DWF backing and multi-chain expansions.
- **Positive:** MEV-free execution; cross-chain perpetuals and spot trading.
- **Negative:** High volatility as new entrant; limited analyst coverage.
**SWOT Analysis**
**Strengths:** Innovative Simple/Pro modes; privacy-focused L1 chain.
**Weaknesses:** Recent launch risks; scalability challenges.
**Opportunities:** DeFi boom; stock perpetuals adoption.
**Threats:** Regulatory hurdles; competitor dominance.
**Technical Analysis**
Chart in volatile uptrend post-launch. Price: $1.99, VWAP $1.95.
Key indicators:
- RSI: 61 (bullish momentum, not overbought).
- MACD: Positive (upward signal).
- Moving Averages: Above short-term averages (mixed long-term due to newness).
Support/Resistance: $1.71/$2.41. Patterns/Momentum: Rebound from lows targeting $2.50. 📈 Bullish | ⚠️ Bearish.
**Scenarios and Risk Management**
- **Bullish:** Whale activity pushes to $2.50; DCA on support tests for averaged entry.
- **Bearish:** Profit-taking drops to $1.50.
- **Neutral:** Consolidates at $2.00 on volume buildup.
Risk Tips: 1% risk per trade, stops at $1.80, diversify DeFi holdings, DCA to counter swings. ⚠️
**Conclusion/Outlook**
Bullish if TVL growth persists. Watch multi-chain updates. Fits #Crypto theme with DEX upside. Take? Comment!
DEX
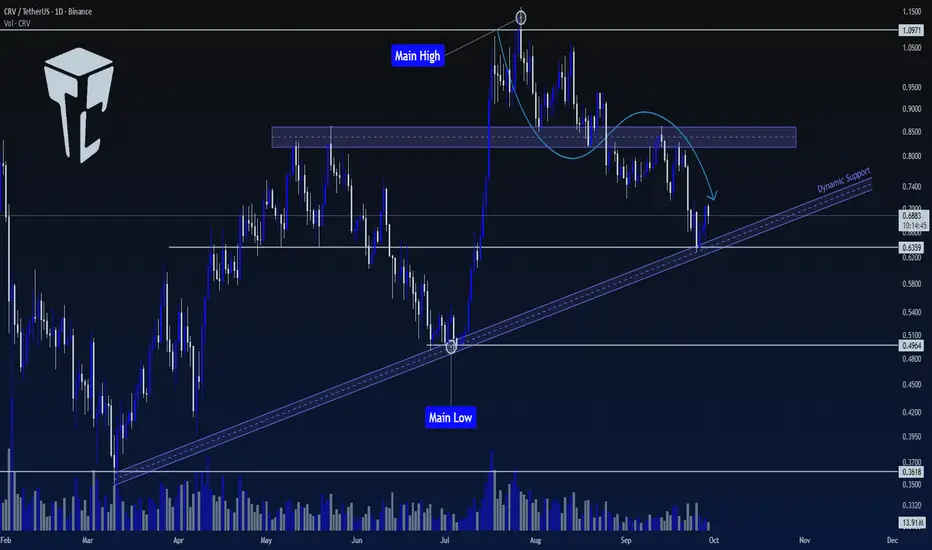
TradeCity Pro | CRV Testing Key Support Zone for Trend Reversal👋 Welcome to TradeCity Pro!
In this analysis, I will be reviewing the CRV coin, one of the popular DEXs, with a market cap of $954 million, currently ranked 81 on CoinMarketCap.
📅 Daily Timeframe
In the daily timeframe, this coin is in an uptrend with a trendline, and the price has currently reached it.
🔍 In higher cycles, the trend of this coin is bullish. However, in lower cycles, after being rejected from 1.0971, a downward movement has started, and it has corrected to the 0.6359 level.
✔️ This level is currently overlapping with the trendline and forms an important support zone.
✨ If this PRZ zone breaks, we can confirm the bearish reversal for CRV, and a short position can be opened. This trigger is one of the first signals for a trend change, and the main trend change will be confirmed after breaking 0.4964.
📈 For a long position, we will have to wait until a proper bullish structure is formed. If the price moves sharply, we will confirm the bullish trend after stabilization above the zone.
❌ Disclaimer ❌
Trading futures is highly risky and dangerous. If you're not an expert, these triggers may not be suitable for you. You should first learn risk and capital management. You can also use the educational content from this channel.
Finally, these triggers reflect my personal opinions on price action, and the market may move completely against this analysis. So, do your own research before opening any position.
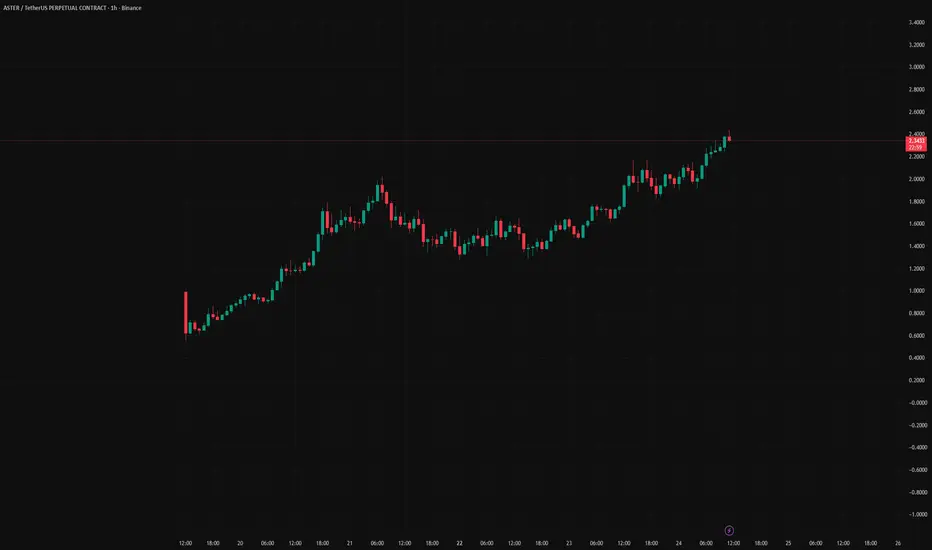
ASTER Momentum Could Push Toward $6
Aster (ASTER) has been one of the strongest performers in the market this week, rallying over 2,000% according to multiple sources. The project positions itself as a decentralized perp DEX with features like hidden orders, multi-chain support, and even on-chain stocks trading up to 100x leverage. Backing from YZi Labs, a firm associated with Binance’s founder CZ, has further fueled speculation and attracted whales.
Why I see $6 as a realistic short-term target:
Strong Momentum — Price action shows parabolic growth with high-volume confirmation. Momentum plays like this often overshoot before retracing.
Low Float & Supply Pressure — With a limited circulating supply, ASTER reacts quickly to buying pressure.
Speculative Catalysts — CEX listings (Bitunix already listed ASTER/USDT and perps) show growing traction, and traders are betting on a potential larger exchange listing.
Market Psychology — After such rapid gains, round numbers like $5 and $6 act as magnet levels, especially when retail FOMO is high.
My Trading Plan:
Entry: Pullbacks around $2.5–$3 zones (support from recent consolidation).
Target: $6 (psychological and Fibonacci extension level).
Stop-Loss: Below $2.0 (invalidate momentum structure).
Risk Factors:
Token unlocks could flood supply.
Extremely high volatility with potential 40–60% intraday swings.
Regulatory and adoption risks for perp DEXs.
BLUEFIN $BLUE a SUI DEXWhich riding on the back of a succesful SUI bullrun could and full blown alt coin bull market, it should make a new ATH..
Along the way the log tgt and resistance zone need to be met and overcome ofc.
#DoubleBottom

HOLDING MY THENA [THE / USDT] position! Holding my TSX:THE position 📈
Bulls will be back soon!
Remember; Key demand zone:
0.4700 - 0.440 - 0.4300$
Bullish retest daily & price discovery valid if we hold above!
Price could fly much higher HTF. 🚀

THE - NEXT BULLISH WAVE LOADING ? Very solid uptrend & strong hype on #THE🚀
Price is consolidating, nicely, antipating another leg up, likely toaward 0.800$ next 📈
Local key supports:
0.5600 - 0.5300 - 0.5200 - 0.4980


ASTER -23% pull back already! I warned you! 2.00$ possible top & psychological level on #ASTER🔴
-23% retracement already 📉
HYPE = speculation only!
I'm betting even more into #THE / USDT, money rotation incoming 📈
Remember, the sky has a limit! 🏙
#trading #crypto

SPOT BREAKOUT - HYPE ALERT --> THE/USDT🚨SPOT BREAKOUT HYPE ALERT🚨
Missed the $ASTER rocket?
Don’t worry, the real opportunity might just be starting with TSX:THE (@ThenaFi_), now trading on #Binance!
Why am I watching TSX:THE closely?
🔸DEX on BNB Chain, just like $ASTER
🔸Backed by kingmakers CZ & @YziLabs
🔸But while $ASTER is already at a ~$3B market cap, TSX:THE is sitting at just ~$64M… ⏳
Fundamentals?
🔹$ASTER revenue: +/-$37M
🔹 TSX:THE revenue: +/-$39M
That’s right TSX:THE is already OUTPERFORMING in revenue at a fraction of the valuation!
💡TA Spotlight:
TSX:THE is hovering at its historical support, the exact level where it last pumped 20x post-breakout. The chart is loaded for another big move.
📈I wouldn’t be shocked to see the $ASTER hype repeat here, with serious money rotating from $ASTER to $THE! 👀
→Small cap + real fundamentals + explosive TA = This could be a next billion-dollar narrative. 🚀
Not a financial advice, #NFA

ASTER - CAUTIOUS WITH HYPESorry for the bad call, but #CZ power is just unstoppable! 😅🔥
#HYPE & volatility on ASTER$ASTER are absolutely massive right now!
My last level barely saw a -5% dip, but today we almost hit $2.00 insane momentum! 🚀
⚠️ Caution: $2.00 is a major psychological level. Team wallets are holding huge portions of the supply, distribution risk is real.
Remember: Most of the current hype comes from Yzi Labs’ investment and CZ’s shilling.
But: Other perp DEXs have quietly been around longer, generating even better real revenues…
When the hype fades, we could see a sharp correction!Stay smart, don’t get caught holding the bag as momentum shifts.

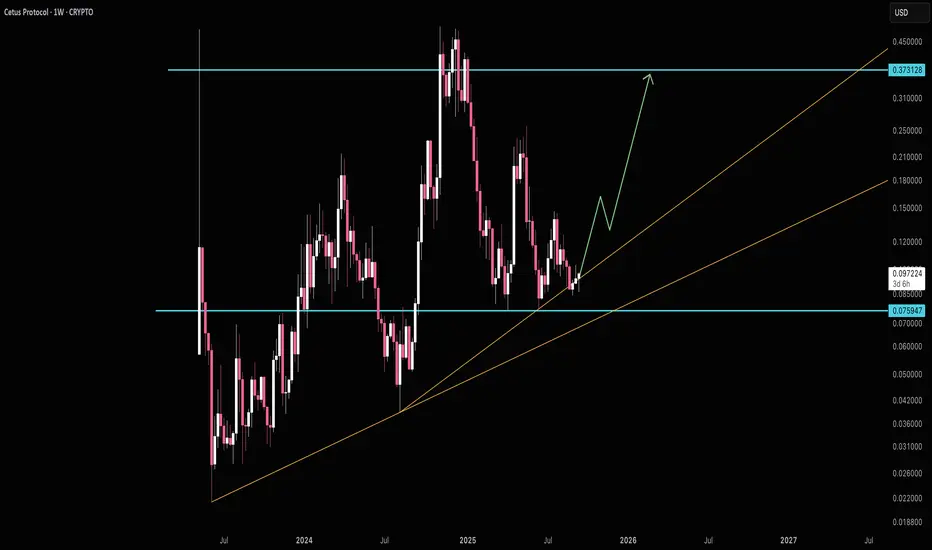
An interesting setup for Small Risk/Big RewardCetus is looking very interesting to me. I took a position here hoping for big upside. If you're not aware Cetus is a DEX on Sui network. The CETUS token can be staked and yeilds a return of the DEX fees. That upper 0.373 area has been resistance a few times now and I'm speculating it'll target that area once again.
Good luck!
SBR/USDI have been building a position in this asset since early 2025. Patience has been necessary but the promise remains. I have been watching this chart closely and we now have a fully formed head and shoulder pattern on the Stochastic RSI on the daily timeframe. The daily candle still needs too close to confirm a breakout above the neckline but things are looking promising. We are also trading below a trend line that acted as support in the past. I believe this move if confirmed would push us above that resistance. Further evaluation would be needed after that. Larger timeframes SBR is beyond ready to run (potentially an inverse head and shoulders forming on weekly stoch rsi). I'm just looking for that spark. Best wishes in your life and ambitions (only the righteous ones).

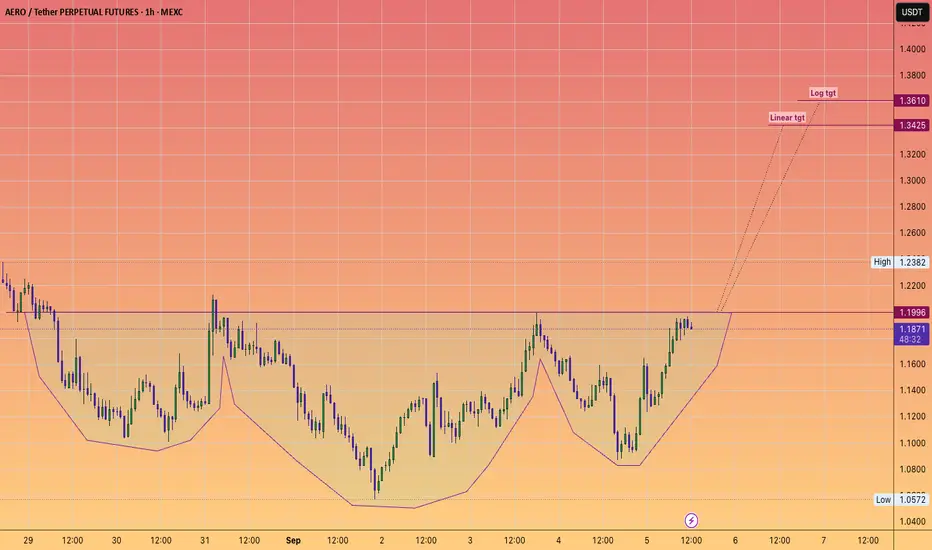
*Trade IDEA* Aerodrome to $1.35Inverse Head and shoulder is about to trigger.
"How Aerodrome Integrates with Coinbase Base DEX
Aerodrome's integration with Coinbase's Base DEX has been a game-changer for the platform. This partnership has created a powerful liquidity flywheel, with approximately 44% of Base's GDP flowing through Aerodrome. Post-integration, the platform experienced a 30% surge in trading volume and achieved a staggering $1.17 billion in 24-hour trading volume. By leveraging Coinbase's robust infrastructure, Aerodrome has simplified DeFi access for millions of users, making it a pivotal player in the Base ecosystem.
AERO Tokenomics: A Model for Sustainable Growth
Aerodrome's native token, AERO, is at the heart of its ecosystem. The platform employs dynamic emission throttling, reducing token inflation to just 1%. This ensures sustainable yields for liquidity providers while preserving the token's long-term value. Additionally, Aerodrome's ve(3,3)-style governance model incentivizes liquidity growth and rewards token holders with swap fees and staking benefits. This innovative approach has driven an 80% price surge for AERO, solidifying its appeal among investors and users alike."
HYPEUSDT.P 4H Chart Analysis | Volume Surges...HYPEUSDT.P 4H Chart Analysis | Volume Surges As Price Approaches ATH
🔍 Let’s break down the HYPE/USDT perpetual contract and scope out bullish momentum alongside key technical catalysts.
⏳ 4-Hour Overview
The 4-hour chart confirms an upward trend, reinforced by strong candle structure and sustained volume inflows. Price is approaching its all-time high (ATH) around $49.618, making this level crucial for the next directional move.
📊 Key Highlights:
- Volume: Noticeable volume convergence during the latest upward leg, demonstrating strong buyer interest as price accelerates toward ATH.
- 3SMA Trend: Moving averages (7, 25, 99) currently support the bullish structure, with price action maintaining strength above these key levels at $47.224, $45.752, and $41.744, respectively.
- Upward Trend: Higher lows and consistent higher highs define strong momentum, while the chart illustrates bullish continuation potential after consolidation.
- ATH Test: A breakout and hold above all-time high could open the door for further rallies, especially if volume continues to expand in sync with price.
🌐 DeFi Momentum
- Total Value Locked (TVL): DeFi markets are surging with $2.237B TVL across top protocols, underscoring broader sector confidence.
- Top 10: HYPEUSDT's movement mirrors strength seen among top DeFi assets, hinting at sector-wide bullish alignment.
🚨 Conclusion:
HYPEUSDT is building bullish energy as it tests the ATH with volume backing the move. Keep a close eye on price action near resistance—if buyers sustain momentum, next targets could materialize quickly. Support rests on 3SMA levels, with DeFi sector trends providing further tailwinds.

dYdX Bottom Consolidation Continues, Bullish NextHere you are looking at the formation of a bottom. The formation is a process not a single day event. It can take months for a bottom to fully form.
The way you know this to be true is because there is no downtrend. There are no new lows.
DYDX has been sideways now for 179 days, 6 months. Since early February 2025. In just three months, between December 2024 and March 2025, there is a very strong decline; lower highs and lower lows. A bearish move, a down-wave, a downtrend.
Ever since February the downtrend is no more. Rather than new major lows we have shy lower lows and finally not even that, no new lows. You can see the pattern how the market turned from bearish to sideways. This is the transition period. From sideways it will turn bullish, bullish goes next.
This is the point in time when most people will lose patiently and fold at a loss. Sell at the bottom, near support. This is the most important time to be patient, to accumulate, to even buy more and hold because we are looking at bottom prices. When prices are trading at the bottom and you are a bull, you can't go wrong.
Buy and hold. Continue holding because the market will soon turn.
Namaste.

TradeCityPro | JUP Eyes Breakout as Altseason Momentum Builds👋 Welcome to TradeCity Pro!
In this analysis, I want to review the JUP coin for you. It’s one of the projects in the Solana ecosystem, currently ranked 59 on CoinMarketCap with a market cap of $1.65 billion.
📅 Daily Timeframe
On the daily timeframe, this coin is currently sitting below a very important resistance zone at 0.6312. This is a strong resistance area and serves as the main trigger for a trend reversal in this coin.
✔️ The main support floor for JUP is located at 0.3409, a level price has tested twice before. Now it has returned to 0.6312, and we can see increased market volume at this level, which indicates tension between buyers and sellers.
✨ A breakout of 0.6312 would be a good trigger for a long position, and I plan to open a long if this level breaks. This could potentially be a long-term position with a high risk-to-reward ratio.
🔔 The next major resistance zones are at 0.7858 and 1.1435, which we can use as targets for this position.
🔽 If the price gets rejected from the top and moves down, breaking 0.4186 and 0.3409, we can look to open a short position.
🧩 The break of 0.3409 would confirm the start of a downtrend, and it's one of the key zones where I’ll definitely look to hold a short position if it breaks.
📝 Final Thoughts
This analysis reflects our opinions and is not financial advice.
Share your thoughts in the comments, and don’t forget to share this analysis with your friends! ❤️

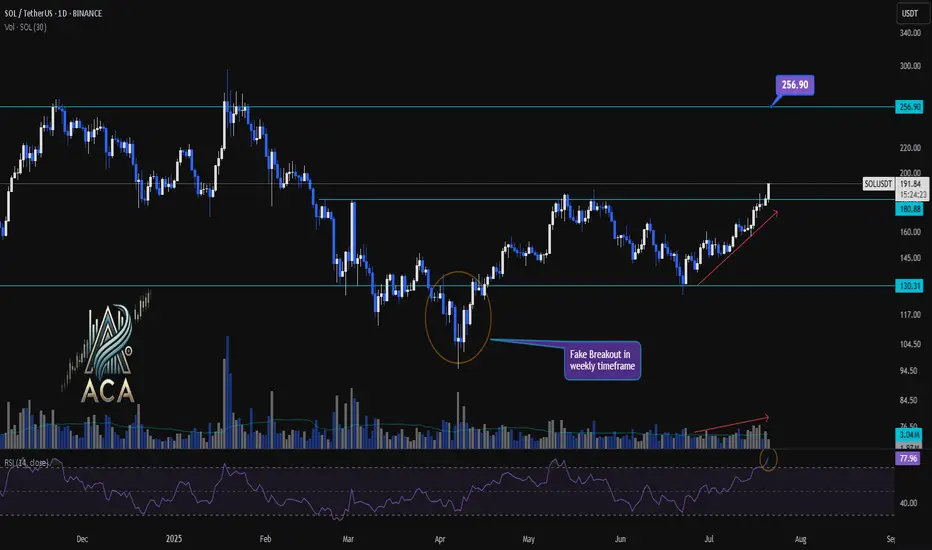
SOLUSDT 1D Chart Analysis | Accumulation Breakout Signals....SOLUSDT 1D Chart Analysis | Accumulation Breakout Signals Fresh Momentum
🔍 Let’s drill into the SOL/USDT daily chart, focusing on the recent breakout above the accumulation range, key support and resistance levels, RSI momentum, and volume confirmation for a robust bullish scenario.
⏳ Daily Overview
SOLUSDT has decisively broken out above a prolonged accumulation box, marking a significant shift in market structure. A daily close beyond this range now serves as a strong indicator for renewed bullish momentum. RSI is currently above 77, signaling that buyers are commanding momentum. Notably, volume has surged in tandem with price, confirming trader participation behind this breakout move.
📈 Technical Convergence and Trend Structure
- Accumulation Zone Break: After consolidating within a clear box for weeks, SOLUSDT closed above the upper boundary (around $180.88–$191.05), signaling a possible trend reversal or continuation.
- Daily Close Signal: A daily close outside the accumulation box offers high conviction for bullish continuation. This close acts as a potential entry signal for trend-followers.
- RSI Momentum: The RSI sits above 77—deep in the overbought territory. A close here not only confirms buyer strength but often precedes sustained uptrends when accompanied by price breakouts.
- Volume Surge: Volume has increased with the breakout, providing confirmation the move isn’t a false start, but likely fueled by real demand.
- Weekly Fake Breakout: There was a notable false breakout in the weekly timeframe, quickly reclaimed by bulls. This flip suggests buyers fended off downside attempts and now drive higher prices.
🔺 Bullish Setup & Targets
- First Target: $256.90 — marking the next major resistance on the chart and a logical upside objective for traders.
- Key Trigger: A confirmed daily (or weekly) close above the accumulation range with strong volume is essential for validating the upward trajectory.
📊 Key Highlights
- The breakdown of the accumulation box—now turned support—marks a pivotal structural change.
- RSI and price are making new local highs, solidifying the case for continued bullish momentum.
- Volume is climbing in sync with the move, offering real confirmation versus a potential fakeout.
- Recent fake breakout on the weekly chart, immediately negated, emphasizes that buyers are regaining—and likely maintaining—control.
🚨 Conclusion
SOLUSDT appears set for higher prices following the confirmed breakout above the accumulation range. Signs of trend health include an overbought RSI, volume confirmation, and the swift invalidation of a recent weekly fake breakout. As long as daily closes stay above the breakout level, the path remains clear for a rally toward $256.90. A strong daily close and continued volume will be your best signals for bullish continuation.
dYdX Hyper Bullish Market Conditions, $11.1 Next Target (1,671%)"Once we hit bottom, there is no other place left to go but up." dYdX hit bottom, a new all-time low last month and is turning ultra-hyper bullish this week. The action is already moving above EMA8 and EMA13 while breaking a local downtrend coming off the December 2024 peak price.
We have a full green candle and this candle signals a recovery and the start of the 2025 bull market cycle. This cycle can last 6-12 months for this specific pair or longer. Remember that each project, each trading pair, each altcoin can produce different price patterns and dynamics. This is easy to see because here we have a new all-time low, other pairs hit their all-time low in April this same year while others did so in August 2024, others in 2023, some others in 2022, etc. Each pair/project should be considered individually.
Good strong projects trading at bottom prices have higher potential for growth. For example, you can certainly make more money buying and holding dYdX tokens vs Solana or Ethereum. Because the latter two are trading much higher compared to their all-time high and because these projects are much bigger. Smaller projects have higher potential for growth.
So all is good in Crypto-world the market is going up. dYdX is turning bullish just now but the bias is confirmed based on marketwide action. Seeing how the other projects are performing predicts what comes next. When the week closes above EMA8 and EMA13, you have a full blown bullish confirmation. The action already recovered from the ATL range and is happening above the 10-March and 7-April lows. This is enough to secure/confirm growth.
We buy low to sell high. We buy when the market is red and hold.
We sell when prices are high. We sell when the market is green and there is lots of hype all around. Lots of profits to be made. At this point in time, all that is needed is to choose wisely and practice patience, patience will be the biggest earner; patience pays.
Thank you for reading.
Namaste.

CAKE : Are we left behind?Hello friends🙌
😉We came with a good currency analysis from the decentralized exchange Pancake Swap.
So you see that we have a good price support that buyers supported the price well after each collision.
🔊Now, considering the collision with this support, we can expect growth to the specified areas. Of course, don't forget that capital management and risk are the priority of trading.
🔥Follow us for more signals🔥
*Trade safely with us*

TradeCityPro | UNI Builds Pressure Below Key Resistance Zone👋 Welcome to TradeCity Pro!
In this analysis, I’ll be reviewing the UNI coin — one of the notable DeFi tokens, currently ranked 27th on CoinMarketCap with a market cap of $254 million.
⌛️ 4-Hour Timeframe
On the 4-hour chart, as you can see, UNI has formed a bottom around the 6.043 level, which is considered its key support zone. After reaching this level, the price began an upward move, though the trend appears very weak.
✔️ Currently, there’s a resistance zone just above the price that has previously caused multiple rejections. Once again, the price is moving toward this zone.
📊 The volume during this latest upward leg is very low, which is not a good sign for initiating a bullish trend. If the price reaches this resistance level with such low volume, there's a high likelihood of another rejection.
🔽 If that happens, we could consider opening a short position based on this rejection. However, my main trigger level for a short is the break below 6.896 — I personally would wait for this level to be breached before entering a short position.
✨ The next key support, in case 6.896 is broken, is the 6.043 zone. This is a major support level and could serve as the target for the short trade. If this level is broken as well, it could mark the beginning of a strong downward trend.
🔍 On the other hand, if volume starts to pick up and the resistance zone is broken, we could open a long position. The target for this could be around 8.678 — or even a setup in anticipation of a breakout above 8.678.
🔔 Which scenario you choose depends largely on your market perspective. If you're looking for a short-term trade, the first scenario is more appropriate. But if you're aiming for a long-term position with a wider stop loss, the second scenario would be the better choice.
💥 In either of the long scenarios, I strongly recommend confirming the move with volume. For further confirmation, you can also check if RSI enters the overbought zone.
📝 Final Thoughts
This analysis reflects our opinions and is not financial advice.
Share your thoughts in the comments, and don’t forget to share this analysis with your friends! ❤️

Ishi Go (DEX) — strong support zone & bullish setup!This low-cap DEX gem just tapped a key support level on the Ethereum network . The chart is forming a clean structure with strong historical demand — and we’re already seeing signs of a potential bounce.
After a deep correction, price has entered the green support zone
A potential move of +51.47% is on the table if the bounce continues

DEX - SOLX/WETH On the chart — Solaxy, a token that’s beautifully forming a support zone after a sharp dump. A potential recovery is already taking shape: a trendline breakout and a retest of the green support zone suggest a strong bounce could follow.
Projected move: +47.99% toward the nearest resistance level.

PULSEX TO DO A 17XPulseX DEX received one of the biggest public funding rounds in crypto history at 1 billion dollars.
It also is one of the few crypto tokens to receive regulatory clarity as been determined not to be a security.
It also trades at a 40% discount to that raise!
It also exhibits a wonderful technical pattern that is YET to trigger and breakout.
Which other crypto setup right now is giving you this kind of risk/reward?
