DEXE Update📊 DEXE Update
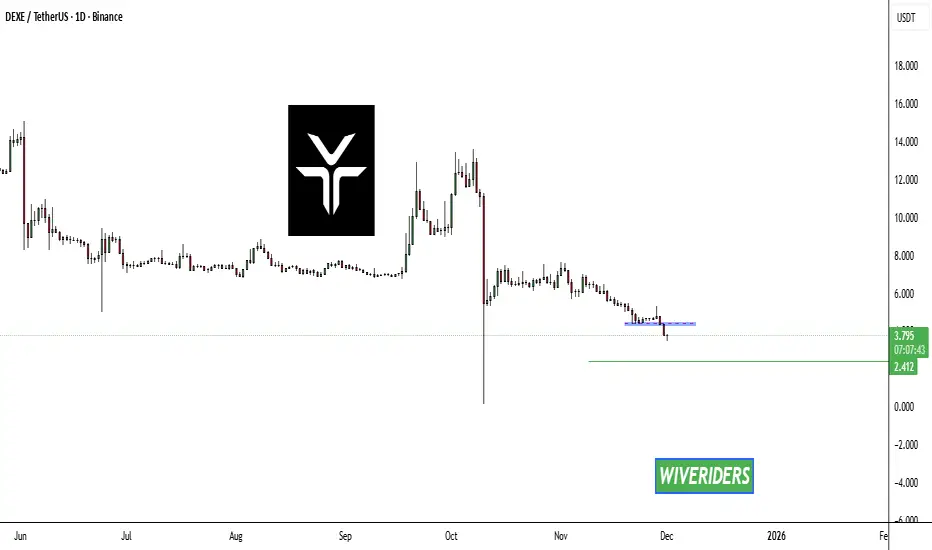
DEXE has broken down below the blue support zone 🔵❗
With this support now lost,
price could at least drop toward the green line level 🟢 —
the next major support area on the chart.
Dexe
DEXE Update📊 CRYPTOCAP:DEXE Update
CRYPTOCAP:DEXE is testing the red resistance zone 🔴
If it breaks out, the first target will be the green line level 🟢

#DEXE/USDT#DEXE
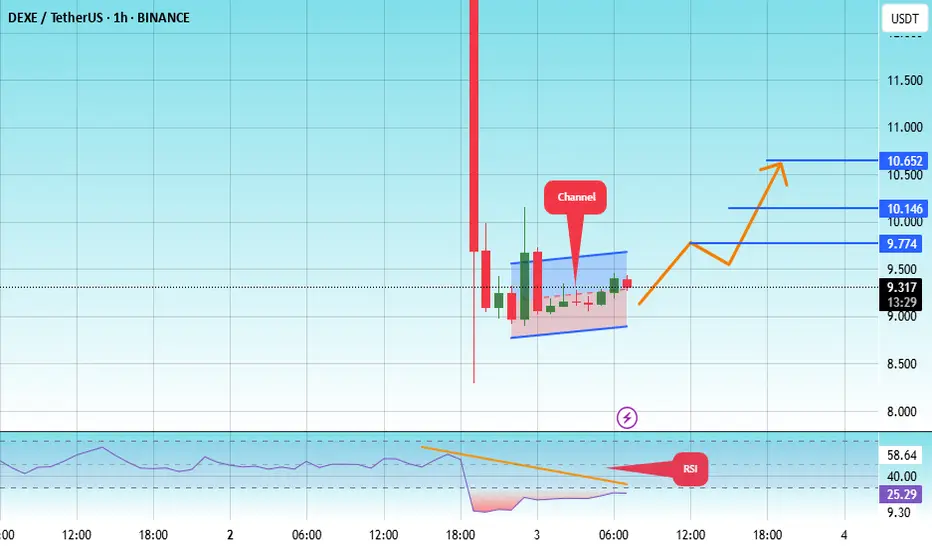
The price is moving within a channel on the 1-hour frame, adhering well to it, and is heading for a strong breakout and retest.
We have a bounce from the lower boundary of the channel, this support at 8.93.
We have a downtrend on the RSI indicator that is about to be broken and retested, which supports the upward trend.
We have a trend of consolidation above the 100 moving average.
Entry price: 9.30
First target: 9.60
Second target: 10.14
Third target: 10.65
#DEXE#DEXE
We have a bearish channel pattern on the 12-hour frame, within which the price moves and adheres to its limits well
We have a green support area at 11.30 after the price touched it and bounced from it
We have a tendency to stabilize above moving average 100
We have a downtrend on the RSI indicator that supports the price higher with a breakout
Entry price is 12.30
First goal 14.28
The second goal is 15.42
the third goal is 16.90

DEXE Market UpdateDEXE Market Update
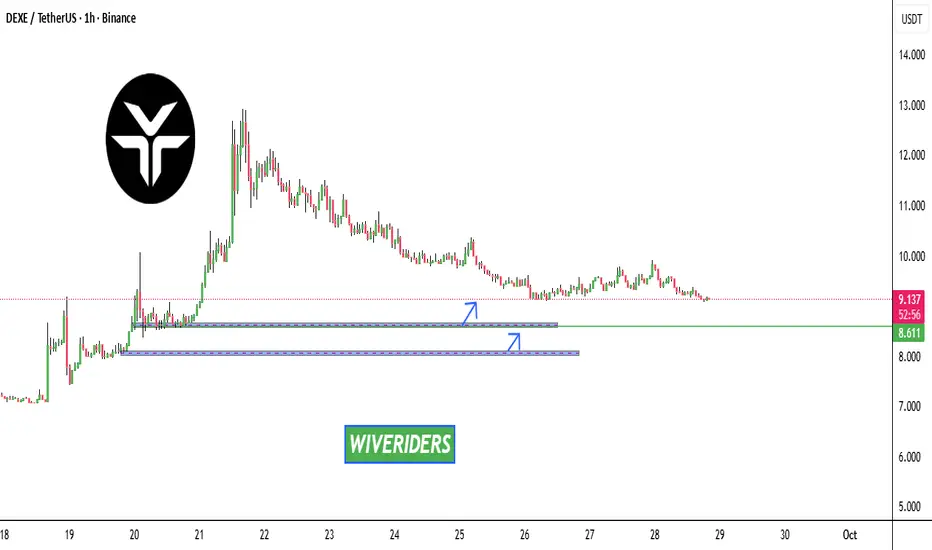
DEXE is in a downtrend 📉
If the price keeps retracing, we have two green zone levels 🟢 where buyers previously accumulated. From these levels, the price could bounce up again with confirmation ✅
⚡ Always trade smart, not blind — wait for confirmation before entering.
$DEXE Market Update📊 CRYPTOCAP:DEXE Market Update
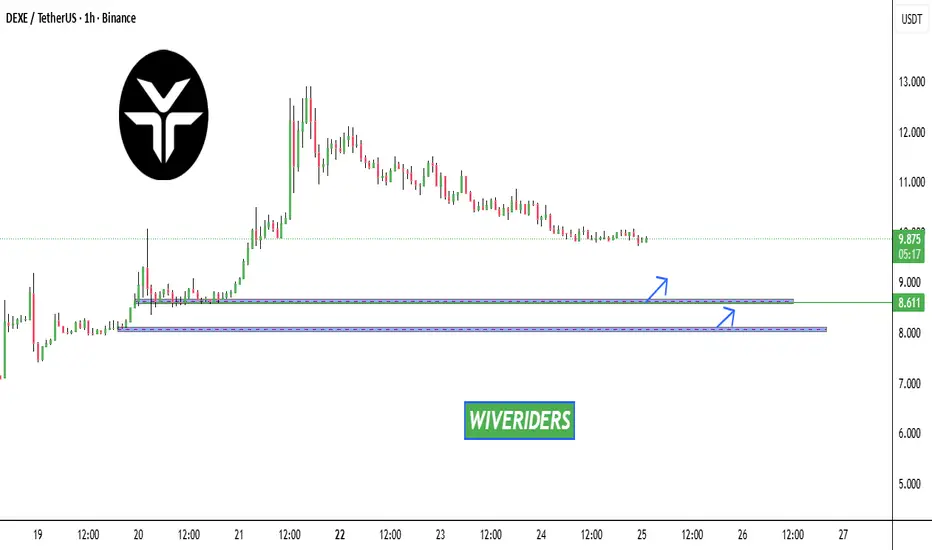
If CRYPTOCAP:DEXE keeps retracing 🔄, we have 2 possible long entry zones:
🔹 First blue line level 🔵 — potential bounce area.
🔹 Second blue line level 🔵 — deeper retracement zone where buyers could step in again.
From these levels, price could bounce up with confirmation ✅
DEXE/USDT — Demand Zone Retest: Bullish Reversal or Breakdown?🔎 Overview
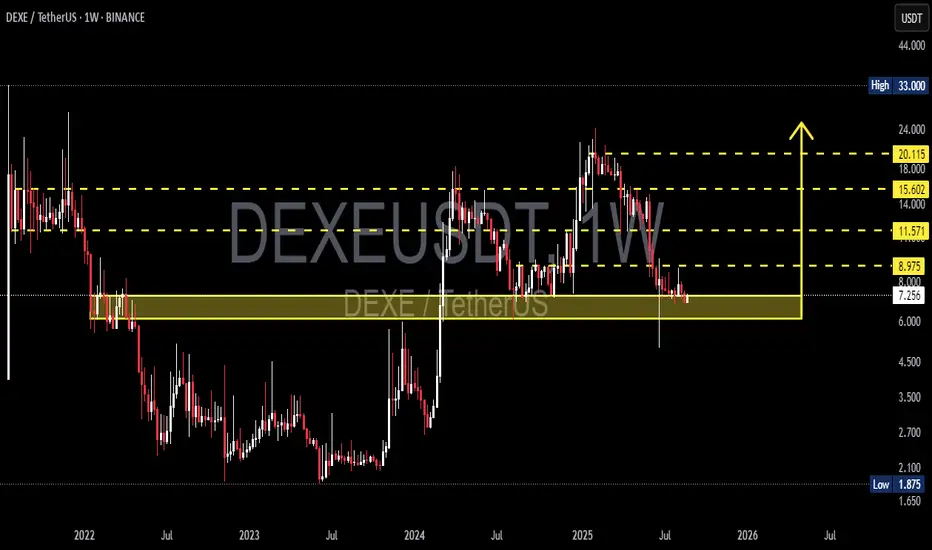
DEXE/USDT is currently retesting the weekly demand zone ($6–8) which has historically acted as a strong accumulation area during 2022–2023. After a massive rally in 2024 followed by a strong correction in early 2025, price has formed a series of lower highs, showing clear selling pressure from smart money.
Now, the market is at a critical juncture: will this demand zone hold and spark a new bullish phase, or will it break down and send price back toward historical lows?
---
📌 Market Structure & Pattern
Macro trend: still bearish since the 2021 peak, despite a relief rally in 2024.
Current structure: a sequence of lower highs, signaling sellers remain in control.
Demand zone $6–8: a major support zone that has served as an institutional accumulation area before.
False break wick below the zone, quickly reclaimed → typical sign of liquidity grab/shakeout before potential reversal.
---
🚀 Bullish Scenario
1. Confirmation: Weekly close above $8.975 → strong sign that buyers are regaining control.
2. Upside targets (layered resistances):
$11.571 → first target (minor supply test).
$15.602 → mid-term target, partial profit zone.
$20.115 → major bullish target if momentum extends.
3. Entry strategies:
Conservative: Wait for a confirmed close > $8.975.
Aggressive: Accumulate gradually within $6–8 with a stop below the zone.
4. Market psychology: This area often represents smart money re-entry after stop-hunting retail traders.
---
🔻 Bearish Scenario
1. Confirmation: Weekly close below $6.0 → demand zone failure.
2. Downside potential: Breakdown would open room toward lower support areas ($4.5 → $3.0 → even $1.8).
3. Strategy:
Exit longs if weekly closes below $6.0.
Shorts only for experienced traders due to limited liquidity.
4. Market psychology: A breakdown of this demand zone would trigger panic selling and shift sentiment heavily bearish.
---
🎯 Conclusion
DEXE/USDT is standing at a golden decision point that will define its mid-term direction:
If held → potential bullish rally toward $11–20+.
If broken → high risk of continuation down toward sub-$5 levels.
This is a high-risk, high-reward zone: the opportunity is big, but false breaks are common. Risk management is key.
---
📌 Trading Notes
Always use weekly close for confirmation, not just wicks.
Keep risk per trade < 3% of total capital.
Monitor BTC/ETH correlation as it strongly impacts altcoins.
#DEXE #DEXEUSDT #Crypto #Altcoins #TechnicalAnalysis #PriceAction #SupportResistance #SwingTrading #CryptoAnalysis
DexeDexe usdt Daily analysis
Risk rewards ratio >5 👈👌
Time frame daily
First target =16$
2th target = 19.5 $
Stop is very tight. Below of support line.
If price break the support line and my stop , I don't lose because it's very tight. On the other hand, if price reach to my target , I get good benefit

DEXE: Bounce + RSI Divergence + DeFi Strength
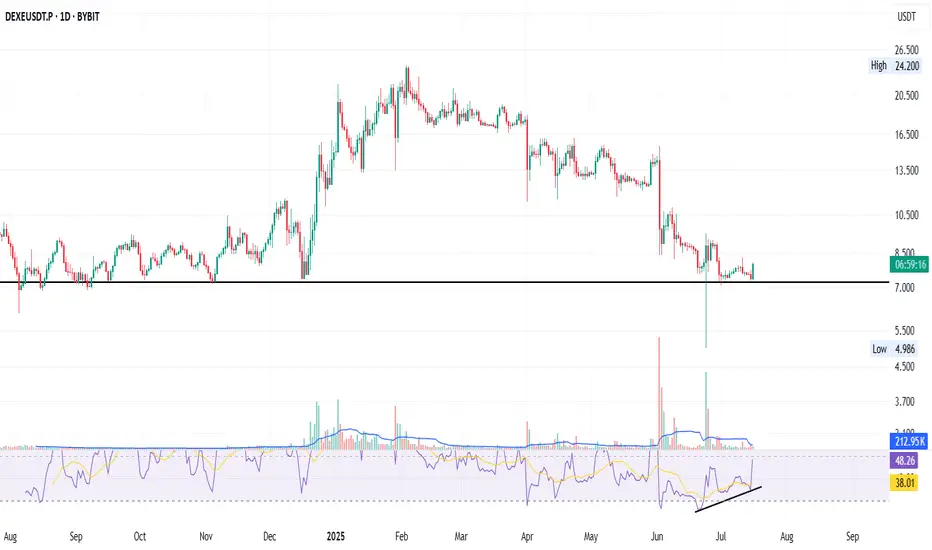
DEXE on the daily just bounced off an 11-month-old support - the key black line.
A strong bullish divergence on the RSI has been building for over a month — now confirming with momentum.
That long green wick under support? It’s signalling buyer interest and possible accumulation.
Fundamentals:
DEXE powers decentralized governance (DAO) with AI + DeFi alignment.
It enables transparent on-chain decision-making and sustainable DAO growth.
Backed by real partnerships, aiming for fair, merit-based participation.
I’m long: not financial advice.
Always take profits and manage risk.
Interaction is welcome.
DEXE/USDT: FALLING WEDGE BREAKOUT!!DEXE Breakout Alert – 80% Move Loading?
Hey Traders! If you're into high-conviction plays and real alpha — hit that like and tap Follow for trade setups that actually deliver.
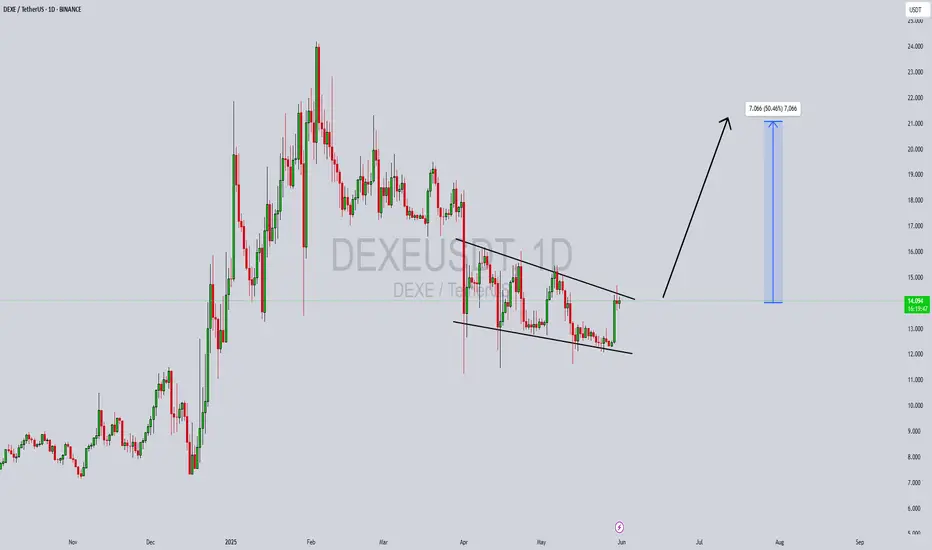
DEXE has broken out of a falling wedge pattern on the daily timeframe and has successfully retested the breakout level. The structure looks strong, and momentum is starting to build.
Entry Zone: $13.4 – $14.4
Targets: $16.1 / $18.2 / $21.2 / $24.4
Stop-loss: $12.60
Leverage: Use low leverage (Max 5x)
This could be the beginning of a powerful upward move.
Keep this setup on your radar and manage risk accordingly.
Let me know your thoughts or if you're riding this one too.

DEXEUSDT Forming a Bullish Wave DEXEUSDT is currently forming a bullish wave pattern, which indicates a strong continuation trend following a previous impulsive move. This technical formation, characterized by a series of higher highs and higher lows, reflects growing investor confidence and buying momentum. With good volume supporting the price structure, the likelihood of a breakout continuation is high, targeting an expected gain of 40% to 50% in the medium term.
DeXe (DEXE) has been gaining traction within the decentralized finance (DeFi) sector. As a governance and staking token for the DeXe network, it offers a unique proposition in decentralized asset and portfolio management. This aligns with the growing demand for transparency and user empowerment in financial decision-making, which enhances its fundamental appeal. The recent bullish wave setup complements this strong narrative, making DEXEUSDT a compelling asset on both technical and fundamental fronts.
From a chartist’s perspective, confirmation of this pattern with a breakout above recent swing highs could attract both momentum and position traders. Supporting indicators such as RSI trending upward and MACD crossover point to increasing bullish strength. The combination of technical alignment and rising on-chain activity for DEXE fuels a high-probability trade setup for bullish continuation.
In conclusion, DEXEUSDT is on the radar of many smart money traders looking to ride the next impulsive leg. If this bullish wave completes as anticipated, we could see significant upside in the coming weeks, especially as DeFi regains momentum across the crypto space.
✅ Show your support by hitting the like button and
✅ Leaving a comment below! (What is You opinion about this Coin)
Your feedback and engagement keep me inspired to share more insightful market analysis with you!
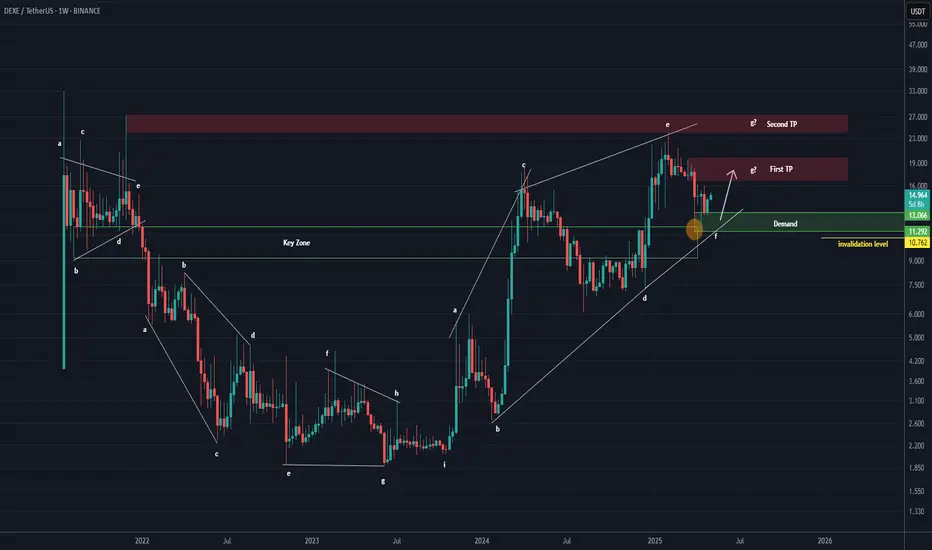
DEXE Analysis (1W)It appears to be in a bullish diametric pattern, and we are likely approaching the end of wave F.
If the price returns to the green zone, we will be looking for buy/long positions there.
We’ve marked two main targets on the chart, which represent the potential objectives for wave G.
A weekly candle closing below the invalidation level will invalidate this view.
For risk management, please don't forget stop loss and capital management
When we reach the first target, save some profit and then change the stop to entry
Comment if you have any questions
Thank You
DEXEUSDT 1D Analysis DEXE ~ 1D Analysis
#DEXE Buy gradually after successfully breaking through this resistance line with a short-term target of at least 10%+.

LONG Position DEXE/USDT#Singal
DEXE/USDT
🟢 LONG Position
🎲 Entry1 @ 14.048
🎲 Entry2 @ 13.920
🎲 Entry3 @ 13.769
✅ Target1@ 14.393
✅ Target2 @ 14.838
✅ Target3 @ 15.407
✅ Target4 @ 16.471
✅ Target5 @ 18.188
❌ Stop Loss @ 12.514
Leverage: 5X_15X
Margin: 10% of Wallet Balance
⚠️"Take Care of Risk Management for Your Account"

DEXE/USDT Analysis. Market Maker LiquidationNews emerged that market maker Wintermute has started selling off tokens including ACT, TST, DF, DEXE, KAVA, HIPPO, LUMIA, BANANAS31, and QUICK. Many of these assets have dropped by 20-50%. Let's analyze one of them.
From the cluster chart, we identified a buyer absorbing the market aggression of sellers. If the price returns to the $13-$12 zone , we will monitor the reaction and enter a long position if confirmation appears.
This trade is suitable for intraday traders and scalpers, as it carries increased risk

Long Entry Signal for DEXE/USDT Based on the daily chart for DEXEUSDT on Bybit, here's a concise analysis:
MLR vs. SMA: The MLR (blue) is above the SMA (pink), indicating a bullish trend.
MLR vs. BB Center: The MLR is above the BB Center Line (orange), suggesting bullish momentum.
PSAR: The PSAR dots (black) are under the price, confirming a bullish trend.
Price vs. SMA 200: The price is above the 200-period SMA (red), supporting a long-term bullish trend.
Current Strategy: Since all entry conditions for a long position are met (MLR above SMA, MLR above BB Center, PSAR under price, price above SMA 200), you might consider entering a long position.
Stop Loss (SL): Set the stop loss at the current level of the PSAR dots to manage risk.
Monitor My Idea: Keep monitoring my idea for any changes in trend or for potential profit-taking opportunities.

TradeCityPro | DEXE: Unveiling DeFi Synergies👋 Welcome to TradeCityPro!
In this analysis, I will be examining the DEXE coin, a DeFi protocol utilized by prominent projects such as Chainlink and Venus.
📅 Weekly Timeframe
In the weekly timeframe, we observe a strong and powerful upward trend that started at the base of 1.940 and has followed a curved trend line up to 17.493.
📈 Currently, after a correction down to 7.18, bullish momentum has re-entered the market, and the price has once again reached 17.493. The RSI is also entering the Overbuy territory, and with the increasing buying volume entering the market, everything is set for the price to move upwards.
✅ Should the price move and stabilize above 17.493, we can expect an increase in price, reaching Fibonacci targets such as the 1 and 1.618 Fibonacci Extension levels, approximately at the 43 and 133 zones.
🔽 In a correction scenario, if the price fakes breaking the 17.493 resistance and starts a new correction phase with a breach of the curved trend line, the correction phase will commence. Key supports are at 7.18, 5.072, and 2.767, and if the 1.940 support breaks, a bearish trend in the High Wave Cycle will start.
📅 Daily Timeframe
In the daily timeframe, we see a solid and powerful ceiling at 20.022, where after significant buying volume and a rise from 7.180, the price has reached and struck twice. If this area is breached, the price could move upwards and set new ATHs.
✨ Increasing buying volume and RSI entering Overbuy will greatly assist in driving the price up and initiating a trend. Conversely, in a price correction, a break of 50 in the RSI could deepen the correction and we could witness a significant price adjustment.
🧩 For a deep correction, the price needs to stabilize below 13.704. In this case, we can expect the correction to continue down to 7.180.
⏳ 4-Hour Timeframe
Let’s delve into the 4-hour timeframe to outline the triggers for futures positions.
🔼 For long positions, the only trigger currently present is breaking 20.767. If this area is breached or the price pulls back to this area, we can enter a long position. The RSI entering Overbuy, as mentioned in other timeframes, will aid price momentum.
📉 For short positions, it is crucial to note that the price is near its ATH, creating a very strong supply zone. Consequently, if the price is rejected from this zone, bearish momentum could enter the market. Therefore, we could take an early and risky entry for a short position at the break of 16.441 and wait for the main position at the break of 13.447.
📝 Final Thoughts
This analysis reflects our opinions and is not financial advice.
Share your thoughts in the comments, and don’t forget to share this analysis with your friends! ❤️

DEXEUSDT: Bullish Potential Amidst Recent RejectionVolume Surge: A significant 114% daily volume increase suggests strong interest in DEXEUSDT.
Price Rejection: Despite the recent price rejection, buyers are actively defending key support levels.
Potential Buy Zones: The blue boxes highlight areas where buyers may step in to support the price.
Risk Management: The red lines indicate potential stop-loss levels for short positions.
Trading Strategy:
Long: Consider entering long positions near the blue box support levels, with stop-loss orders below the red lines.
Short: Short positions could be considered with tight stop-loss orders above the recent price highs.
Disclaimer: This analysis is for informational purposes only and does not constitute financial advice. Always conduct thorough research and consider consulting with a financial advisor before making investment decisions.
I keep my charts clean and simple because I believe clarity leads to better decisions.
My approach is built on years of experience and a solid track record. I don’t claim to know it all, but I’m confident in my ability to spot high-probability setups.
My Previous Analysis
🐶 DOGEUSDT.P: Next Move
🎨 RENDERUSDT.P: Opportunity of the Month
💎 ETHUSDT.P: Where to Retrace
🟢 BNBUSDT.P: Potential Surge
📊 BTC Dominance: Reaction Zone
🌊 WAVESUSDT.P: Demand Zone Potential
🟣 UNIUSDT.P: Long-Term Trade
🔵 XRPUSDT.P: Entry Zones
🔗 LINKUSDT.P: Follow The River
📈 BTCUSDT.P: Two Key Demand Zones
🟩 POLUSDT: Bullish Momentum
🌟 PENDLEUSDT: Where Opportunity Meets Precision
🔥 BTCUSDT.P: Liquidation of Highly Leveraged Longs
🌊 SOLUSDT.P: SOL's Dip - Your Opportunity
🐸 1000PEPEUSDT.P: Prime Bounce Zone Unlocked
🚀 ETHUSDT.P: Set to Explode - Don't Miss This Game Changer
🤖 IQUSDT: Smart Plan
⚡️ PONDUSDT: A Trade Not Taken Is Better Than a Losing One
💼 STMXUSDT: 2 Buying Areas

DEXEUSDT (DeXe) Updated till 03-01-25DEXEUSDT (DeXe) Daily timeframe range. this thing is on roll 2 levels above its price discovery. thats actually impressive. for continue the push it will be better to stay above 18.373. altho its local support still at 11.430. next point to look at is 27.234.

Will DEXEUSDT Be the Next Market Leader? - DeXe◳◱ On the BINANCE:DEXEUSDT chart, the Bband Breakout pattern suggests an upcoming trend shift. Traders might observe resistance around 12.742 | 15.315 | 20.602 and support near 7.455 | 4.741. Entering trades at 11.943 could be strategic, aiming for the next resistance level.
◰◲ General Information :
▣ Name: DeXe
▣ Rank: 151
▣ Exchanges: Binance, Kucoin, Huobipro, Gateio, Mexc
▣ Category / Sector: N/A
▣ Overview: DeXe project overview is currently unavailable. I'll try to update this in the upcoming analysis.
◰◲ Technical Metrics :
▣ Current Price: 11.943 ₮
▣ 24H Volume: 50,568,227.836 ₮
▣ 24H Change: 9.338%
▣ Weekly Change: 40.39%%
▣ Monthly Change: 39.05%%
▣ Quarterly Change: 35.69%%
◲◰ Pivot Points :
▣ Resistance Level: 12.742 | 15.315 | 20.602
▣ Support Level: 7.455 | 4.741
◱◳ Indicator Recommendations :
▣ Oscillators: NEUTRAL
▣ Moving Averages: STRONG_BUY
◰◲ Summary of Technical Indicators : STRONG_BUY
◲◰ Sharpe Ratios :
▣ Last 30 Days: 2.41
▣ Last 90 Days: 1.19
▣ Last Year: 1.42
▣ Last 3 Years: 0.43
◲◰ Volatility Analysis :
▣ Last 30 Days: 1.19
▣ Last 90 Days: 0.93
▣ Last Year: 1.01
▣ Last 3 Years: 1.03
◳◰ Market Sentiment :
▣ News Sentiment: N/A
▣ Twitter Sentiment: N/A
▣ Reddit Sentiment: N/A
▣ In-depth BINANCE:DEXEUSDT analysis available at TradingView TA Page
▣ Your thoughts matter! What do you think of this analysis? Share your insights in the comments below. Your like, follow, and support are greatly valued and help sustain high-quality content.
◲ Disclaimer : Disclaimer
The content provided is for informational purposes only and does not constitute financial, investment, or trading advice. Always conduct your own research and consult a qualified professional before making any financial decisions. Use of the information is solely at your own risk.
▣ Explore the Power of Charting with TradingView
Unlock a wide range of financial analysis tools, data, and features to elevate your trading experience. Take a tour and see the possibilities. If you decide to upgrade your plan, you can receive up to $30 back. Discover more here - affiliate link -

DEXE Technical Analysis in Daily TimeframeHello everyone, I’m Cryptorphic.
For the past seven years, I’ve been sharing insightful charts and analysis.
Follow me for:
~ Unbiased analyses on trending altcoins.
~ Identifying altcoins with 10x-50x potential.
~ Futures trade setups.
~ Daily updates on Bitcoin and Ethereum.
~ High time frame (HTF) market bottom and top calls.
~ Short-term market movements.
~ Charts supported by critical fundamentals.
Now, let’s dive into this chart analysis:
CRYPTOCAP:DEXE is currently near the support trendline and slightly below the 35 EMA, indicating a potentially critical point for the asset.
A breakout above the 35 EMA will likely push the price toward the resistance trendline at $12.37. CRYPTOCAP:DEXE has managed to hold the support trendline, and it must continue to do so to maintain the rally.
Key levels:
- Support Trendline: $8.536.
- Primary Resistance: $10.24.
- Higher Resistance: $12.37.
- Invalidation Point: A close below the support trendline.
DYOR, NFA.
Please hit the like button to support my content and share your thoughts in the comment section. Feel free to request any chart analysis you’d like to see!
Thank you!
#PEACE

#DEXE #DEXE
We have a bearish channel pattern on the 12-hour frame, within which the price moves and adheres to its limits well
We have a green support area at 11.30 after the price touched it and bounced from it
We have a tendency to stabilize above moving average 100
We have a downtrend on the RSI indicator that supports the price higher with a breakout
Entry price is 12.30
First goal 14.28
The second goal is 15.42
the third goal is 16.90

DEXEUSD 1DCRYPTOCAP:DEXE ~ 1D
#DEXE Bullish Pennant Pattern Formed. Make purchases gradually after the resistance line of this pattern is successfully broken. minimum target 15%+
