Dubai Financial Market Index (DFMGI) Daily Chart AnalysisIf you’ve been checking the DFM Index today and wondering whether the Dubai stock market is still bullish or starting to cool off, this daily chart of the Dubai Financial Market index (DFMGI) gives a pretty clean story: strong trend, breakout, then a healthy pullback + consolidation.
This is the kind of phase where investors get confused—because the market stops moving in a straight line. Traders who rely on DFM technical analysis usually do best here, because timing matters more than hype.
What happened on the DFM daily chart (the story in simple terms)
1) Strong uptrend from December lows
From the December base area around 5,822, the index launched into a strong rally with clear higher highs and higher lows—classic bullish structure.
2) Breakout above major levels
The index pushed through prior resistance zones and climbed toward the 6,53x area. That move is important because it shows buyers had real control, not just a small bounce.
3) Now we’re in a pullback phase (not a collapse)
The current price on the chart is around 6,435 after a red pullback candle. This looks more like:
profit-taking after a strong run, and/or
a pause before the next move
…rather than a full trend reversal (at least so far).
In trend markets, pullbacks are normal. The key is where the pullback holds.
Key support and resistance levels to watch on DFMGI
Here are the most obvious levels marked on your chart (these are the areas where the market has “memory”).
Resistance (where the index may struggle)
6,532 = near-term top zone (recent rejection area)
6,618 = next major upside resistance
Bullish confirmation: DFMGI reclaims 6,532 and holds above it (ideally with a strong close).
Support (where buyers must defend)
6,428 = immediate support (current area)
6,317 = key support zone (important “line in the sand”)
6,205 = next support if 6,317 fails
6,096 / 6,023 = deeper supports (only if pullback accelerates)
5,958 / 5,896 / 5,822 = bigger base zones (trend protection levels)
Bearish warning: A clean daily close below 6,317 increases the odds of a deeper retracement toward 6,205.
What this means for investors in Dubai stock market (2026 positioning)
If you’re investing (longer-term mindset)
This chart still looks constructive as long as the index stays above the key supports. For investors, the smartest approach in this phase is usually:
avoid chasing after a big rally
add on pullbacks near support (if the market shows it’s holding)
keep a watchlist ready for the next push
If DFMGI holds above 6,317, the market is still behaving like a strong trend that is simply cooling off.
If you’re trading (timing matters)
This is not the phase where you randomly buy green candles.
A clean technical plan looks like this:
Plan A (bullish continuation):
Hold above 6,428 → reclaim momentum → break above 6,532
Targets become 6,618 and higher
Plan B (deeper pullback):
Lose 6,428 → test 6,317
If 6,317 breaks, next likely magnet is 6,205
This “if/then” approach keeps you out of emotional decisions.
The biggest mistake people make when the DFM pulls back
They assume every red move is a crash.
In reality, strong markets often do this:
rally hard
pull back to a level
consolidate
move again
The trick is simply: know your levels.
Hit the like to show your support!!
Dfmmarket

Dubai Financial Market 2025-26
What happened in 2025 (the story of the year)
### 1) Q1 → early Q2: shaky market, then a hard shakeout
* The index chopped early in the year, then **sold off sharply into late March / early April**.
* You can see a **capitulation-style drop with a long lower wick** (panic flush), bottoming around the **4,65x–4,70x zone** (approx).
**Meaning:** weak hands got forced out. This kind of flush often becomes the “year’s major low.”
---
### 2) Q2 → mid Q3: strong trend reversal + powerful rally
* After that April low, DFM did a **V-reversal** and entered a **strong uptrend** (higher highs + higher lows).
* It rallied aggressively all the way to the **6,20x area**, peaking around **6,205–6,25x**.
**Meaning:** this was the “trend year.” Breakouts and buy-the-dip setups worked much better in this phase.
---
### 3) Q3 → Q4: topping behavior + range (distribution)
* From around August onward, price becomes **sideways/choppy** with **lower momentum**.
* The market repeatedly struggled near **6,205** (major resistance), and dips repeatedly found buyers near **5,822** (major support).
* Late November / early December tested the **5,822** support again, then bounced strongly into year-end.
**Meaning:** 2025 ended not in a clean trend, but in a **big range**.
---
## Where we are right now
Latest close shown: **~6,114**.
### Resistance (where sellers have shown up)
* **6,205** (biggest/most important)
* **6,317** (next upside level on your chart)
### Support (where buyers defended)
* **6,023 → 5,958 → 5,896** (stepping-stone supports)
* **5,822** (most important support of the range)
* If 5,822 breaks: **5,680** is the next major “line in the sand”
---
## What to expect in 2026 (3 realistic scenarios)
### Bull case (best for investors + swing traders)
* Index **holds above ~6,023** and **reclaims 6,205** decisively.
* Then probability increases of a push toward **6,317** and potentially higher.
**Confirmation signal:** a clean break above **6,205** + hold (or breakout → retest → bounce).
---
### Range case (most likely if momentum stays mixed)
* Index rotates between **5,822 support** and **6,205 resistance**.
* This is where people get chopped if they chase green candles.
---
### Bear case (if support fails)
* If **5,822 breaks and doesn’t recover quickly**, the market can slide to **5,680** or even lower support zones

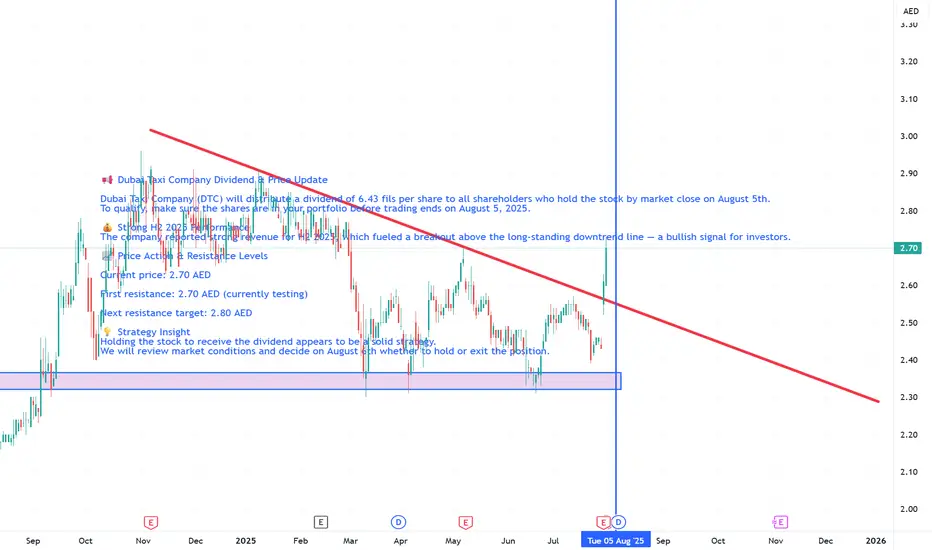
#DFM #DTC📢 Dubai Taxi Company Dividend & Price Update
Dubai Taxi Company (DTC) will distribute a dividend of 6.43 fils per share to all shareholders who hold the stock by market close on August 5th.
To qualify, make sure the shares are in your portfolio before trading ends on August 5, 2025.
💰 Strong H2 2025 Performance
The company reported strong revenue for H2 2025, which fueled a breakout above the long-standing downtrend line — a bullish signal for investors.
📈 Price Action & Resistance Levels
Current price: 2.70 AED
First resistance: 2.70 AED (currently testing)
Next resistance target: 2.80 AED
💡 Strategy Insight
Holding the stock to receive the dividend appears to be a solid strategy.
We will review market conditions and decide on August 6th whether to hold or exit the position.
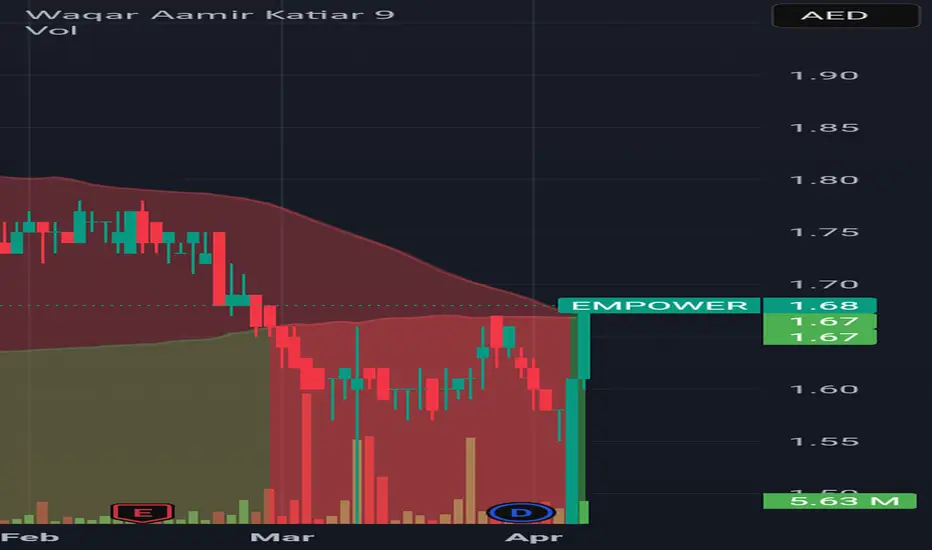
Empower is ready to fly Empower is entered into bullish zone and it will rise again.
Note: this is not a buy sell call. Use stop loss too.
Deyaar Development has a potential of 40% upside!Deyaar is one of the largest developers in Dubai. Its real estate ventures include major growth corridors and prime locations, including Business Bay, Dubai Marina, Al Barsha, DIFC, Jumeirah Lake Towers, Dubai Production City, Dubai Silicon Oasis, Al Barsha South and Al Barsha Heights.
The stock of this company had a breakout from an important horizontal level of AED 0.65 on Monday's trading session. Speaking of the Elliot wave structure of the stock, the company looks to be going into a major bull run as the the latest leg to the upside is supposedly just the wave iii of III of 3(ignore the marking and labeling if you don't follow Elliot waves, just know that the stock can turn into a multi-bagger in future with those kinds of waves unfolding and yet to unfold.)
To talk about the target for the ongoing wave alone, AED 0.95 is the projected target zone for the stock(40% upside from current levels).
As mentioned AED 0.65 was a crucial level for the stock and now the same level should be considered as a strong support for it.
Note*- This post is for educational purpose only. Please do your own analysis/research before taking ang trading/investing decisions.

Slow & SteadyTrend
This stocks usually moves slow with thin volumes, since its dividend time many investors would like to take position. For now its stuck between support & resistance zone. I think near dividend date there are good chances it can break to the upside.
For now wait for the breakout of the resistance that is between 2.57-2.60 zone with good volumes.
Hit like & follow guys ;)
Strong Bulls Trending
No doubt that emaar properties is in a strong uptrend, people are just buying at what ever price they can. There was also a news that emaar will pay higher dividends.
Fundamentals
Real estate market is booking in Dubai and with prices going up companies revenue is also leaping many folds.
Retest
Those who have missed this beautiful rally to the upside now they are waiting for a correction including me to buy this stock. With the strong bulls around i think it can retest 38% FIB and resume its uptrend.
I think overall this stock will be very soon above 10.00 very good for long term holding too.
Hit like & follow guy ;)

Which Scenario ??Chart Pattern
Is it forming inverted cup and handle pattern (scary) if yes then buckle up! we ready to go south till about 0.550 zone. This scenario will change the trend and more down side can also be seen this will be scenario B
Pattern Failure
If this is a chart pattern failure then be ready for some big moves very soon and I think it will hit 0.8xx area very soon. But for this to happen deyaar has to close the price above 0.725 before breaking 0.660 so its a wait and watch game.
Early entry
However we can plan for a early bird entry as price is at support zone and target 0.760 area which will give us good RRR
Hit like & follow guys ;)

Will it breakout Coming week?Ajmanbank is looking interesting and ready to explode coming week most likely. Fridays volume is very impressive and I think if bulls can open with a small gap up in Mondays session I think it will break out and will cross 2.50 very soon. Over all Ajmanbank is bullish.
Hit like & follow guys ;)

Positive MoveAir Arabia is trending up, however its at a resistance area it it survives here then the next target is around 2.80 over all air arabia is positive.
Hit like & follow guys ;)

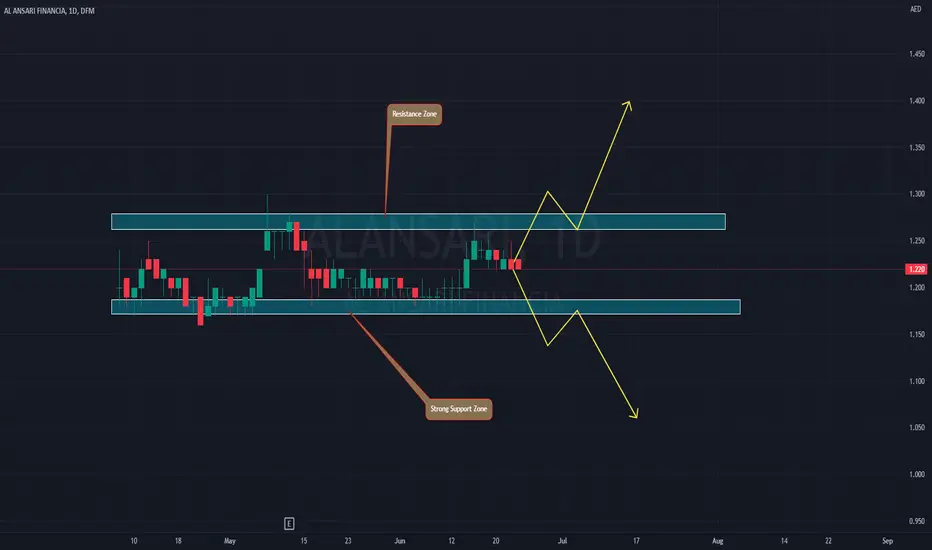
Both Can happenWell Al Ansari is disappointing for now we are not seeing any interesting moves since the time it got listed, how ever its trading in a range lets wait for a breakout. I hope that it breaks to the upside and starts a bull trend.
Hit like & follow guys ;)
Is it still positive or we going southMarket index after hitting 3600 zone is under pressure, watch out the video for better understsnding.
Hit like & follow guys ;)

Is it still good?Even though we saw a red candle close in Fridays session this stock is still bullish and has got potential to go higher from here. Any dip at the support is buying opportunity. Over all this stock is bullish!!!
Hit like & follow guys ;)

Continuation of fallIts been under pressure since it hit the peak of 6.00 and since then its been falling down. There is a hope of bottom formation at current levels but for now i think it will go down further to retest the support level and make a reversal from there. Till the time its below the downward trendline there is no hope of it turning into bullish!!
Hit like & follow guys ;)

Very Confusing DFM market index is under pressure. Last closing is also very tricky, there are good chances it can go down to retest the lower levels. For now we can only consider it to be bullish once we see a solid closing above 3400 zone.
Hit like & follow guys ;)

GO Salik !Resistance of 2.26 was broken earlier this was a early sign that bulls are coming. Todays closing is very positive and more upside is coming. Bullish!!
Hit like & follow guys;)

Under PressureFor now its not looking very good as there are chances it can go further down. For now at a support level but it can hit the resistance as a bounce. Should be considered bullish ONLY when it closes above 6.00
Hit like & follow ;)

Dubai Stock Market IndexDubai Financial Market is still bullish and more upside is expected after a small correction. Any dip from now is a buying opportunity(shares) at the same time keep a close watch on FED's statement about its monetary policy which will effect financial markets over the globe.
Hit like & follow for more updates ;)


Bulls are still active!!Watch out the video if it is helpful hit like and follow for more updates :)

Bulls are hereDubai stock exchange is clearly on a bull run its very good time to invest yes its bit slow for now but i am sure it will soon out perform adx. For now it have taken a bounce from the support zone and ready to fly here. Catch this one!!
Hit like & follow guys !

where will be the breakoutYes over all its very positive but now going side ways even i am holding this trade for about 4 days now. They will soon announce financial results and hopefully it will be positive. I am waiting for my target!!
Hit like & follow guys ;)

Will it cross 5000 pointsIf you are a regular reader of my blogs you must have surely read my last analysis on Dubai Stock Market Index. Market is making new levels every week attracting international & local investors. Blue chip stocks like EmiratesNBD, Emaar Properties, Dubai Islamic Bank are in a strong uptrend and ready to go more higher. As of today 02/04/2022 Dubai Financial Market General Index is at 3536.65 and to add cherry on top by 12/04/2022 Dewa will be listed for trading. More weightage will be added to DFM Index it means more liquidity will be entering the market which is very positive.
I think DFMGI will soon be at 5000 points. Good time to invest in Dubai Stock Market
