DIGIBYTE - A REVERSE DIAMOND ALMOST FORMED!!!📣 Hello everyone!
DigiByte is a fast-growing open source blockchain created in late 2013 and released in early 2014. After 11 years of thoughtful development, DigiByte has become one of the safest, fastest, longest, and most decentralized UTXO blockchains in the world.
Starting to use DigiByte is even easier than sending an SMS. You can send and receive DigiBytes using devices that you already know and love. All you need to do is install a DigiByte-supported Wallet, then click scan, scan the QR code, and send DigiByte. As simple as 1..2..3.
DigiByte has never been funded through an ICO or through a significant number of pre-minted coins (0% remaining). The project does not have a CEO or a company controlling the DigiByte blockchain. Developers and the community are unpaid volunteers who eliminate the risk of bankruptcy.
DigiByte transactions are confirmed within about 15 seconds, which is 40 times faster than Bitcoin and 10 times faster than Litecoin. SegWit allows for up to 1,066 transactions per second within the network, and low fees make DigiByte an ideal currency for daily payments.
DigiByte was created based on the non-breakable Bitcoin blockchain technology and various advanced enhancements were implemented, such as DigiShield protection, MultiAlgo mining, and the Odocrypt algorithm. In addition, the Dandelion++ privacy protocol helps protect you by hiding your IP and physical location. To learn more.
Compared to 21 million Bitcoins, 21 billion DigiBytes (a ratio to BTC of 1,000 to 1) were designed to be ready for mass adoption. DigiByte block rewards decrease by 1% each month, instead of halving every 4 years. All 21 billion DigiBytes will be mined by 2035. After 2035, miners will rely only on commission fees.
DigiByte is not just a fast digital currency. It is an innovative blockchain that can be used for digital assets, smart contracts, decentralized applications, and secure authentication.
__________________________________________
Technical information:
1. I believe a 3-year-long Diamond reversal pattern is forming on the chart, and we will soon see confirmation or refutation of my hypothesis!
2. The long-term goal is to test the global trend resistance, which is about 40x of the current price!!!
_________________________________________
Total: You can try cautious long-term purchases in installments according to your RM, strengthen your position after the pattern is biased!
That's all for today, I wish you good luck in making independent trading decisions and profit. Please analyze the information you receive from me, always think only with your head!
Goodbye! ✊
Dgbusd

DGB/USDT — Falling Wedge: Major Reversal if Breakout Confirms1️⃣ Overview
DGB/USDT has formed a large falling wedge pattern over the past four years, beginning from the 2021 peak.
This structure consists of:
A descending resistance line (upper trendline) connecting a series of lower highs from 2021 to the present.
A gently descending support line (lower trendline) maintaining the sequence of lower lows over time.
A falling wedge on a higher timeframe, such as the weekly chart, often signals a major accumulation phase before a potential bullish reversal occurs.
---
2️⃣ Current Price Condition
Current price: around 0.01121 USDT
Position: Price is testing the wedge resistance line, showing that buying pressure is starting to increase.
Volume: Not yet explosive, but showing a gradual increase, suggesting early accumulation from lower levels.
Weekly candles: Recent candles are forming higher lows, indicating early signs of bullish momentum.
---
3️⃣ Pattern Analysis: Falling Wedge
The falling wedge is widely recognized as a bullish reversal pattern, even though it forms during prolonged downtrends.
Key characteristics seen on this chart include:
Downward-sloping but converging trendlines.
Decreasing selling pressure over time.
Tightening volatility as price approaches the apex of the wedge.
A confirmed breakout above the wedge usually marks the end of the distribution phase and the beginning of a new expansion cycle.
---
4️⃣ Bullish Scenario (Reversal Potential)
If DGB successfully breaks above the wedge resistance with strong volume and a solid weekly close:
Momentum could push the price quickly toward the first target at 0.0179 USDT.
A successful breakout and retest may allow continuation toward 0.0385 – 0.0790 USDT.
This setup could trigger a multi-year trend reversal, especially if the broader altcoin market strengthens.
Key confirmations for the bullish scenario:
Weekly close above 0.012 USDT with strong buying volume.
RSI moving above 50.
MACD bullish crossover on the weekly timeframe.
Successful retest of the wedge resistance as new support.
---
5️⃣ Bearish Scenario (Failed Breakout / False Breakout)
If a strong rejection occurs at the wedge resistance:
Price may retrace back toward the lower support zone at 0.006 – 0.004 USDT.
A drop below 0.00346 USDT would invalidate the wedge and open room for further downside.
A false breakout with a long upper wick followed by a close below resistance often leads to a sharp retracement.
Confirmations for the bearish scenario:
Weekly candle forms a long upper wick (rejection).
Volume fails to support the breakout attempt.
RSI falls back below 40.
Breakdown below wedge support with strong selling pressure.
---
6️⃣ Strategy & Risk Management
For Bullish Traders:
Conservative entry: Wait for a confirmed weekly close above wedge resistance.
Aggressive entry: Enter on breakout with a tight stop below the breakout candle.
Take partial profits at each resistance: 0.0179 → 0.0385 → 0.0790 USDT.
Suggested stop-loss below 0.0060 or under the wedge low (0.0034) depending on risk profile.
For Bearish Traders:
Wait for clear rejection at wedge resistance before entering short positions.
Targets: lower wedge area (0.004–0.005 USDT).
Place stop-loss above the rejection candle high.
---
7️⃣ Conclusion
The multi-year falling wedge on DGB/USDT indicates that the coin may be approaching the final stage of long-term selling pressure.
If a weekly breakout confirms, DGB could enter a major bullish reversal phase.
However, without sufficient volume and a weekly close above key resistance, the risk of a false breakout remains high.
The current zone (0.010–0.012 USDT) is the critical decision area that will define DGB’s macro direction for the coming months.
#DGB #DGBUSDT #CryptoAnalysis #Altcoins #FallingWedge #TechnicalAnalysis #Breakout #CryptoTrading #ChartPattern #WeeklyAnalysis #BullishSetup #ReversalPattern #CryptoMarket

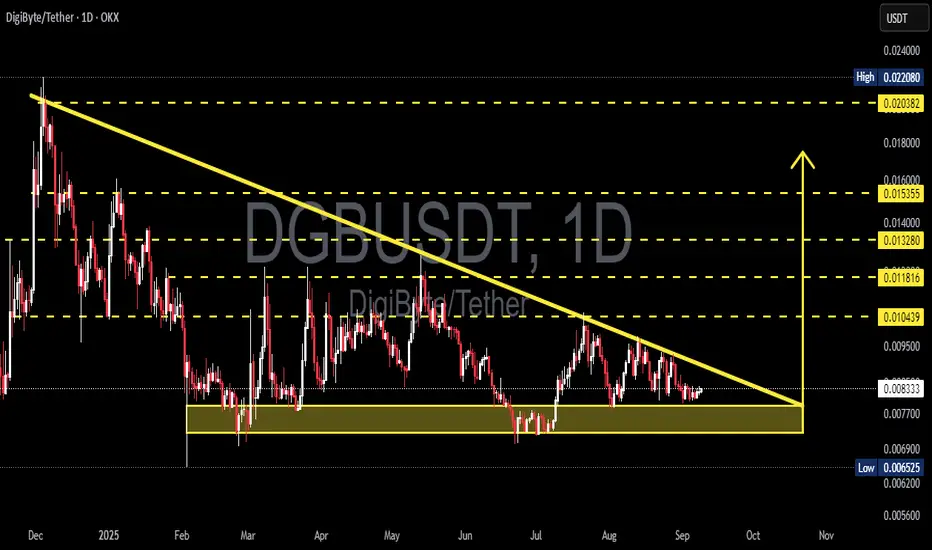
DGBUSDT — the Start of Major Reversal or the End of AccumulationDGB is once again standing at the edge of its most critical demand zone between 0.0070–0.0067 (yellow box). This area has acted as a strong defense level throughout 2025, with each touch previously triggering a solid bullish reaction.
However, this time the selling pressure appears more aggressive — with a sharp liquidity sweep below the zone, followed by a quick recovery. This could signal the presence of a potential bear trap or the final shakeout before a reversal.
---
Technical Structure Overview
Primary pattern: Long-term accumulation range with lower highs and flat support — resembling a descending accumulation structure.
Key demand zone: 0.0070–0.0067
Layered resistance levels: 0.0080 • 0.0086 • 0.0094 • 0.0104 • 0.0118 • 0.0133 • 0.0153 • 0.0203
Volume: Still low, suggesting possible stealth accumulation by larger market participants.
---
Bullish Scenario – Reversal from the “Capitulation Zone”
If DGB manages to hold above this zone and close daily candles above 0.0086 with rising volume, it could mark the beginning of a major multi-week reversal after months of consolidation.
Breakout confirmation: Daily close above 0.0086.
Short-term targets: 0.0094 → 0.0104 → 0.0118 → 0.0133.
Mid-term expansion targets: 0.0153 – 0.0203.
Market narrative: A potential bear trap followed by reaccumulation could trigger a sharp short-covering rally.
> “A daily close above 0.0086 could ignite a strong bullish reversal phase.”
---
Bearish Scenario – Breakdown from Historical Support
On the flip side, if price closes daily below 0.0067 without a strong recovery, the historical demand zone officially breaks down — opening room for deeper corrections toward 0.0059 – 0.0053.
Breakdown confirmation: Daily close below 0.0067.
Downside targets: 0.0059 – 0.0053.
Market narrative: A confirmed breakdown would signal the end of the long accumulation phase and the start of a new distribution leg.
> “Failure to defend the yellow zone may mark the transition from accumulation to full-scale distribution.”
---
Pattern Insight & Sentiment
DGB currently sits at a critical crossroads — either the start of a strong bullish reversal or the final stage of breakdown.
The deep wick below support hints at liquidity collection, a classic sign often seen before a major trend reversal.
Structurally, the setup resembles a Descending Accumulation Pattern, where every new dip attracts fresh buying interest. Still, without a confirmed breakout above 0.0086, bulls remain unconfirmed.
---
Strategic Outlook
Swing Traders: Wait for a confirmed daily breakout above 0.0086.
Accumulative Buyers: Scale entries within 0.0070–0.0067 with a tight stop below 0.0065.
Bearish Traders: Short only after a confirmed breakdown and failed retest below 0.0067.
#DGB #DigiByte #CryptoAnalysis #PriceAction #TechnicalAnalysis #SupportAndResistance #CryptoTrading #SwingTrade #AccumulationZone #ReversalPattern

DGBUSD - DigiByte, the Hidden GemThis is an idea based on the DGBUSD chart 1W log using Fibs levels and Bars Patterns.
DigiByte is known as the most decentralized coin on the market. Open Source, better tech than Bitcoin, smart contracts, decentralized applications and secure authentication, make DGB a True Gem.
Rumors about the incoming DigiDollar stable coin and years of accumulation could skyrocket soon the demand. DigiByte is ready for a 100-200x
This is not a financial advice. Do Your Own Research

DGB/USDT — Descending Triangle at a Critical Demand Zone🔎 Technical Overview
On the daily chart, DGB/USDT is forming a descending triangle, with a clear downward sloping trendline acting as dynamic resistance and a horizontal demand zone around 0.0065 – 0.0077 USDT providing strong support.
This setup reflects a phase of accumulation or distribution, where the market is preparing for a decisive move: either a bullish breakout above the descending trendline or a bearish breakdown below the demand zone.
---
📊 Key Technical Levels
Current price: 0.008295
Demand zone (support): 0.0065 – 0.0077 (yellow box)
Upside resistance levels:
0.010439 → first breakout confirmation
0.011816 → secondary resistance
0.013280 → mid-term target
0.015355 → extended target
0.020382 & 0.022080 → major upside levels if momentum accelerates
---
🟢 Bullish Scenarios
1. Confirmed Breakout (conservative):
If the price manages to close a daily candle above the descending trendline and reclaim 0.010439, bullish momentum is likely to strengthen.
Targets: 0.0118 → 0.0132 → 0.0153
Key signals: rising volume, RSI recovery, strong daily green candle.
2. Bounce from Demand (aggressive):
If price retests the 0.0065–0.0077 zone and bounces, this area may serve as a strong accumulation point.
Stop loss: below 0.0063–0.0065.
Initial target: 0.0104, with extensions to higher resistances.
Risk-to-reward ratio could be highly favorable if the bounce holds.
---
🔴 Bearish Scenario
A daily close below 0.0065 would confirm the descending triangle breakdown.
This breakdown could trigger further downside with a target toward 0.0056 or lower.
After the breakdown, the 0.0065–0.0077 zone would flip into a supply zone (resistance).
---
📌 Pattern & Sentiment
Descending Triangle: traditionally considered a bearish continuation pattern, but in crypto markets, upside breakouts are also possible.
Historical Demand Zone: the highlighted yellow box has been tested multiple times since March 2025, making it a key psychological support.
Market Sentiment: the reaction around this zone and the ability to break the trendline will dictate the medium-term direction.
---
⚖️ Conclusion & Strategy
Bullish play: wait for a breakout above 0.0104 with strong volume (safer) or accumulate cautiously in the demand zone with a tight SL (riskier).
Bearish play: a daily close below 0.0065 signals breakdown and opens the door for deeper declines.
Risk management: always use stop loss and limit exposure to 1–2% risk per trade.
DGB is currently at a make-or-break point. Whether buyers can defend the demand zone or sellers push through support will define the next big move.
---
#DGBUSDT #DGB #DigiByte #CryptoAnalysis #TechnicalAnalysis #DescendingTriangle #CryptoTrading #SupportAndResistance #Altcoins
Digibyte $DGB Breakout watch. Bullish surge ahead?Digibyte appears to be reawakening, and a long accumulation phase appears to be ending.
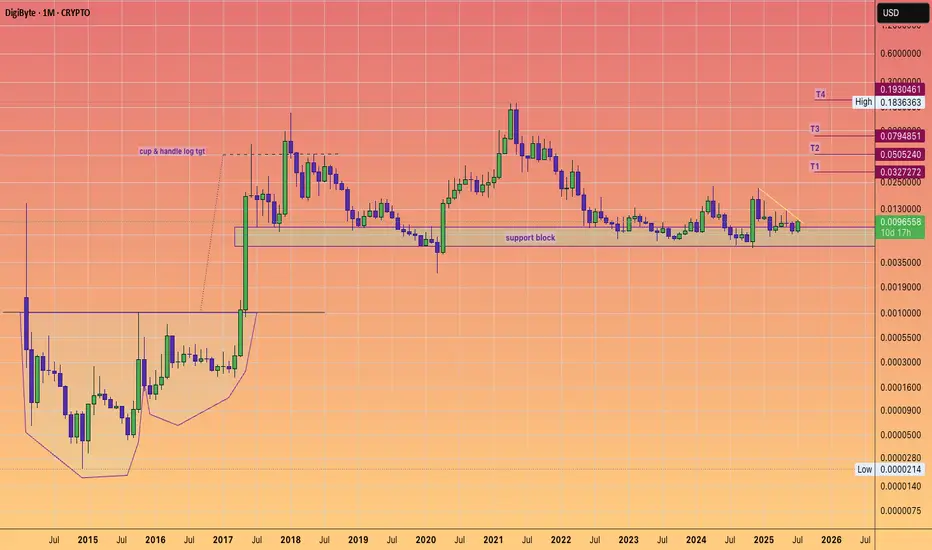
If we scroll back to the beginning of the chart we can see the massive cup and handle and the subsequent moonshot to 5 cents.
I think 5 cents will also come back into play, in these coming weeks and months a healthy 5X.
As we know technically Digibyte is known for speed and decentralisation and UNDERvaluation.
Their much loyal supporter base deserve another moon mission.
DGBUSDT Ready to Explode? Major Breakout from 7-Month Downtrend📉 Pattern: Falling Wedge / Descending Triangle Breakout
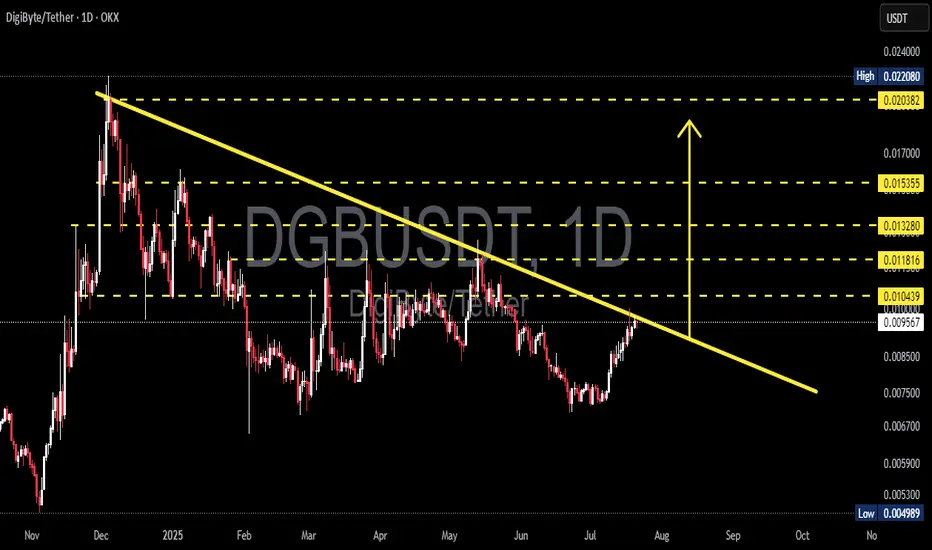
DigiByte (DGB) is currently showing a high-probability breakout from a descending trendline that has held price action in check since December 2024. This structure hints at weakening selling pressure while buyers have started forming higher lows, suggesting potential momentum shift.
🔍 Chart Structure & Key Technicals:
Descending Trendline Resistance (yellow line): Tested multiple times since December 2024. The more often a level is tested, the more likely it breaks.
Breakout Zone: Price is now breaking and retesting the key breakout zone between 0.0095 - 0.0104.
Volume: Gradual increase in volume hints at accumulation by bulls and supports the breakout scenario.
🐂 Bullish Scenario: Breakout Confirmation Could Trigger 100%+ Rally!
If price closes decisively above 0.0104, it would confirm the breakout and open up multiple upside targets:
Target Price Level Notes
🎯 Target 1 0.0118 Minor resistance — initial profit zone
🎯 Target 2 0.0132 Previous structure resistance
🎯 Target 3 0.0153 Major Fibonacci and psychological level
🎯 Target 4 0.0203 Key breakout level from early 2025
🎯 Target 5 0.0220 (High) Full breakout target based on historical high
➡️ A confirmed breakout from this 7-month trendline could trigger a powerful mid-term bullish run.
🐻 Bearish Scenario: Rejection = Downtrend Still Intact
If DGB fails to hold above 0.0095–0.0104 and gets rejected:
Price could fall back toward support zones at 0.0075, then 0.0060
A breakdown below 0.0050 (historical low) could lead to deeper selloffs
Lack of volume on breakout = potential fakeout / bull trap
🧠 Market Psychology & Pattern Context:
Falling Wedge Pattern: A classic reversal pattern signaling that sellers are losing control while buyers prepare for a breakout.
Volume Confirmation: Valid breakouts are almost always accompanied by rising volume. Watch this closely!
Psychological Price Levels: Zones like 0.01, 0.015, and 0.02 often act as magnet levels and take-profit targets for institutions or swing traders.
⚠️ Summary & Strategy:
DGB is currently at one of its most critical levels in 2025
Bullish breakout could deliver 50%–120% upside for swing traders
Rejection = caution, don’t FOMO into resistance
Ideal SL (stop loss) below 0.0090 for breakout entries
📢 Final Tip:
> "Breakouts are only as strong as the volume and candle closes behind them. Wait for confirmation — don’t chase shadows."
#DGB #DGBUSDT #CryptoBreakout #AltcoinAnalysis #TechnicalAnalysis #FallingWedgePattern #BullishSetup #BearishScenario #CryptoTrading #TrendlineBreakout
DGB/USDT – Preparing for a Rebound from a Historical Demand Zone
🔍 Pattern and Structure Analysis
The DGB/USDT pair is currently testing a historical demand zone in the 0.00550 – 0.00733 USDT area (highlighted in yellow). This zone has proven to be a strong bounce area since mid-2022. The price structure is forming a large double bottom in this support zone, indicating a potential medium- to long-term bullish reversal pattern.
🟢 Bullish Scenario
If the price successfully holds and bounces from this support:
Short-term targets: 0.00832 – 0.01067 USDT
Mid-term targets: 0.01343 – 0.01807 USDT
Long-term targets: 0.03207 – 0.03845 USDT
This potential upside is supported by an emerging early-stage parabolic move, as illustrated by the yellow projection arrow. If volume increases and market sentiment improves, we may see a multi-wave recovery pattern unfold.
🔴 Bearish Scenario
However, if the price breaks down below the key support at 0.0055 USDT:
It may retest the all-time low around 0.00500 USDT
Such a breakdown would invalidate the long-standing support structure and may lead to further downside pressure
🧩 Pattern Summary
Pattern: Double Bottom / Accumulation Zone
Timeframe: 1W (Weekly)
Current Sentiment: Neutral to Bullish, depending on confirmation of a rebound from the yellow zone
🧠 Additional Notes
This accumulation zone may present a valuable opportunity for swing traders or long-term investors looking for entries at undervalued levels. However, it's crucial to wait for volume confirmation and a strong reversal candlestick pattern before entering.
#DGB #DGBUSDT #AltcoinAnalysis #CryptoWeekly #DoubleBottom #SupportZone #ReversalPattern #CryptoSignals

DGBUSDT 1W AnalysisDGB ~ 1W Analysis
#DGB Buy back gradually from this support block with a short term target of at least 20%+ from here.

#DGB/USDT#DGB
The price is moving within a descending channel on the 1-hour frame and is expected to continue lower.
We have a trend to stabilize below the 100 moving average once again.
We have a downtrend on the RSI indicator, supporting the upward move with a break above it.
We have a resistance area at the upper limit of the channel at 0.00906.
Entry price: 0.00894
First target: 0.00863
Second target: 0.00831
Third target: 0.00797

DGBUSDT 1WDGB Update ~ 1W
#DGB So far it continues to maintain its bullish structure. The this block is wave 2 in the Eliot Wave pattern. Minimum target 20%++

#DGB/USDT Ready to launch upwards#DGB
The price is moving in a descending channel on the 1-hour frame and sticking to it well
We have a bounce from the lower limit of the descending channel, this support is at a price of 0.0111
We have a downtrend on the RSI indicator that is about to be broken, which supports the rise
We have a trend to stabilize above the moving average 100
Entry price 0.01234
First target 0.01305
Second target 0.01358
Third target 0.1432

Digibyte looks like it’s validating the invh&s breakoutDigibyte shown here on the daily chart showing a nice bullish impulse firmly above the neckline of its inverse head and shoulders pattern. Already well on the way to the breakout target here so very likely validating the breakout. Also doing so a day or so before it has its golden cross. Once it reaches the full breakout target it’s likely to test the next potential resistance of the yellow horizontal trendline. That trendline is actually the neckline of a larger double bottom pattern. Wouldn’t be surprised with the golden cross so close by that whatever resistance that double bottom neckline provides doesn’t last very long *not financiala dvice*

DGB blasts above double bottom target; invh&s now in play.Digibyte reached the double bottom breakout target and then some with yesterday’s big green candle. Now that it has spent the current daily candle consolidating, it has already consolidated long enough to make it so there is currently a valid inverse head and shoulders pattern in play on the 4 hour chart. If it takes a few more daily candles of consolidation before the next leg up then that inverse head and shoulders pattern will probably also qualify as a daily chart pattern as well. Digibyte has room for lots of upside, and now that I’m realizing it is a US based cryptocurrency, if Trump truly were to exempt US cryptos from capital gains tax, then I think it is a high probability digibyte could see new all time highs this bull run, which would mean tremendous upside from here. Even if digiibyte were simply to just trigger the breakout of this currently developing inverse head and shoulders pattern though, the target for that would almost double digibyte’s current value. So yes tremendous upside potential here. *not financial advice*

#DGB (SPOT) entry range ( 0.00620- 0.00675) SL (0.00596)entry range( 0.00620- 0.00675)
Target (0.00799)
SL .4H close below (0.00596)
1:2 Trade
BINANCE:DGBUSDT

DGBUSDTDGB ~ 1W
#DGB Retesting this lowest support block. If you have Conviction on this coin,. This is a great time to buy back.

DGBUSDTDGB ~ 1W
#DGB Retesting this lowest support block. If you have Conviction on this coin,. This is a great time to buy back.

DGBUSDT 1WDGB ~ 1W
#DGB Price maintains this Block of demand zone, It seems that the current price is good enough to start buying, at least for the short 20%+.

Massive gains are coming to DGB over the next 3 years.Long-term investors of DGB are going to see life-changing gains over the next three years. The vast majority of crypto investors are infected with the 'instant-gratification' disease, which makes them uneasy if they don't turn a massive profit within minutes of buying any given crypto. But that's not how the world works (unless you're incredibly lucky).
The long-term holders of DGB will see gains that the impatient short-term holders will only dream of seeing.
Keep stacking and enjoy the ride!

DGB, this OLD coin is telling me to ACCUMULATE! Gut feel says soDGB, one of the oldest digital coin ever existed, is registering massive net buying this past few days. The + volume surge is warranted knowing that the coin is sitting at below 1.0 FIB LEVEL of support. To call this beyond discount/bargain is an understatement.
Based on fundamentals and progressive project developments, this is one of the most undervalued coin ever existed. But that could change soon based on the recent price action lately.
On monthly data, Histogram shift has been recorded after 6 months of waiting. On weekly, a downtrend line has been broken after waiting 15 months. This is a huge hint. A bubble up volume has appeared twice in a row these past 2 weeks conveying the anticipation of buyers in fundamental and technical growth.
Volume past few days has surged +35% more than its average numbers.
Expect some significant price valuation from the current price range.
*HIGH CONFIDENCE on this one -- we may see a new ATH on this one in the next few seasons.
Great Risk Reward ratio on this one.
Spotted at 0.008900
TAYOR
Safeguard capital always.

A 50X may be coming for DGB (Digibyte) in 2024/2025.The current chart for DGB (Digibyte) is one of the best looking charts in all of crypto! This coin has a ton of potential in my opinion, and as the dollar continues to deteriorate, cash will be flowing into digital assets faster than you ability to comprehend.
Good luck, and always use a stop-loss!

DGB hits white channels full brkout target; teal channel nextDigibyte finally breaks out of the white channel and then quickly hits the full breakout target. Now it is attempting to break above the teal channel and fiip its top trendline to support to trigger that breakout as well. Once it does, the breaout target is around 2 cents which from here would be about another 60% gains. Not sure how quickly digibyte will pull this off it could definitely consolidate for a few before it does so or it could continue. Current momentum and keep pumping. *not financial advice*

Digibyte has hit the first to 2 targets onto the next 2!Digibyte is finally awakening from hibernation. As ong as it maintains the teal neckline as support we will hit the dotted green measured move lines target and the dotted teal measured move line’s target in the very near future. *not financial dvice*
