DGB/USDT — Falling Wedge: Major Reversal if Breakout Confirms1️⃣ Overview
DGB/USDT has formed a large falling wedge pattern over the past four years, beginning from the 2021 peak.
This structure consists of:
A descending resistance line (upper trendline) connecting a series of lower highs from 2021 to the present.
A gently descending support line (lower trendline) maintaining the sequence of lower lows over time.
A falling wedge on a higher timeframe, such as the weekly chart, often signals a major accumulation phase before a potential bullish reversal occurs.
---
2️⃣ Current Price Condition
Current price: around 0.01121 USDT
Position: Price is testing the wedge resistance line, showing that buying pressure is starting to increase.
Volume: Not yet explosive, but showing a gradual increase, suggesting early accumulation from lower levels.
Weekly candles: Recent candles are forming higher lows, indicating early signs of bullish momentum.
---
3️⃣ Pattern Analysis: Falling Wedge
The falling wedge is widely recognized as a bullish reversal pattern, even though it forms during prolonged downtrends.
Key characteristics seen on this chart include:
Downward-sloping but converging trendlines.
Decreasing selling pressure over time.
Tightening volatility as price approaches the apex of the wedge.
A confirmed breakout above the wedge usually marks the end of the distribution phase and the beginning of a new expansion cycle.
---
4️⃣ Bullish Scenario (Reversal Potential)
If DGB successfully breaks above the wedge resistance with strong volume and a solid weekly close:
Momentum could push the price quickly toward the first target at 0.0179 USDT.
A successful breakout and retest may allow continuation toward 0.0385 – 0.0790 USDT.
This setup could trigger a multi-year trend reversal, especially if the broader altcoin market strengthens.
Key confirmations for the bullish scenario:
Weekly close above 0.012 USDT with strong buying volume.
RSI moving above 50.
MACD bullish crossover on the weekly timeframe.
Successful retest of the wedge resistance as new support.
---
5️⃣ Bearish Scenario (Failed Breakout / False Breakout)
If a strong rejection occurs at the wedge resistance:
Price may retrace back toward the lower support zone at 0.006 – 0.004 USDT.
A drop below 0.00346 USDT would invalidate the wedge and open room for further downside.
A false breakout with a long upper wick followed by a close below resistance often leads to a sharp retracement.
Confirmations for the bearish scenario:
Weekly candle forms a long upper wick (rejection).
Volume fails to support the breakout attempt.
RSI falls back below 40.
Breakdown below wedge support with strong selling pressure.
---
6️⃣ Strategy & Risk Management
For Bullish Traders:
Conservative entry: Wait for a confirmed weekly close above wedge resistance.
Aggressive entry: Enter on breakout with a tight stop below the breakout candle.
Take partial profits at each resistance: 0.0179 → 0.0385 → 0.0790 USDT.
Suggested stop-loss below 0.0060 or under the wedge low (0.0034) depending on risk profile.
For Bearish Traders:
Wait for clear rejection at wedge resistance before entering short positions.
Targets: lower wedge area (0.004–0.005 USDT).
Place stop-loss above the rejection candle high.
---
7️⃣ Conclusion
The multi-year falling wedge on DGB/USDT indicates that the coin may be approaching the final stage of long-term selling pressure.
If a weekly breakout confirms, DGB could enter a major bullish reversal phase.
However, without sufficient volume and a weekly close above key resistance, the risk of a false breakout remains high.
The current zone (0.010–0.012 USDT) is the critical decision area that will define DGB’s macro direction for the coming months.
#DGB #DGBUSDT #CryptoAnalysis #Altcoins #FallingWedge #TechnicalAnalysis #Breakout #CryptoTrading #ChartPattern #WeeklyAnalysis #BullishSetup #ReversalPattern #CryptoMarket
Dgbusdc

DGBUSDT — the Start of Major Reversal or the End of AccumulationDGB is once again standing at the edge of its most critical demand zone between 0.0070–0.0067 (yellow box). This area has acted as a strong defense level throughout 2025, with each touch previously triggering a solid bullish reaction.
However, this time the selling pressure appears more aggressive — with a sharp liquidity sweep below the zone, followed by a quick recovery. This could signal the presence of a potential bear trap or the final shakeout before a reversal.
---
Technical Structure Overview
Primary pattern: Long-term accumulation range with lower highs and flat support — resembling a descending accumulation structure.
Key demand zone: 0.0070–0.0067
Layered resistance levels: 0.0080 • 0.0086 • 0.0094 • 0.0104 • 0.0118 • 0.0133 • 0.0153 • 0.0203
Volume: Still low, suggesting possible stealth accumulation by larger market participants.
---
Bullish Scenario – Reversal from the “Capitulation Zone”
If DGB manages to hold above this zone and close daily candles above 0.0086 with rising volume, it could mark the beginning of a major multi-week reversal after months of consolidation.
Breakout confirmation: Daily close above 0.0086.
Short-term targets: 0.0094 → 0.0104 → 0.0118 → 0.0133.
Mid-term expansion targets: 0.0153 – 0.0203.
Market narrative: A potential bear trap followed by reaccumulation could trigger a sharp short-covering rally.
> “A daily close above 0.0086 could ignite a strong bullish reversal phase.”
---
Bearish Scenario – Breakdown from Historical Support
On the flip side, if price closes daily below 0.0067 without a strong recovery, the historical demand zone officially breaks down — opening room for deeper corrections toward 0.0059 – 0.0053.
Breakdown confirmation: Daily close below 0.0067.
Downside targets: 0.0059 – 0.0053.
Market narrative: A confirmed breakdown would signal the end of the long accumulation phase and the start of a new distribution leg.
> “Failure to defend the yellow zone may mark the transition from accumulation to full-scale distribution.”
---
Pattern Insight & Sentiment
DGB currently sits at a critical crossroads — either the start of a strong bullish reversal or the final stage of breakdown.
The deep wick below support hints at liquidity collection, a classic sign often seen before a major trend reversal.
Structurally, the setup resembles a Descending Accumulation Pattern, where every new dip attracts fresh buying interest. Still, without a confirmed breakout above 0.0086, bulls remain unconfirmed.
---
Strategic Outlook
Swing Traders: Wait for a confirmed daily breakout above 0.0086.
Accumulative Buyers: Scale entries within 0.0070–0.0067 with a tight stop below 0.0065.
Bearish Traders: Short only after a confirmed breakdown and failed retest below 0.0067.
#DGB #DigiByte #CryptoAnalysis #PriceAction #TechnicalAnalysis #SupportAndResistance #CryptoTrading #SwingTrade #AccumulationZone #ReversalPattern

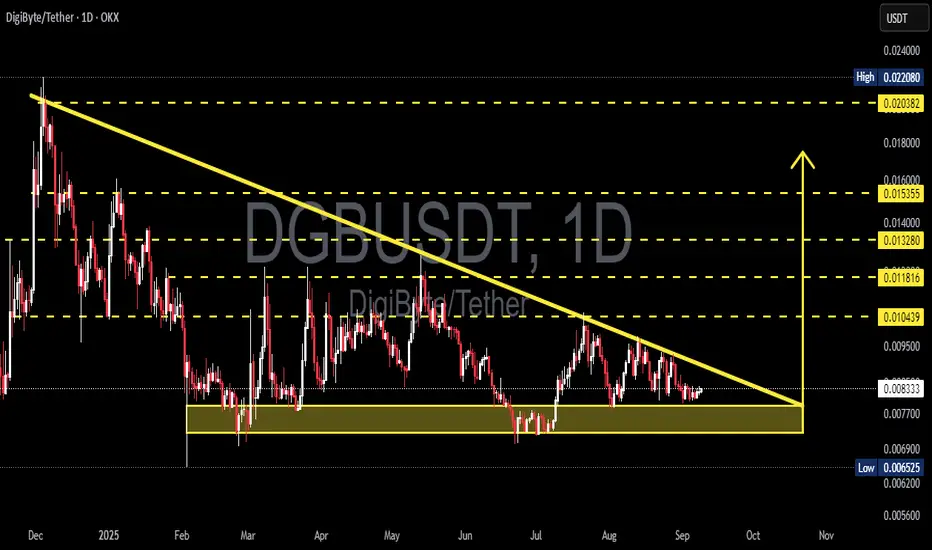
DGB/USDT — Descending Triangle at a Critical Demand Zone🔎 Technical Overview
On the daily chart, DGB/USDT is forming a descending triangle, with a clear downward sloping trendline acting as dynamic resistance and a horizontal demand zone around 0.0065 – 0.0077 USDT providing strong support.
This setup reflects a phase of accumulation or distribution, where the market is preparing for a decisive move: either a bullish breakout above the descending trendline or a bearish breakdown below the demand zone.
---
📊 Key Technical Levels
Current price: 0.008295
Demand zone (support): 0.0065 – 0.0077 (yellow box)
Upside resistance levels:
0.010439 → first breakout confirmation
0.011816 → secondary resistance
0.013280 → mid-term target
0.015355 → extended target
0.020382 & 0.022080 → major upside levels if momentum accelerates
---
🟢 Bullish Scenarios
1. Confirmed Breakout (conservative):
If the price manages to close a daily candle above the descending trendline and reclaim 0.010439, bullish momentum is likely to strengthen.
Targets: 0.0118 → 0.0132 → 0.0153
Key signals: rising volume, RSI recovery, strong daily green candle.
2. Bounce from Demand (aggressive):
If price retests the 0.0065–0.0077 zone and bounces, this area may serve as a strong accumulation point.
Stop loss: below 0.0063–0.0065.
Initial target: 0.0104, with extensions to higher resistances.
Risk-to-reward ratio could be highly favorable if the bounce holds.
---
🔴 Bearish Scenario
A daily close below 0.0065 would confirm the descending triangle breakdown.
This breakdown could trigger further downside with a target toward 0.0056 or lower.
After the breakdown, the 0.0065–0.0077 zone would flip into a supply zone (resistance).
---
📌 Pattern & Sentiment
Descending Triangle: traditionally considered a bearish continuation pattern, but in crypto markets, upside breakouts are also possible.
Historical Demand Zone: the highlighted yellow box has been tested multiple times since March 2025, making it a key psychological support.
Market Sentiment: the reaction around this zone and the ability to break the trendline will dictate the medium-term direction.
---
⚖️ Conclusion & Strategy
Bullish play: wait for a breakout above 0.0104 with strong volume (safer) or accumulate cautiously in the demand zone with a tight SL (riskier).
Bearish play: a daily close below 0.0065 signals breakdown and opens the door for deeper declines.
Risk management: always use stop loss and limit exposure to 1–2% risk per trade.
DGB is currently at a make-or-break point. Whether buyers can defend the demand zone or sellers push through support will define the next big move.
---
#DGBUSDT #DGB #DigiByte #CryptoAnalysis #TechnicalAnalysis #DescendingTriangle #CryptoTrading #SupportAndResistance #Altcoins
Massive gains are coming to DGB over the next 3 years.Long-term investors of DGB are going to see life-changing gains over the next three years. The vast majority of crypto investors are infected with the 'instant-gratification' disease, which makes them uneasy if they don't turn a massive profit within minutes of buying any given crypto. But that's not how the world works (unless you're incredibly lucky).
The long-term holders of DGB will see gains that the impatient short-term holders will only dream of seeing.
Keep stacking and enjoy the ride!

A 50X may be coming for DGB (Digibyte) in 2024/2025.The current chart for DGB (Digibyte) is one of the best looking charts in all of crypto! This coin has a ton of potential in my opinion, and as the dollar continues to deteriorate, cash will be flowing into digital assets faster than you ability to comprehend.
Good luck, and always use a stop-loss!

DGB retested 2600 day trend line. x300-500 opportunity (2W)I found interesting trend line on DGB-USD 2W chart that started more than 2600 days ago and recently price retested it again and reversed upwards.
Since bullrun 2017 DGB formed a MASSIVE ascending triangle.I took it's height and put it on the breakout point which brought it to 8-13$.
Also my targets on 8$ and 13$ were measured with FIB retracement before.
From current price gains could be from x100 to x500 if this pattern plays out but it seems that this trend line is pretty important.
This coin did not perform well for the last months but i still tying to accumulate more DGB.
DGB investors could see life changing returns very soon. Patience will be rewarded :)
