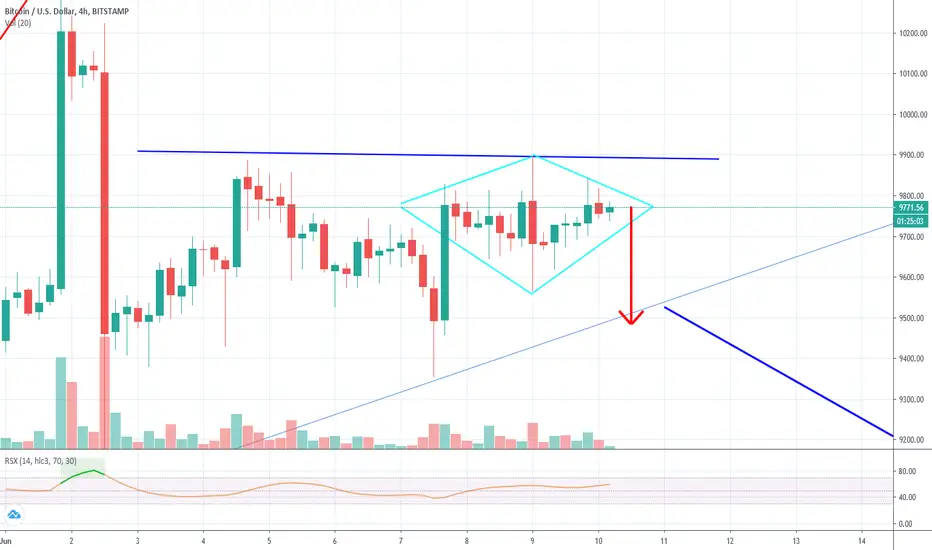
Strong diamond pattern formingDiamond pattern forming on 4h timeframe. This means that the trend will soon reverse and test very strong 9500 level
Diamondpattern
USDCAD: Diamond forming in progress (continuation). SHORTIf the price will breaks today's low 1.37342 - the continuation diamond will be confirmed.
Atm the red line is not confirmed.
Targets:
1: 1.3645
2: 1.3490
3: 1.3420 - unclosed GAP on daily chart
-----------------------------------
This is not the financial advice.
If you liked this idea, please like and subscribe to my profile.
GL!


#BTC Diamond Pattern - #BitcoinA diamond chart formation is a rare chart pattern that looks similar to a head and shoulders pattern with a V-shaped neckline. Diamond chart reversals rarely happen at market bottoms, it most often occurs at major tops and with high-volume.
- BTC Ready For Bearish Move, MACD Bearish
- RSI in Triangle

BTC DIAMOND PATTERN FORMINGWe can see in the 4 Hour a diamond pattern forming. Lets see what happens

EURJPY - Mirroring GPB/JPY - Short at 61.8% FiboEURJPY with similar movement to GBPJPY
will EURJPY fail the double top and continue to recover? Will it make the same movment as GBP?JPY creating diamond pattern?
Eyes open for this big oportunity

Shine bright like a DIAMONDA diamond chart formation is a rare chart pattern that looks similar to a head and shoulders pattern with a V-shaped neckline. Often to be mistaken as an upcoming Head and shoulder formation.
There are a lot of similar Diamond pattern on others charts right now. Usually, diamond pattern use to work out quite often. Let´s see how it will play out. (Personally, I think there is a lot irregularities going on with xrp but scam like tether etc doesn´t stop others anyway....)
My affiliates:
Binance www.binance.com

RLong

DE30 Diamon & Double top - MACD & RSI DivergencySeveral indications to be on the short side next week.
CURRENCYCOM:DE30 CURRENCYCOM:DE30
- MACD divergency
- RSI divergency
- Diamond pattern completed
- last hours started to form a nice double top set up putting even more selling pressure on the DE30 for the following week
Strategy:
- wait for confirmation of Double Top and short. You can set positions to go long here as well as some short quick profits in case it doesnt breakt the diamond pattern
- If we see double top breakout this will trigger the diamond pattern and flag breakout on the daily aiming for a long short with nice risk reward

CAD/CHF BUY SIGNALHey tradomaniacs,
welcome to another free trade-plan.
Important: This is meant to be a preparation for you. As always we will have to wait for a breakout and confirmation.
Type: DAy-Swingtrade
Market Buy: 0,68800
Stop-loss: 0,67450
Target 1: 0,70200
Target 2: 0,71325
Target 3: 0,72185
Stop-Loss: 135 pips
Risk: 1-2%
Risk-Reward: 2,5
Notice: Waiting for breakout to buy the retest!
LEAVE A LIKE AND A COMMENT - I appreciate every support! =)
Peace and good trades
Irasor
Wanna see more? Don`t forget to follow me.
Any questions? PM me. :-)

EUR/CAD SELL SIGNALHey tradomaniacs,
welcome to another free trade-plan.
Important: This is meant to be a preparation for you. As always we will have to wait for a breakout and confirmation of this Diamond-Pattern.
Market Sell: 1,55680
Stop-loss: 1,57600
Target 1: 1,52220
Target 2: 1,51000
Target 3: 1,48900
LEAVE A LIKE AND A COMMENT - I appreciate every support! =)
Peace and good trades
Irasor
Wanna see more? Don`t forget to follow me.
Any questions? PM me. :-)

diamond pattern formation on usdcaddiamond pattern formation on usdcad it can go long way down just hold your sells and trigger the sl accordingly.on h4 its in rising wedge so you can get in accordingly


Bearish Diamond Formation in Parallel ChannelThe diamond top occurs mostly at the top of considerable uptrends. It effectively signals impending shortfalls and retracements with relative accuracy and ease.
The diamond top formation is established by first isolating an off-center head-and-shoulders formation and applying trendlines dependent on the subsequent peaks and troughs.
It gets its name from the fact that the pattern bears a striking resemblance to a four-sided diamond.

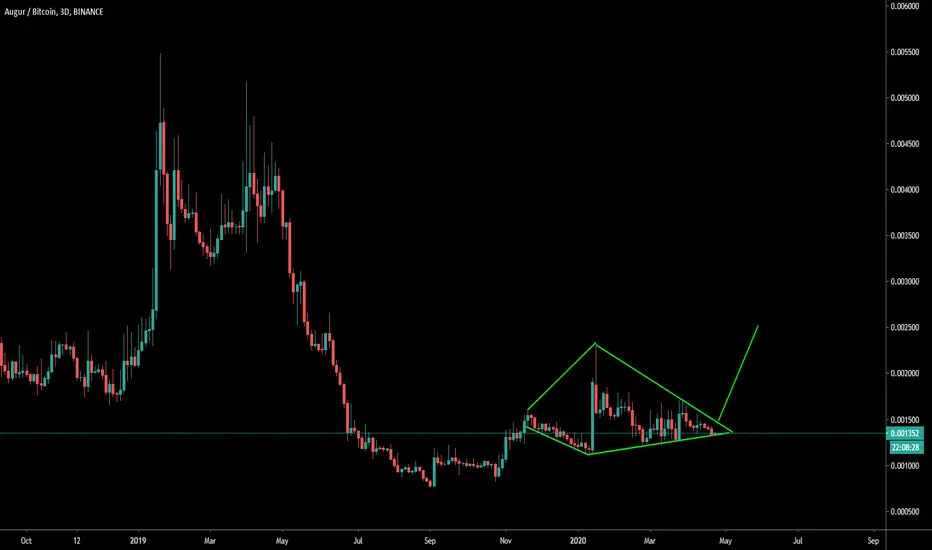
Diamond Continuation Pattern| Low volume| Bullish Continuation?Hello Traders,
Today’s chart update will on BTC’s immediate projection- we have a probable diamond formation which serves as a bullish continuation pattern.
Points to consider
- Trend travelling into apex
- .382 Fibonacci as local support
- RSI respecting trend
- Stochastics in lower regions
- Volume declining
- VPVR area being tested
BTC is closing in on its apex signalling a break from this formation is imminent as local support and resistances converge. Local support is the .382 Fibonacci; BTC has been respecting this level as buy pressure is evident.
The RSI is respecting its trend line, must hold for a bullish bias as this is in confluence with the stochastics being in lower regions. It can stay trading there for an extended period of time, however lots of stored momentum to the upside.
Volume is clearly declining; increase is highly probable upon breaking out of the Diamond formation. The VPVR confirms the .382 being a strong trade location for buy pressure.
Overall, in my opinion, a break bullish is probable as the Diamond Pattern serves as a bullish continuation pattern. BTC may have one more leg up before a proper correction as this trend is getting more extended.
What are your thoughts?
Please leave a like and comment,
And remember,
“The big ones take the psychology out of the game. Have a game plan, and stick to it.” Tim Erber

#BITCOIN Diamond Pattern. Maybe a wick before new high?Do not be a wick careful. Potential support and resistance zones are on the chart.

Bitcoin 1hr DiamondPotential diamond topping pattern on the Bitcoin 1-hour chart. Was expecting a run to $9,350 and a slight pullback this week and now it appears as though we may get the pullback going into the weekly close tomorrow. Level of support I'm watching for on any decline is $8,900(red line), as long as price remains above that level the trend should remain up.

BITCOIN | Diamond played outThe diamond I showed yesterday played out, but.....
Not to the upside as shown in the chart but to the downside.

BTC (Y20.P1.E5).MACRO.Trend.ForecastHi all,
** Note: This POST is only about the MACRO level.
> After looking at the bottom and drawing some trend lines, it occurred to me that we possibly have a "DIAMOND reversal trend" , at the Macro level.
> Beyond what most have have accepted and pretty much confirmed is that a inv. H&S took place, which is not the whole story.
> FYI I define inv. H&S as a Micro or Medium level move (just to make sure my language is with consistent meaning).
Below are some of my observations\hypothesis and the rest I leave to you to come up with your conclusions.
Enjoy.
Please give a thumbs up or a like if you agree or just appreciate the effort.
Regards,
S.Sari /CryptoProspa
I'll just put in the micro level observations to give a case for the "DIAMOND bottom formation"
At the big structure level, what we had in 2019 was a continuation pattern. A big year next year and on-wards?
(note red vertical line represents BTC halving time line)
Also not key details about macro fib. levels and their confluences.
I like this MA, which does a good representation of the segment from bearish to bullish indicator.
The RSI also has some points on supporting the bullish thesis on the daily and weekly which I wont go into.
My thoughts at the MEDIUM LEVEL with a DIAMON support structure
Supporting this post, is the PREVIOUS POST and the explanations to go with it for bottom channel trend

AUDNZD - long the diamondAnother diamond pattern, just confirming that holidays are all over the place :)
I'll start longing in green area or on breakout to upside from here with marked targets, where I'd wait for re-enter, and stop loss below previous low or even more loose because of high volatility at the moment.
Disclaimer: this idea is solely for my own purposes, to satisfy the ego, if it will work out ;)

CADCHF - Diamonds are a girl's best friendCarol Channing was singing this already in 1957. Usually this pattern means reversal and that's what I'll be tracking in the beginning of 2020 - until the end of this year there may be just fakeouts with all the holidays in place.
After a clearly defined direction there's an opportunity for basket of pips. As charted, I'll offload some parts of position at marked areas. So just on radar for the time being.
Disclaimer: this idea is solely for my own purposes, to satisfy the ego, if it will work out ;)

Pepsi bullflagPepsi is currently in a large upward channel on the weekly timeframe, on the daily timeframe a bull flag can be observed, this will lead to upsides. Other patterns include a diamond bottom reversal after a short term bearish run, a double top, and a double bottom. A great buy long term.
