DIA/USDT — Golden Pocket Battle: Accumulation or Breakdown?🔑 Key Highlights
DIA price is currently testing the Fibonacci golden pocket (0.5–0.618) range around 0.6884 – 0.6071 USDT, a highly crucial zone that will decide whether the market resumes a bullish rally or extends the bearish trend.
This area also acts as a flip level (former resistance turned potential support). If buyers defend this level, a strong bounce may follow. But if it fails, the downside risk increases significantly.
---
📌 Structure & Technical Context
Major Support (Golden Pocket): 0.6884 – 0.6071.
Confluence of Fibonacci retracement and structural support.
Key Resistances: 0.7977 → 0.8771 → 1.0187 → 1.1370 → 1.3377 (recent high).
Candle Behavior: Multiple long wicks indicate liquidity grabs and indecision.
Trend Outlook: Medium-term remains sideways-to-bearish, but momentum can shift bullish if this golden pocket holds.
---
🚀 Bullish Scenario
Confirmation: 2D candle close above 0.70 with bullish reversal signals (hammer / engulfing) + increasing volume.
Upside Targets:
Target 1: 0.7977 (+14%).
Target 2: 1.0187 (+46%).
Target 3: 1.1370 – 1.3377 (+60–90%).
Plan:
Conservative entry near 0.68–0.70 with stop below 0.60. Use ladder take profits at each resistance level.
---
⚠️ Bearish Scenario
Confirmation: 2D close below 0.6071 (golden pocket breakdown).
Downside Targets:
First support: 0.42 (~40% drop).
Deeper support: 0.2575 (~63% drop).
Plan:
Short entry on confirmed breakdown + retest. Stop loss above 0.655, target 0.42 / 0.2575.
---
📈 Risk Management Notes
2D timeframe = swing trade context (weeks to months). Avoid reacting too much to small intraday candles.
Wait for candle + volume confirmation.
Take profits gradually and use trailing stops if resistance breaks.
Always size positions according to your personal risk tolerance.
---
DIA is testing the Fibonacci golden pocket (0.688–0.607), which also acts as a key flip level. This is a decisive battleground: will it turn into accumulation for a rally toward 0.7977 → 1.0187 → 1.1370, or will it break down toward 0.42 → 0.2575?
🔵 Bullish: needs a 2D close above 0.70 with strong reversal signals. Upside targets: 0.7977 → 1.0187 → 1.1370+.
🔴 Bearish: breakdown below 0.607 opens downside toward 0.42 → 0.2575.
This zone is where buyers and sellers will decide the next big move.
⛔️ Not financial advice. For educational purposes only.
#DIA #DIAUSDT #CryptoAnalysis #SwingTrade #Fibonacci #GoldenPocket #TechnicalAnalysis #PriceAction #Crypto
DIAUSD

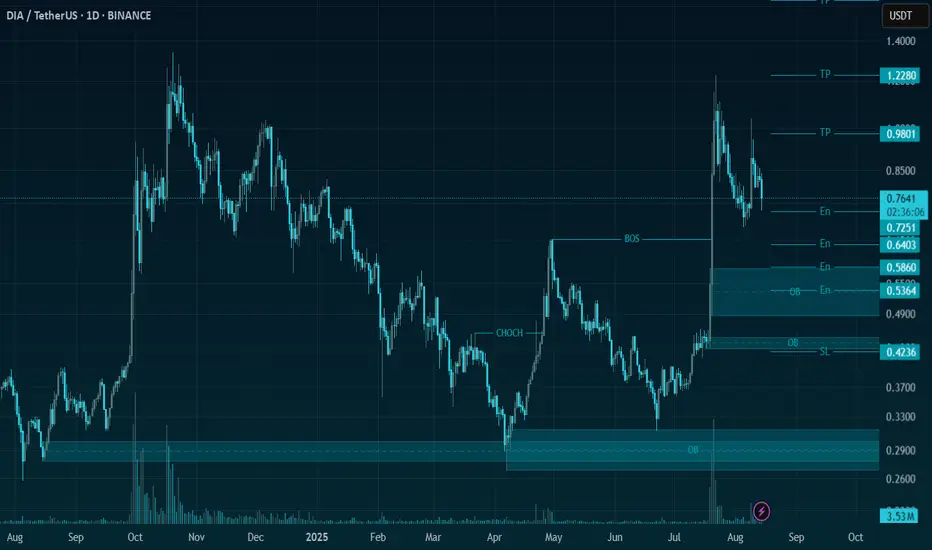
DIA/USDT | Ready for a Massive Upside🚀 Trade Setup Details:
🕯 # DIA/USDT 🔼 Buy | Long 🔼
⌛️ TimeFrame: 1D
--------------------
🛡 Risk Management:
🛡 If Your Account Balance: $1000
🛡 If Your Loss-Limit: 1%
🛡 Then Your Signal Margin: $32.23
--------------------
☄️ En1: 0.7251 (Amount: $3.22)
☄️ En2: 0.6403 (Amount: $11.28)
☄️ En3: 0.586 (Amount: $14.5)
☄️ En4: 0.5364 (Amount: $3.22)
--------------------
☄️ If All Entries Are Activated, Then:
☄️ Average.En: 0.6142 ($32.23)
--------------------
☑️ TP1: 0.9801 (+59.57%) (RR:1.92)
☑️ TP2: 1.228 (+99.93%) (RR:3.22)
☑️ TP3: 1.6356 (+166.3%) (RR:5.36)
☑️ TP4: 2.3552 (+283.46%) (RR:9.14)
☑️ TP5: 3.5225 (+473.51%) (RR:15.26)
☑️ TP6: Open 🔝
--------------------
❌ SL: 0.4236 (-31.03%) (-$10)
--------------------
💯 Maximum.Lev: 2X
⌛️ Trading Type: Swing Trading
‼️ Signal Risk: 🙂 Low-Risk! 🙂
🔎 Technical Analysis Breakdown:
This technical analysis is based on Price Action, Elliott waves, SMC (Smart Money Concepts), and ICT (Inner Circle Trader) concepts. All entry points, Target Points, and Stop Losses are calculated using professional mathematical formulas. As a result, you can have an optimal trade setup based on great risk management.
⚠️ Disclaimer:
Trading involves significant risk, and past performance does not guarantee future results. This analysis is for informational purposes only and should not be considered financial advice. Always conduct your research and trade responsibly.
💡 Stay Updated:
Like this technical analysis? Follow me for more in-depth insights, technical setups, and market updates. Let's trade smarter together!
DIAUSDT 1WDIA ~ 1W
#DIA If you still have Conviction on this coin,. buy gradually inside this support block,. with a minimum target of 20%+

DIA USDT Idea BullishBINANCE:DIAUSDT
6day timeframe chart
falling wedge can lead us to quickly 0.81 and new higher high can go to 1.16
NOT A FINANCIAL ADVISE DYOR.

DIA Coin PRICE PREDICTIONDIA Coin PRICE PREDICTION
🔥 Price on the 4H chart might come at these support area and we might get a potential bounce🔥
Potential bounce areas for Buying 0.4820 and 0.3600
👉 Follow me for more real time opportunities.
Share your Thoughts if you have any?

DIA TOKEN PRICE PREDICTIONMY DIA TOKEN PRICE PREDICTION, i am long now but i am expecting a long range before bullish

DIA with nice pump to volume resistance $1.17DIA with nice pump to volume resistance $1.17 - a bounce lower very likely.
At $0.39 we have a rejection volume support (huge dump followed by huge pump).
If price comes back this level should support.
What do you think?
Drop me a nice comment if you'd like me to analyze any other cryptocurrency.
*not financial advice
do your own research before investing

Dia is a Dia-mond? In recent weeks, there has been a significant increase in volume .
I'll be watching this volume increase at the bottom.
What do you think of Dia? Please share your comment.
* None of what i write here is not an invesment advice. Please do your own research before investing in any digital asset.
* Never take my personal opinions as investment advice, you may lose your money.

DIAUSDTDIA is repeating the fractal of last short term swing that it has before. Lets see if it repeats every step in shaa Allah or it changes something which i doubt it will change.

DIAUSDTFundamentals perfect.
Oracle based.
Launching on Coinbase soon.
Graph and Technical analysis suitable and good in btc pair as well.
Bullish on DIA
Currently underdog and low cap. It should not be that.
MINIMUM 2X Target and Take profit. ( within 1 month )
Maximum 30~50$ at peak of bull market. Q1 2022

Dia Chart SIGNAL by Sajjat Hossen #Dia 4H Chart SIGNAL by Sajjat Hossen
⚠️ Risky Call ⚠️ Because Of Bitcoin.
Entry ✅ If 4H Candle Close Above $1.94
Stop-loss ❌ If 4H Candle Close Below The $1.65
Sell Target 👉 2.25 - 2.50 - 2.75 - 2.99 - 3.25
1D Chart,,,,

🔮DIA- didn't make it last round, will it fly now?I thought I'd just re-post this as a reminder, because everything from the last months publication is still valid. BINANCE:DIAUSDT didn't make it last time. The price left the formation in a sideways movement, which at this point has turned into 2months+ of consolidation on key level/200EMA. It is safe to assume that another breakout attempt will come soon. And if it won't- well, then DIA will be of the biggest disappointments this season 🤣🤣 But it's ok, it's part of the game we're playing.
Previous post:
--------------------------
About DIA:
DIA (Decentralised Information Asset) is an open-source oracle platform that enables market actors to source, supply and share trustable data. DIA aims to be an ecosystem for open financial data in a financial smart contract ecosystem, to bring together data analysts, data providers and data users. In general, DIA provides a reliable and verifiable bridge between off-chain data from various sources and on-chain smart contracts that can be used to build a variety of financial DApps.
DIA is the governance token of the platform. It is currently based on ERC-20 Ethereum protocol.
The project was founded in 2018, while the token supply was made available to the public during the bonding curve sale from Aug. 3 through Aug. 17, 2020, where 10.2 million tokens were sold.
Source: coinmarketcap

🔮 DIA- attempting breakout soon? heavy resistanceIf you've seen my other recent posts you should probably know this setup by heart by now, as this scenario (symmetrical triangle breakout) is visible on many charts right now.
The price is attempting a breakout right now, but is being suppressed by the key level (1.84), dynamic resistance (upper trendline) and 200EMA. Once it manages to break it, we can expect it to move to the next area of resistance 2.20-2.50 (highlighted red)
Entry: average buy in the green zone (current price down to the dynamic support trendline) -- or buy at 200EMA breakout -- or buy later on a local pullback
Long-term targets:
TP1: 2.23
TP2: 2.54
TP3: 2.75
TP4: 3.48
TP5: 4.24
TP6: 5.15(~180%)
TP7: OPEN++
--------------------------
About DIA:
DIA (Decentralised Information Asset) is an open-source oracle platform that enables market actors to source, supply and share trustable data. DIA aims to be an ecosystem for open financial data in a financial smart contract ecosystem, to bring together data analysts, data providers and data users. In general, DIA provides a reliable and verifiable bridge between off-chain data from various sources and on-chain smart contracts that can be used to build a variety of financial DApps.
DIA is the governance token of the platform. It is currently based on ERC-20 Ethereum protocol.
The project was founded in 2018, while the token supply was made available to the public during the bonding curve sale from Aug. 3 through Aug. 17, 2020, where 10.2 million tokens were sold.
Source: coimarketcap

DIA's Head and shoulder pattern.Hi every one
DIA / TETHERUS
DIA has Formed a big Head and shoulder pattern. This Bearish Pattern has the chance to Decrease the price as much as the length between the Head and the Neckline! but the Price has not Broken The Neckline yet! so there is still a chance that the Bulls Take control and Increase the price once again! but If Bulls Fail we must see a Bearish Movement to the support line which is shown in the picture!
💎Traders, if you liked this idea or have your opinion on it, write in the comments, We will be glad.
Thank you for seeing idea .
Have a nice day and Good luck

DIA ready for take off soon Hi Traders,
We are looking at the 1 day graph of DIA/USDT
- A cup and handle pattern seems to be forming
- Current marketcap: 84.384.171
- Max supply: 200.000.000
What is DIA?
DIA (Decentralised Information Asset) is an open-source oracle platform that enables market actors to source , supply and share trustable data . DIA aims to be an ecosystem for open financial data in a financial smart contract ecosystem, to bring together data analysts, data providers and data users.
(This is not financial advice)
Have a good one.

Great buy opportunity in DIA🚀Hello guys
As we can see price is currently in Broadening Wedge pattern and now it trying to Pullback.
- Entry: (for long-term)
1- $4
2- $3
Exit: $8 or more as it is fundamentally strong project🔥
If you find this helpful and want more FREE forecasts in TradingView
. . . . . Please show your support back,
. . . . . . . . Hit the 👍 LIKE button,
. . . . . . . . . . . Drop some feedback below in the comment!
. . . . . . . . . . . . . . And do follow me on Twitter for EXCLUSIVE Market updates: @mywealthstory
Your Support is very much 🙏 appreciated!
Happy Trading


DIA in a bullish flag pattern $DIA - starts its trend continuation. The breakout from the bullish flag, the crossing of the RSI barrier at 48.5, the rising volume and the rising averages confirm the trend. So, the next price target at $6.36 is activated. #DIAUSD


Dia Buying Opportunity # DIA USDT 4H .......✌
♻️ Dia Now Ranging Between Support & Trend Line Resistance. Price TryingTo Make Descending Chart Pattern. Always Buy Part By Part. Don't Invest All At Once Or In Any Coin.
● Must Use Stop-Loss...
● Buy Sell At Your Own Risk...

💡 DIA/USDT💡 Hello everyone, if you like my idea, follow me with likes and comments, I will also try to share the best ideas with you, Always do your own research before opening positions and always put stop limit.

DIA/USDT a strong bullish marketDIA/USDT
According to my analysis, DIA is in an uptrend channel. so we are looking for a buy position. if you draw the descending trend line(X) in 4h chart you can see the price has broken up the trend line(X) with acceptable volumes and at this moment a clean pullback can be seen on the chart. additionally a strong support(A) is under the price that we expect buyers to come to the scene.
if a good reversal candlestick pattern such as a bullish engulfing shows up, it's a nice trigger to enter the position.
The target can be consider before reaching resistance (B).
Support(C) is a nice zone to set your stop loss.
This idea depends on the condition of the BTC and alt coins market cap. As long as the market cap is moving up smoothly and Bitcoin is in a range market or moving up slightly, this analysis is reliable.
Caution: this is not a buy or sell signal and all of the risks of trading this idea is on your own.

DIAAfter DIA had reached 3.7$, it formed the support. Now it is about to growth accompanying with volumes. DIABTC price is near its bottom.
Best regards EXCAVO
