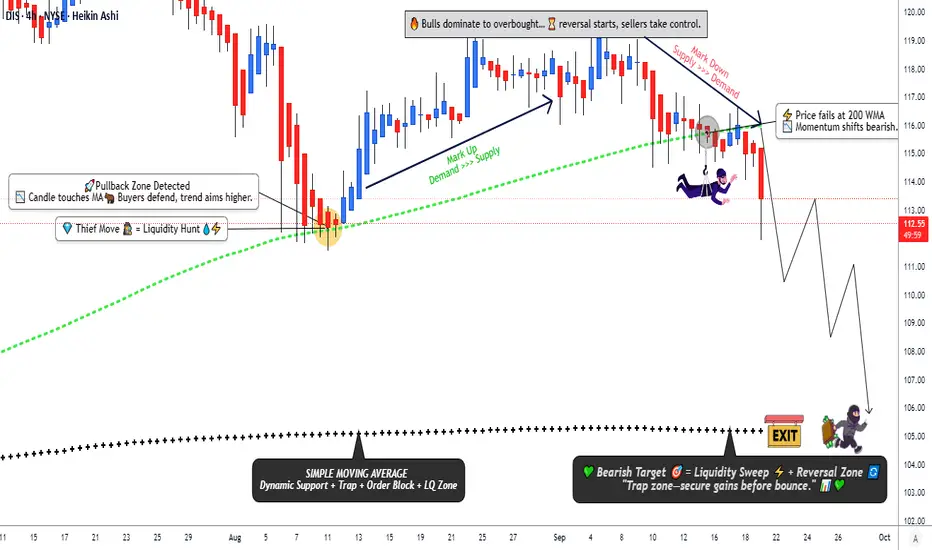
DIS Technical Breakdown – Bearish Trend Gains Momentum🎭 DIS – Walt Disney Company | Thief’s Cash Flow Management Strategy 🏰💸
Hello, Ladies & Gentlemen, welcome to the Thief OG trading crew! 😎 Ready to swipe some profits from the Walt Disney Company (DIS) stock? Let’s break down this bearish swing/day trade strategy with a sprinkle of fun and a whole lot of market swagger. 🚀 Let’s dive into the magic of cash flow management with a layered limit order approach! 🎥
📊 Asset: Walt Disney Company (DIS)
Market: NYSE
Strategy: Swing/Day Trade
Bias: Bearish 🐻
Why?: The 200-period Weighted Moving Average (WMA) has been breached by sellers, confirming a downtrend. The bears are running the show, and we’re ready to join the party! 🎉
🕵️♂️ The "Thief Strategy" Plan: Layered Limit Orders
Our Thief Strategy is all about sneaking in profits with a layered limit order approach. Think of it like setting multiple traps to catch the best entry points. 🪤 Here’s how we roll:
Entry Points: Place multiple sell limit orders to layer your entries. Suggested levels:
$116.00 📉
$115.00 📉
$114.00 📉
$113.00 📉
Pro Tip: Feel free to add more layers based on your risk appetite! Stack those entries like a master thief planning a heist. 😏
Entry Flexibility: You can enter at any price level within this range if you spot a good opportunity. Stay nimble, Thief OGs!
🛑 Stop Loss: Protect Your Loot
Thief Stop Loss: Set at $118.00. This is our safety net to keep the bears from stealing our cash! 🛡️
Note: Dear Thief OGs, this stop loss is my suggestion, but it’s your trade! Adjust based on your risk tolerance and make those profits at your own pace. 💸
🎯 Target: Cash Out Before the Trap!
Profit Target: Aim for the $105.00 level, where the 786-period Simple Moving Average (SMA) acts as strong support. 📈
Why?: This level shows oversold conditions and a potential bear trap. Escape with your profits before the market flips the script! 🏃♂️
Note: Thief OGs, this is my target, but you’re the boss of your trades. Take profits when it feels right for you! 💪
🔗 Related Pairs to Watch
To make the most of this DIS setup, keep an eye on these correlated assets (all in USD):
NASDAQ:NFLX (Netflix): As a competitor in the streaming and entertainment space, Netflix often moves in tandem with DIS. A bearish move in DIS could signal similar pressure in NFLX, especially if market sentiment sours on streaming stocks. 📺
NASDAQ:CMCSA (Comcast): Another media giant with theme park and content exposure. Watch for bearish momentum in CMCSA to confirm broader sector weakness. 🏰
AMEX:SPY (S&P 500 ETF): DIS is a major component of the S&P 500. If the broader market is bearish, it could amplify DIS’s downtrend. Keep SPY on your radar for macro context. 📊
Key Correlation Insight: DIS, NFLX, and CMCSA often react to similar catalysts like consumer spending trends, streaming subscriber growth, or theme park revenue. A bearish move in DIS could be a signal to check these pairs for shorting opportunities or confirmation of sector weakness. 🔍
⚠️ Disclaimer
This Thief Style trading strategy is just for fun and educational purposes! 😜 Trading involves risks, and I’m not a financial advisor. Always do your own research (DYOR) and trade at your own risk. Steal profits, not your peace of mind! 🕵️♂️
✨ “If you find value in my analysis, a 👍 and 🚀 boost is much appreciated — it helps me share more setups with the community!”
Hashtags:#DIS #StockMarket #SwingTrading #DayTrading #Bearish #ThiefStrategy #TechnicalAnalysis #TradingView #StockPicks #CashFlow
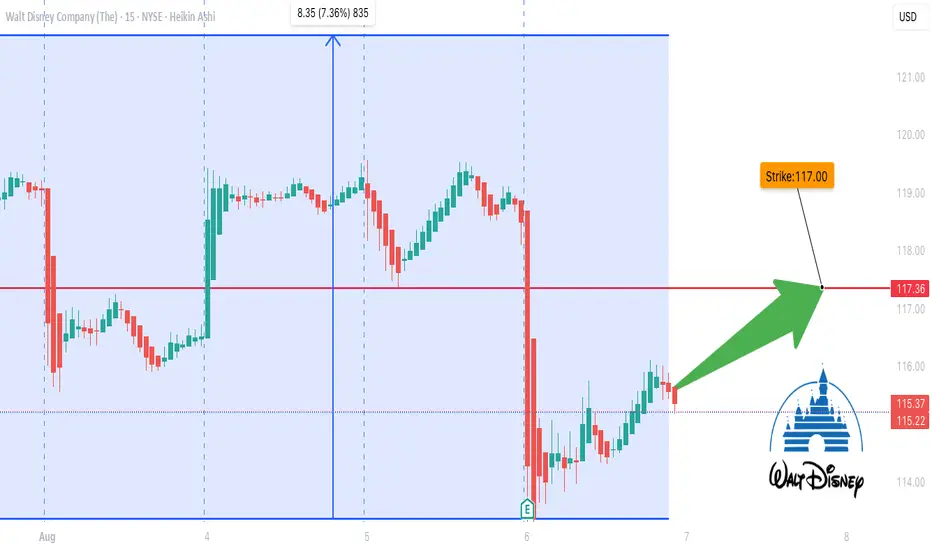
Disneycall
DIS Call Option Loading – $117 Breakout Imminent?## 🎯 DIS Weekly Call Setup – 117C by Friday? Institutions Are Betting Big! 💥
**🧠 Summary of Smart Model Consensus (2025-08-06)**
> ⚖️ *Mixed Momentum, But Bullish Flow Stands Out*
---
### 🔍 5 AI Models – Here's What They're Seeing:
**📈 Grok/xAI:**
✅ *Bullish Weekly Flow* (Call/Put ratio: 2.54)
✅ *Institutional Accumulation* on high volume
⚠️ *Daily RSI still bearish*
⚠️ *High Gamma Risk* – short expiry window
**🔻 Gemini/Google:**
🔻 *Bearish RSI across daily/weekly timeframes*
📉 *Heavy Sell Volume* = Distribution
💬 *Bullish flow might be retail noise*
**🔄 Claude/Anthropic:**
✅ *Oversold RSI* = Possible Relief Rally
✅ *High Call Flow & Favorable Volatility*
⚠️ *Momentum Weak* – proceed cautiously
**📊 LLaMA/Meta:**
⚖️ *Mixed Signals* – leaning Bullish
⚠️ *Gamma Risk* critical with only 2 DTE
📈 *Support/Resistance Levels Must Guide Entry*
**🔻 DeepSeek:**
🔻 *Weak momentum, institutional selling*
⚠️ *Contrarian Bearish Position*
🎯 Targets breakdown support
---
### 🧠 Model Consensus:
💡 *Mixed Signals* → **Cautious Bullish Bias**
✅ *Institutional Flow + Oversold RSI*
⚠️ *Gamma + RSI Risk = Manage Entry & Exit Tightly*
---
## 📈 Recommended Trade Setup:
| 🔧 | DETAILS |
| ---------------- | --------------------------- |
| 🎯 Instrument | `DIS` |
| 🎯 Direction | **CALL (LONG)** |
| 💰 Entry Price | **\$0.72** |
| 📌 Strike | **\$117.00** |
| 📅 Expiry | **Aug 8, 2025 (2 DTE)** |
| 🎯 Profit Target | \$1.25 – \$1.80 *(75–150%)* |
| 🛑 Stop Loss | \$0.36 *(50% premium)* |
| 📈 Confidence | **65%** |
| ⏰ Entry | **At Market Open** |
---
### ⚠️ Key Risks:
* 🧨 **Gamma Risk:** Volatility can cause price to explode or implode quickly
* 📉 **Bearish RSI trend** still in play – this is a **speculative short-term trade**
* 🎢 Only **2 Days to Expiry** — manage actively
---
### 🧠 Final Thoughts:
This is a **tactical high-upside, short-dated bet** on a potential bounce in \$DIS. Institutions are positioning early — retail might be late to this move. Risk tightly, but reward could be explosive.
---
**📌 TradingView Hashtags:**
`#DIS #OptionsAlert #WeeklyOptions #CallOptions #GammaSqueeze #UnusualOptionsActivity #TradingStrategy #SmartMoney #TechnicalAnalysis #SwingTrade #HighRiskHighReward #BullishFlow`
Disney is repeating previous head-shoulders reversal pattern?
My answer for the topic is yes.
Disney has broken above the downtrend line, and formed a bullish head-shoulders reversal pattern, exactly repeating the previous price action in Oct 2023.
Now it moves in a bullish channel.
personally, in a short-term, I will take the nearest resistance level (high volume area) as the target for this rally.
what's your opinion?

Disney Finding It's Place In The MarketHistorical Performance: Over the years, Disney's stock has shown long-term growth and has been considered a stable investment for many shareholders. However, it's important to note that past performance is not indicative of future results, and the stock market can be subject to fluctuations and risks.
With all of its attractions and streaming products disney will be here for a while and I do think looking at it short term it's been consolidation quite abit at these levels.
On the visible rang volume profile it shows on the 4 hr chart it show consolidation levels at 88.46 - 89.19 and 91.68 - 92.81. If disney falls under 88.46 if could possibly test 87.34 again.
It also shows point of control at $92.25. which means it there's a lot of buying pressure at that level.
It has a huge gap to fill starting at $95.10 all the way up to 96.61. That leads me up to the earnings. The cause for that drop came from a missed earnings which out of the last 6 they missed 3 and beat 3 every other one. If were being optimistic since they missed the last one they should beat this earnings coming up bases off pattern. But, Of course a lot of other things play into their financials.
Looking for a run up prior to earnings to at least mid 90s if it cant break these consolidation zone.
I do think this is more of a long term hold. Next resistance after gap fills we should see disney at the $100 levels.
Trade Responsible,
#TradeTheWave

DIS - Price Targets & Stop Loss📈 What’s up investors! 📉
Welcome back to another one of
💡“Mike’s Ideas”.💡
I post as I find signals… these signals are based on the personal rules I have built and follow in order to make up what I call the “SST Strategy”. Follow for more ideas in the future!!
I have 4 levels marked and colour coded on the Chart.
These levels are:
⚪ White = Entry Point
🔴 Red = Stop Loss
🟢 Green = 1.2:1 Risk Reward Ratio
🟡 Yellow = 1.5:1 Risk Reward Ratio
🔵 Blue = 2:1 Risk Reward Ratio
👀 So what are we looking at today…!!!
🚨( DIS ) The Walt Disney Company🚨
The Walt Disney Company, together with its subsidiaries, operates as an entertainment company worldwide. It operates through two segments, Disney Media and Entertainment Distribution; and Disney Parks, Experiences and Products. The company engages in the film and episodic television content production and distribution activities, as well as operates television networks under the ABC, Disney, ESPN, Freeform, FX, Fox, National Geographic, and Star brands; and studios that produces films under the Walt Disney Pictures, Twentieth Century Studios, Marvel, Lucasfilm, Pixar, and Searchlight Pictures banners. It also offers direct-to-consumer streaming services through Disney+, Disney+ Hotstar, ESPN+, Hulu, and Star+; sale/licensing of film and television content to third-party television and subscription video-on-demand services; theatrical, home entertainment, and music distribution services; staging and licensing of live entertainment events; and post-production services by Industrial Light & Magic and Skywalker Sound. In addition, the company operates theme parks and resorts, such as Walt Disney World Resort in Florida; Disneyland Resort in California; Disneyland Paris; Hong Kong Disneyland Resort; and Shanghai Disney Resort; Disney Cruise Line, Disney Vacation Club, National Geographic Expeditions, and Adventures by Disney, as well as Aulani, a Disney resort and spa in Hawaii. Further, it licenses its intellectual property to a third party for the operations of the Tokyo Disney Resort; provides consumer products, including licensing of trade names, characters, visual, literary, and other IP for use on merchandise, published materials, and games; operates a direct-to-home satellite distribution platform; sells branded merchandise through retail, online, and wholesale businesses; and develops and publishes books, comic books, and magazines. The Walt Disney Company was founded in 1923 and is based in Burbank, California.

Disney Could be Bottoming TodayHitting trendline support from 1998, hitting a trendline that also marked the March 2020 bottom. Lines up with my outlook that equities, housing and crypto have bottomed if it holds.

Disney should enter Powerful Wave 3 here - Targeting 300's Something big coming to Disney here I think. At a great retracement, capitulation selling, diagonal support. Looks like a clear wave 2 down off the March 2020 lows, ignore the news this should get to 300's.

DISNEY! - head and shoulder formationPossible SHS formation. Maybe there is an 8% bullish bounce to form the symmetry of the right shoulder and then

DIS ER Run Up!$DIS 4HR Chart ...
FA & TA
After a stunning growth in Disney's Disney+ subscription, surpassing just over 100 Million subscribers from its 2019 launch, what more does Disney have in-store? It is evident with vaccines rolling out and states changing public health & safety mandates, people are itching to get out and enjoy in-person activities. This has caused streaming services to take a hit, such as $NFLX as they only harbored nearly 4 million subscribers (2 million less than expected). Luckily for Disney investors, we can hope to see some positive insight with Disney Parks and Cruises. Although cruises are still halted, some parks have been open with Covid restrictions, so perhaps this may the first step on the track to profitability. For potential new investors, the current price may be less attractive due to it still being near ATHs, so it's possible we see some selling pressure to see 158-170 price levels (discount, BUY!) for long term buyers to flourish in. It would be wise to sit sideline and let this upcoming earnings give some direction... Now, DIS has been consolidating within a price range of 178-191 for the past month and with earnings coming up this can potentially see some strength to breakout the current descending triangle. Over 190.50 would indicate some strength and a reversal to retest ATH. However, there is still some downtrend resistance to clear, so we could see a rejection/ false breakout over that resistance line (orange) and head down to 178.70-179 level. Under 178 would invalidate this idea.
Initial Entry: 185
Breakout Entry: 190.50
Target: 195+
Contract Ideas DT/ SW
DIS 185C 5/14| 5/21
DIS 190C 5/21
DIS 195C 5/21


WALT DISNEY COMPANY SHORT📉 NYSE:DIS SHORT H4
🛒SELL BELOW = 120.70
🎯Target1 = 116.45
🎯Target2 = 113.80
🎯Target3 = 109.60
🛑Stop loss or cancel trade = 127.60
🙈Recommended risk = (2%-3%)
#DIS #DISSHORT #SELLDIS

Walt Disney prediction till 2021 year by Powerful TradersHello everyone!
Traders we do not like to write more.
The prediction of the price you can find on a chart!
Regards, Team Traders "Powerful Traders"

WALT DISNEY COMPANY (DIS) Weekly, MonthlyDates in the future with the greatest probability for a price high or price low.
The Djinn Predictive Indicators are simple mathematical equations. Once an equation is given to Siri the algorithm provides the future price swing date. Djinn Indicators work on all charts, for any asset category and in all time frames. Occasionally a Djinn Predictive Indicator will miss its prediction date by one candlestick. If multiple Djinn prediction dates are missed and are plowed through by same color Henikin Ashi candles the asset is being "reset". The "reset" is complete when Henikin Ashi candles are back in sync with Djinn price high or low prediction dates.
One way the Djinn Indicator is used to enter and exit trades:
For best results trade in the direction of the trend.
The Linear Regression channel is used to determine trend direction. The Linear Regression is set at 2 -2 30.
When a green Henikin Ashi candle intersects with the linear regression upper deviation line (green line) and both indicators intersect with a Djinn prediction date a sell is triggered.
When a red Henikin Ashi candle intersects with the linear regression lower deviation line (red line) and both indicators intersect with a Djinn prediction date a buy is triggered.
This trading strategy works on daily, weekly and Monthly Djinn Predictive charts.
Trades made when the monthly and weekly arrows are pointing in the same direction are the most profitable.
This is not trading advice. Trade at your own risk.


WALT DISNEY COMPANY (DIS) WeeklyDates in the future with the highest probability for price direction reversals

Disney Linear Regression AnalysisStrong linear regression trend, a small drawdown for DIS following earnings would still leave it in a healthy place for sustained growth. Higher lows can be observed which has prop'd the price up to this point.

Go Long at Breakout Disney. $DISGo Long, if the stock price at the break of resistance (the green line).
Price target highlighted in the red box.
The 50 moving average can act as stop loss.
