DOGE/USDT: Defending the High-Time-Frame Support ClusterThe Macro Context DOGE/USDT is currently interacting with a High-Confluence HTF (High Time Frame) Support Cluster on the Daily timeframe. After a period of corrective price action, the asset has entered a stabilization phase within a historical demand zone. This area has previously acted as a springboard for liquidity absorption and trend reversals.
Why this setup is on our radar:
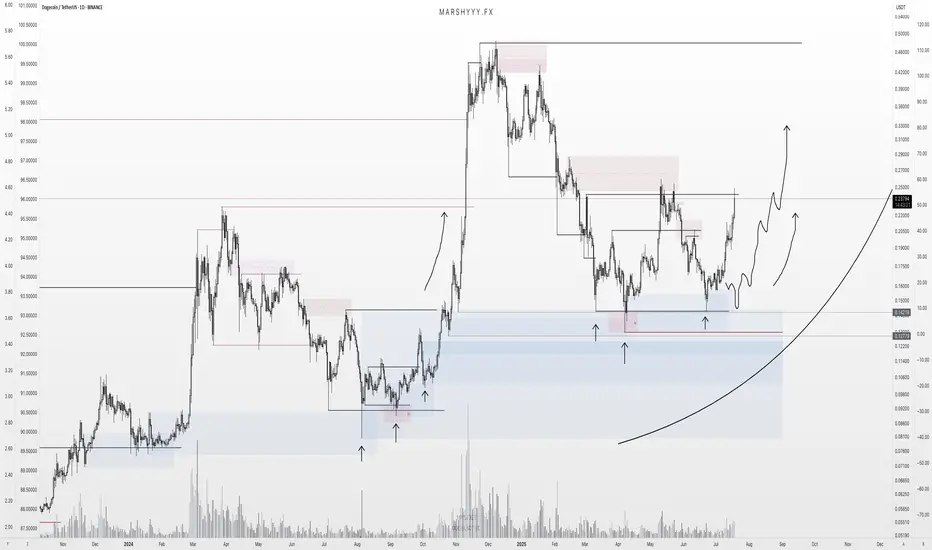
Support Cluster Defense: The chart highlights a well-defined demand block where buyers have consistently stepped in. The price is currently testing the lower boundary of this zone, providing a logical area for risk-defined entries.
Volatility Compression: We are observing a decrease in selling momentum as price approaches the 0.117 - 0.120 region. This compression often precedes an expansion phase as the market seeks new liquidity.
Market Structure: While the immediate trend has been corrective, the ability to hold this HTF floor suggests that the broader accumulation structure remains intact. We are looking for a "Spring" or higher-low formation to confirm the reversal.
Technical Levels & Plan:
Accumulation Zone: We are watching the 0.120 - 0.125 region for structural stabilization.
Invalidation Level: The bullish thesis is strictly contingent on holding this support cluster. A Daily close below the swing low (~0.1139) would signal a breakdown of the HTF structure and invalidate the setup.
Structural Resistance (Targets): Short Term: 0.130 - 0.135 (Immediate Reclaim) Mid Term: 0.145 - 0.150 (Range Highs)
Macro / Moonbag: If momentum reclaims the 0.150 level, we look toward 0.160+ and a challenge of yearly highs.
Risological Note: We are trading the "reaction" at support, not the prediction. A bounce here validates the level; a slice through it invalidates the trade immediately.
Disclaimer: This analysis is for educational purposes only. Crypto assets are highly volatile. This is not financial advice.
Check my trading setup: Links below.
Dogeanalysis

Doge and a BIG rise!Hi!
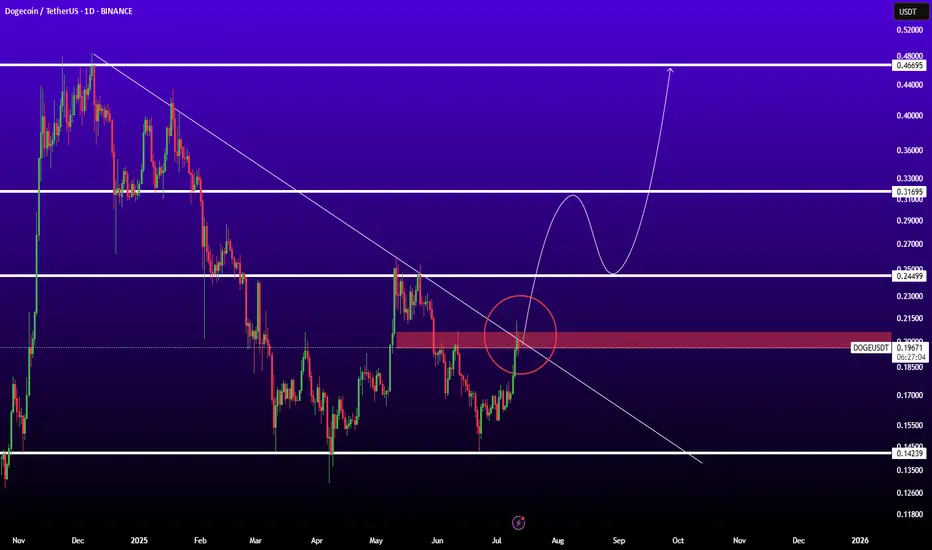
As shown on the chart, DOGE has clearly broken above the long-term descending trendline, which had been acting as resistance for several weeks. Following this breakout, price moved higher and confirmed the shift in market structure.
Importantly, the breakout was supported by a strong bullish engulfing move, taking out the previous local high. This price action strengthens the case for a trend reversal rather than a simple relief bounce.
After the impulsive move up, DOGE is now pulling back toward a key demand zone around $0.11–$0.13, which aligns with prior structure support and the breakout retest area. This zone offers a favorable risk-to-reward opportunity for long positions.
As long as price holds above this support, the upside target remains around $0.17, which corresponds to the next major resistance level and the projected move from the breakout.

DOGE Analysis (1D)Dogecoin has entered the correction phase from the point we marked on the chart.
Based on the structure, an ABC pattern has been identified on the chart, and after wave C is completed, we expect retracement movements to the upside.
Wave C still needs more time to complete, and it is expected to finish between the two vertical time lines drawn on the chart.
Within the time lines and the green zone, one can consider buy/long positions.
As long as wave C has not finished, buying is not wise
For risk management, please don't forget stop loss and capital management
When we reach the first target, save some profit and then change the stop to entry
Comment if you have any questions
Thank You

DOGE/USDT: Consolidation Resolves LowerHi!
Market Structure:
Dogecoin remains in a well-defined descending channel, confirming a sustained bearish trend. Price continues to print lower highs and lower lows, indicating that sellers are still in control on the 4H timeframe.
Pattern Development:
Within the channel, price consolidated into a bearish rectangle, which typically acts as a continuation pattern. The breakdown from this range aligns with the dominant downtrend and reinforces the bearish bias rather than signaling accumulation.
Trend & Momentum:
Repeated rejections from the upper channel boundary and the median line show weak bullish follow-through. Each corrective bounce has been sold aggressively, suggesting distribution rather than reversal.
Key Levels:
Resistance: Upper channel/rectangle top
Support: Channel lower boundary near 0.117–0.118
As long as DOGE trades below the descending channel resistance, downside pressure remains dominant. A continuation toward the lower channel support is favored. Only a confirmed breakout above the channel would neutralize the bearish structure.

DOGEUSDT Analysis: Bearish Continuation with Potential ReversalDOGEUSDT 30-Minute Chart Analysis: Bearish Continuation with Potential Reversal Signals
DOGE/USDT pair on Binance in a 30-minute timeframe. It captures price action from December 6 to a projected view into December 9, focusing on recent volatility in Dogecoin (DOGE) against Tether (USDT). At the time of the snapshot, the price is quoted at 0.13936 USDT, down 0.0012 (or -0.9%) from the previous close, with a trading volume of 1.98 million units. The chart uses standard candlestick representation (red for bearish candles, green for bullish), overlaid with trendlines, support/resistance zones, and custom annotations to highlight potential trading setups.
The overall theme appears to be a bearish downtrend with signs of exhaustion, possibly setting up for a "fakeout" move followed by a reversal. I'll break this down in detail below, structured like a TradingView Idea post for clarity, including key sections for analysis, trade ideas, and insights.
Chart Overview
The chart spans multiple days (December 6 to 9), with the x-axis labeled in 6-hour intervals starting from 06:00 on December 6. The y-axis shows price levels in USDT, ranging from approximately 0.13650 at the bottom to 0.14250 at the top, with key levels marked like 0.13936 (ask price in red) and 0.13900 (bid in gray).
Candlestick Pattern: The left side shows a sharp downward impulse with a large red candle, indicating strong selling pressure, likely from a breakdown below a previous support. This is followed by a period of consolidation with smaller, choppy candles (mix of red and green), suggesting indecision. Toward the center-right, there's another cluster of red candles, pushing prices lower, but with diminishing volume implied by smaller wicks.
Trendline: A prominent descending trendline (sloping downward from left to right) connects multiple high points, acting as dynamic resistance. This line starts from the initial high around 0.14200 and trends lower, touching subsequent peaks.
Annotations and Zones:
"Retesting" Zone: A horizontal green box labeled "Retesting" is placed near the trendline around 0.14100–0.14200. This suggests the price is retesting the underside of the broken trendline or a former support level, a common setup in technical analysis where old support becomes new resistance.
"First Move Fake Then Reversal" Label: Positioned at the bottom left near a low point around 0.13800, this indicates a potential "fakeout" – a brief move in one direction (likely downward) to trap traders, followed by a reversal (potentially upward). A purple lightning bolt icon below emphasizes a high-impact event or turning point.
"PER NEED" Zone: A lower green box labeled "PER NEED" (possibly a typo or abbreviation for "Perfect Need" or "Per Need" in a trading context, like "perceived need" for liquidity) is drawn around 0.13750–0.13850. This could highlight a demand zone where buyers might step in, or a level of "need" for price to fill orders before reversing.
Projection Lines: Diagonal lines extend rightward from current price action into December 8–9, suggesting forecasted paths. One line points upward from a low, implying a bullish reversal, while the trendline continues downward.
The chart's title, "#DOGEUSDT 30 Mints Analysis" (likely "30 Mins" for minutes), hints at a short-term scalping or intraday focus, common for crypto pairs like DOGE/USDT, which are known for high volatility driven by social media hype, meme trends, and market sentiment.
Technical Analysis Breakdown
Diving deeper into the indicators and patterns:
Downtrend Confirmation: The series of lower highs and lower lows aligns with the descending trendline, confirming a bearish channel. The initial large red candle on December 6 (around 18:00) represents a breakdown, possibly triggered by broader market news or DOGE-specific events (e.g., Elon Musk tweets or crypto market dumps). Volume (1.98M) supports this, though not explicitly charted – higher volume on down moves strengthens the bearish bias.
Support and Resistance Levels:
Resistance: The trendline at ~0.14050–0.14150, where "Retesting" is occurring. A break above could invalidate the downtrend.
Support: Bottom levels around 0.13800 (near "First Move Fake Then Reversal") and 0.13700 ("PER NEED"). These are potential bounce zones, perhaps Fibonacci retracements or psychological round numbers.
Key Prices Marked: Ask at 0.13936 (red) and bid at 0.13900 (gray), showing tight spreads typical in liquid Binance pairs.
Potential Patterns:
Descending Wedge or Channel: The narrowing price action toward the right suggests a wedge formation, often bullish if it breaks upward. The "Retesting" label implies price is probing the upper boundary before a possible squeeze.
Fakeout Setup: The "First Move Fake Then Reversal" annotation points to a classic liquidity grab – price dips below support to stop out longs, then reverses. This is common in crypto, where whales manipulate thin order books.
Reversal Indicators: The small green candles at lows and the upward-projecting line suggest bullish divergence (if RSI were shown, it might confirm). The lightning bolt could symbolize a "shock" event like news catalyzing the reversal.
Timeframe Context: On a 30-min chart, this captures intraday swings, but aligns with DOGE's broader 2025 trends – assuming continued meme coin volatility amid potential regulatory news or adoption (e.g., Dogecoin payments on X platform).
Trade Idea: Bearish Continuation vs. Bullish Reversal
Based on the chart's annotations, here's a balanced trade setup:
Bearish Scenario (Continuation): If price fails the "Retesting" and breaks below 0.13800, target lower supports at 0.13650. Entry: Short below 0.13900. Stop Loss: Above trendline at 0.14100. Take Profit: 0.13700 or lower. Risk-Reward: 1:2. This plays the downtrend's momentum, with the fake move being a trap for bulls.
Bullish Scenario (Reversal): If the "First Move Fake Then Reversal" plays out, buy on a bounce from "PER NEED" zone (0.13750). Entry: Long above 0.13950. Stop Loss: Below 0.13700. Take Profit: Retest high at 0.14200 or higher. This anticipates the fakeout exhausting sellers, leading to a short squeeze.
Risk Management: Use 1-2% account risk per trade. Monitor volume for confirmation – fading volume on downs could signal reversal. Consider external factors like BTC correlation (DOGE often follows Bitcoin) or social sentiment on X.
Key Insights and Mindsets for Traders
To wrap up with practical "minds" (mindsets or key takeaways), inspired by TradingView community wisdom:
Mindset 1: Patience in Trends: Don't fight the descending trendline – wait for confirmation. As the chart shows, retests often precede big moves.
Mindset 2: Beware Fakeouts: The "First Move Fake" label reminds us crypto loves traps. Always use multiple timeframes (e.g., check 1H or 4H for alignment) to avoid getting shaken out.
Mindset 3: Zone Trading Over Exact Levels: Focus on boxes like "PER NEED" rather than pinpoint prices. These represent liquidity pools where smart money accumulates.
Mindset 4: Projection Caution: The forward lines into Dec 8-9 are speculative – use them as guides, not guarantees. Combine with fundamentals like DOGE's community-driven pumps.
This analysis assumes standard technical principles; always DYOR (Do Your Own Research) and consider market conditions on December 7, 2025. If you're posting this as a TradingView Idea, use hashtags like #DOGE #Crypto #TechnicalAnalysis for visibility!

DOGEUSDT - Only One Scenario Left: UP After a long and painful correction, Dogecoin has finally put in what looks like a major bottom.
The downside momentum is completely exhausted, volume is drying up on the lows, and the structure is forming higher lows — all classic signs that the bear phase is done.
I no longer see any realistic bearish scenario here.
For me, there is only one direction from current levels: UP.
Bullish targets (open-ended):
1. 0.16 – 0.162 (first serious resistance)
2. 0.173+ (next major zone)
3. 0.185+ in case of real FOMO
❌Invalidation:
Only a hourly close below $0.1483 would make me reconsider the bullish bias.
Risk: Always use proper risk management!
⚠️ Disclaimer: This is not financial advice. This is just my personal technical view. Trading carries high risk — DYOR and trade at your own responsibility.
If you agree that Dogecoin is ready to run — smash that LIKE button! 🔥
Follow for more crypto calls!
Comment below: which coin should I analyse next? 👇

Dogecoin Forming a Macro Cup & HandleHi!
Dogecoin is developing a clear macro Cup & Handle structure, formed over several years. After the strong pole & flag rally that initiated the 2021 bull market, price spent multiple years rounding out a large cup, signaling long-term accumulation.
Price is now moving inside a descending handle, which is typical before a major breakout. A clean move above the handle’s upper trendline would confirm a continuation of the macro bullish structure.
If the handle breakout is validated, DOGE could potentially enter a multi-year expansion phase aiming toward this upper target.
The target of these patterns is around $2.80–$4.00, based on the full cup-and-handle measured move and the strength of the previous pole.

DOGE Looks Bearish (1D)We tried to show the waves from a larger perspective so you can have a better understanding of the path.
It seems that wave "B" of the higher-degree correction has been completed (wave B was a bullish phase), and now we are entering wave "C", which is bearish at a higher degree.
With the price pulling back toward the red zone, we can look for sell/short positions.
On the chart, there is a liquidity pool marked with "$$$", and the first target of this bearish move is to sweep that liquidity pool.
A daily candle closing above the invalidation level will invalidate this analysis.
For risk management, please don't forget stop loss and capital management
When we reach the first target, save some profit and then change the stop to entry
Comment if you have any questions
Thank You

DOGEUSDTBINANCE:DOGEUSDT is bear-trend but come to key level for reaction. This level is back to base latest bull trend.
Supports: 0.22 - 0.20 - 0.19
Resistance's: 0.234 - 0.256 - 0.28 - 0.31
⚠️ Please control risk management.

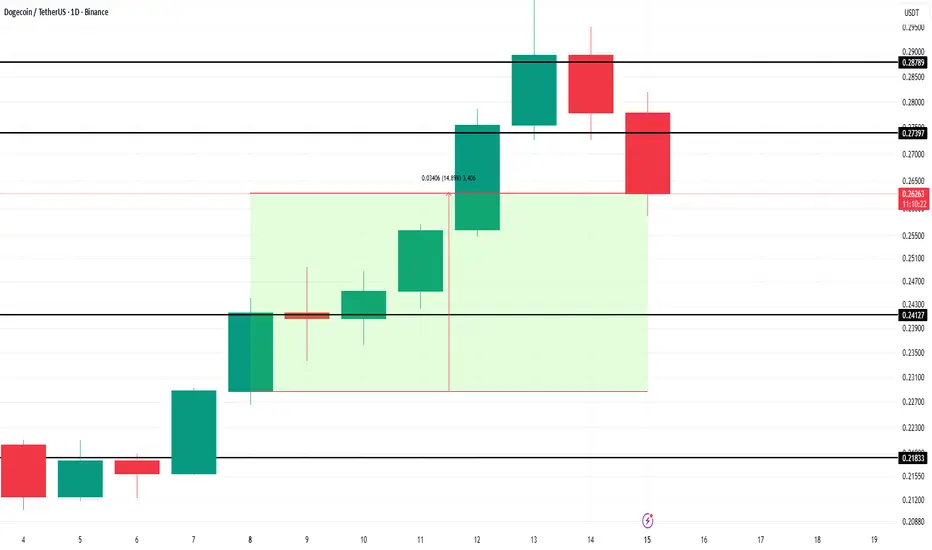
3 Meme Coins To Watch In The Second Week Of SeptemberDogecoin price is trading at $0.262 after slipping below the $0.273 support level. Despite this decline, the meme coin leader continues to flash bullish cues, suggesting momentum could still favor recovery. Investors remain focused on whether DOGE can reclaim lost ground and restart its upward trajectory.
The 50-day EMA is diverging upward from the 200-day EMA, a signal of strengthening bullish momentum. This technical pattern often precedes price rebounds. If momentum holds, Dogecoin could reclaim $0.273 as support and push higher toward the $0.287 resistance, attracting stronger investor confidence in the short term.
However, risks remain if DOGE holders decide to offload their positions. Profit-taking could weigh heavily on the token, driving its price lower. In that scenario, Dogecoin could fall toward the $0.241 support level, invalidating the bullish thesis and potentially sparking further downside pressure.
DOGEUSDTBINANCE:DOGEUSDT is now trading-renge in 0.2240$ resistance and 0.20800$ support.
I wait do to break any support and resistance for buy or sell.
Best support: 0.19100
Best resistance: 0.2450 - 0.26560 - 0.28200
⚠️ Please control risk management.

DOGECOIN Looks Bearish (1D)It seems that Dogecoin is preparing for another decline. A bearish trendline has formed, and the candles are moving below this trendline.
Based on the ABC structure, it appears that Dogecoin is pulling back into the red zone to gather more sell orders for a deeper drop.
It is expected that upon touching the red box, the price will move toward lower levels.
The targets are marked on the chart.
A daily candle close above the invalidation level will invalidate this analysis.
For risk management, please don't forget stop loss and capital management
When we reach the first target, save some profit and then change the stop to entry
Comment if you have any questions
Thank You

2 Billion DOGE Accumulation Triggers Golden Cross For Dogecoin At the time of writing, BINANCE:DOGEUSDT is trading at $0.246 , having recently broken through the $0.241 resistance level. To sustain its upward movement, Dogecoin needs to convert this level into solid support. If it manages to hold above $0.241, it will likely continue rising, with $0.273 acting as the next major resistance point.
The accumulation of BINANCE:DOGEUSDT by whales is expected to drive the price towards the $0.273 resistance level. Dogecoin whales have been a significant driver of the recent price movement, showing bullish sentiment since the start of the month.
In the past week, addresses holding between 100 million and 1 billion DOGE have accumulated more than 2 billion BINANCE:DOGEUSDT , worth approximately $500 million .
If the Golden Cross continues to signal bullish momentum, BINANCE:DOGEUSDT price could surpass this resistance and continue rising.
However, if the bullish momentum fails to strengthen, BINANCE:DOGEUSDT may experience consolidation between the $0.241 and $0.218 levels . This scenario would indicate a weakening of market confidence, causing a temporary price pullback. Should this occur, the bullish outlook would be invalidated, and further losses may follow.

Will DOGE/USDT Be Our Next Bullish Jackpot? 🚀 DOGE/USDT – Bullish Crypto Heist Plan 🐕💰 | Thief Trader Style 🔥
💎 Asset: DOGE/USDT “DogeCoin vs Tether”
📜 Plan: Bullish Heist — Layering Strategy Entries
🎯 Target: 0.2800
🛑 Stop Loss: 0.2100
💥 Attention Money Bandits & Crypto Robbers! 💥
The vault door is open, and DOGE is sitting there wagging its tail, guarding bags of Tether 💼🐕💵. This is the perfect Thief Trader moment — we’re moving in long and stacking up our loot using multiple buy limit orders at juicy price levels.
📈 Entry Point:
Swipe in anywhere you catch the dip — but we prefer loading up in layers to trap more coins without spooking the guards (market makers). Keep your alerts armed and ready.
🛑 Stop Loss:
Our getaway car waits at 0.2100 — if the heist goes south, we vanish without a scratch. Position size and order count? That’s on you, partner.
🎯 Target Zone:
The prize vault is at 0.2800 — cash out, count your loot, and treat yourself like the legend you are.
⚡ Scalper’s Note:
Only rob this vault from the bullish side. If you’ve got deep pockets, go all-in quick. If not, swing trade it with patience — just trail your SL so no guard catches you.
📢 Thief Intel Briefing:
DOGE is riding bullish sentiment, driven by market momentum, speculative inflow, and the “meme power” effect. Fundamentals, on-chain flow, sentiment — all pointing north. 🧭🚀
⚠️ Robbery Protocol During News Events:
Avoid jumping in exactly at high-impact news time — too much chaos in the vault.
Protect your running loot with trailing SL.
Be alert for fakeouts — guards love to lure greedy robbers.
💖 If this heist plan makes you smile (and money), hit that Boost button to keep our robbery crew strong. Together, we take what’s ours — every single day. 🏴☠️💎🚀

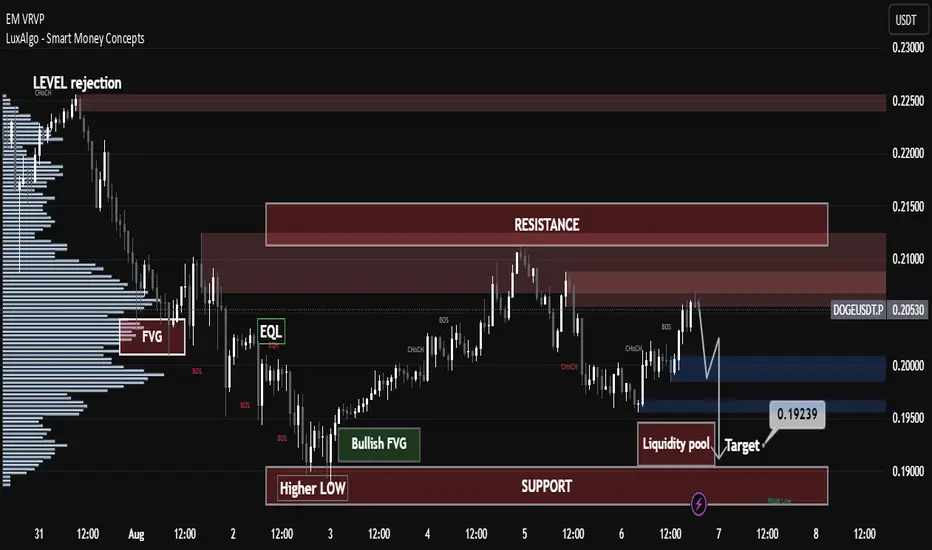
IS DOGE Losing Steam or Gearing Up? Pro-Level Market Structure IS DOGE Losing Steam or Gearing Up? Pro-Level Market Structure
📊 Technical & Trend Analysis
Current Price & Structure:
DOGE is trading around $0.2058 and has recently fallen below both the ascending trendline since late June and the 50‑day EMA (~$0.20), signaling weakening momentum
Resistance & Support Levels:
Major Resistance: ~$0.21–$0.212 — price has repeatedly failed at this zone, forming a possible bearish flag or resistance trap
X (formerly Twitter)
+15
Mitrade
+15
Cryptonary
+15
.
Support Zones: Key levels around $0.196 and $0.18, breach of these may open path to $0.15 or lower short-term
Mitrade
.
Trading Sentiment & Derivatives:
Rising short interest and negative funding rates in futures suggest growing bearish sentiment among traders. Long-short ratio is near 0.86—indicating more shorts than longs
Binance
+1
.
🎓 Technical Setup Summary (Educational Breakdown)
Chart Pattern: Potential bearish continuation forming with flag or descending consolidation after breakdown.
Momentum Indicators: Weak RSI and MACD below zero typically align with this structure—though check live chart from platforms like TradingView or Investing.com
Investing.com
.
Trade Selection Approach:
Short Trade Setup: Wait for confirmation below $0.196 to test trend continuation toward $0.18 or $0.15. Stop-loss above $0.202–$0.205.
Long Trade Setup: If DOGE reclaims $0.21 with volume and breaks above the broken trendline + 50‑day EMA, potential rebound toward ~$0.225 or higher. Stop-loss below $0.20.
🔮 Forecast & Outlook
Short-Term: Likely consolidation or correction toward $0.18 unless bullish momentum resumes. Analysts eye potential targets around $0.199–0.215 in early August, rising maybe toward $0.232 by mid-August if sentiment snaps back
Binance
+2
Indiatimes
+2
Indiatimes
.
Medium to Long-Term:
Some speculative projections place DOGE near $1 by year-end, driven by hype cycles, meme coin revival, celebrity tweets, and ETF optimism. That being said, DOGE’s unlimited supply makes $1 an aggressive target requiring massive capital inflow
Crypto News
+5
Wikipedia
+5
Indiatimes
+5
.
✅ Key Takeaways for Traders & Learners
Concept Insight
Support/Resistance $0.196–$0.18 = bearish supports; $0.21 = strong resistance zone
Trendline & EMA Breaking below trendline/50‑day EMA signals weakening structure
Volume & Funding Increasing shorts and low funding rates hint at bearish pressure
Risk Management Use proper stop-loss zones ($0.196 for shorts, $0.20 for longs)
Catalysts to Watch Whale accumulation, meme hype, ETF news, celebrity endorsements
🚨 Risks & Important Considerations
Volatility & Pump Risks: MEME coins like DOGE are susceptible to pump-and-dump dynamics and social-media driven surges or dumps
Indiatimes
Binance
+1
.
Inflationary Drag: Without a supply cap, DOGE’s price is diluted by thousands of coins mined daily, limiting long-term upward momentum unless demand rises significantly.
Macro Events: Broader economic shocks—such as U.S. tariffs or regulation changes—can rapidly swing sentiment across crypto markets. Recent U.S. tariffs pulled DOGE down ~8% with Bitcoin and Ethereum
Wikipedia
.
🧭 Final Summary
Current Bias: Slightly bearish-to-neutral—downward pressure from technical breakdowns.
Watch Closely: $0.196 support and $0.21–$0.212 resistance; reclaiming one of these defines short-term bias.
Strategy:
Consider short plays below $0.196 toward $0.18.
Consider long plays only after strong breakout above $0.21–$0.212.
Always apply strict risk controls.
—
DOGEUSDTBINANCE:DOGEUSDT is in good level for pump because if breaked trendline and resistance 0.200$ ready for sharp movement to next levels.
Resistances: 0.25 - 0.32 - 0.45
Support: 0.15
DOGE/BTC: HTF Retest Complete — Reversal BrewingDiving into DOGE/BTC, we’re seeing strong bullish confluences that align well with the DOGE/USDT structure and support the idea that the macro low is in.
Looking back across all available data, DOGE/BTC has traded within a clear 7-year accumulation range dating back to 2014, bounded by a defined range high resistance and range low support. This long period of consolidation enabled massive accumulation, ultimately leading to the first breakout in 2021, which rejected at the highs, pulled back, and then exploded into a cycle ATH.
Since that 2021 high, DOGE/BTC has been in a 4-year downtrend, retracing back into discount pricing, right into the range high of that original accumulation zone — which now acts as a major HTF demand level and last point of support before the original breakout.
📉 What’s happened recently?
- Price swept 2024 swing lows (SSL)
- Tagged the HTF demand zone
- Retested the 2021 breakout level (accumulation range high)
- Coiling inside a descending wedge with contracting volatility
This entire region is a key reversal zone from both a structural and psychological standpoint. It’s where we typically see major trend shifts form, and the structure suggests we’re forming a HTF swing low and bottom from this area.
🧠 Add this to the confluence from DOGE/USDT — which also appears to have printed its bottom — and the case for a macro reversal gets even stronger.
As this wedge tightens and price continues to compress against long-term support, I’m anticipating an explosive breakout that kickstarts the next leg of the HTF uptrend — effectively a continuation of the original breakout from the 7-year range.
5D:

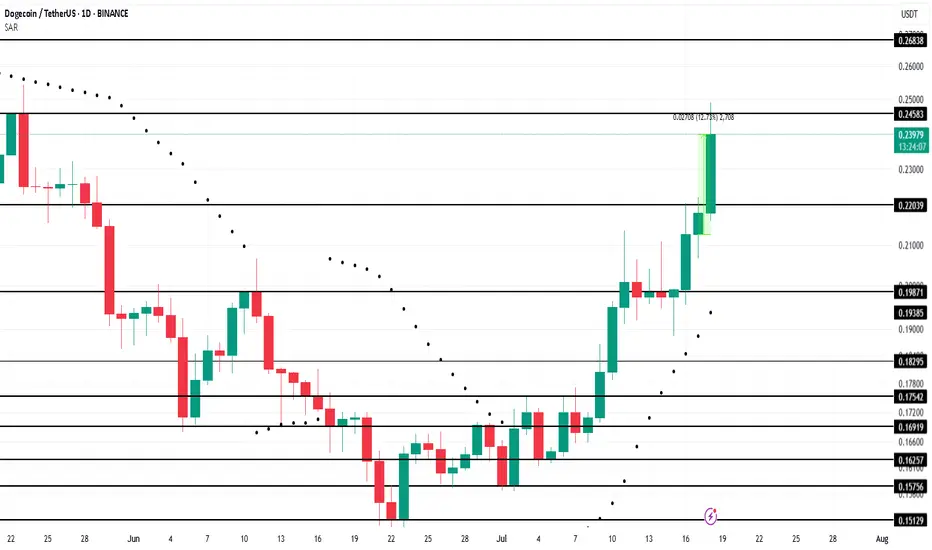
Dogecoin Leads Meme Coins With 12% Rally In 24 HoursBINANCE:DOGEUSDT , the leader of meme coins, surged 12% over the last 24 hours , reaching $0.239. This rally has positively impacted other meme tokens, showcasing DOGE’s influence within the market.
Currently facing resistance at $0.245, BINANCE:DOGEUSDT has reached a 2-month high . The Parabolic SAR below the candlesticks signals that DOGE is likely to maintain its upward trend in the coming days. If this support holds, the meme coin could continue pushing towards higher price levels, attracting more buyers and momentum.
However, meme coins are volatile. If BINANCE:DOGEUSDT holders decide to cash out their profits, the price could drop back down to $0.220 . Losing this support would invalidate the bullish outlook, signaling a possible downturn for the altcoin in the short term.
DOGE Update: Reversal Playing Out — $1+ in Sight?DOGE is playing out almost exactly as forecast back on June 14th, where I was monitoring for price to sweep the SSL and tap into range low demand within this larger HTF range.
Price did exactly that — pushing into discount, tagging the marked demand zone, and bottoming out right where I expected the reversal. I DCA’d hard at $0.165 after the initial low printed — just as planned.
Now sitting around +50% on those buys, and my plan remains to ride this out toward the ATH at $0.74 and potentially $1+.
The HTF closes forming here — across 3D, 4D, 5D, 6D candles — are showing clear strength. For me, the low is likely in, and I’m expecting new higher highs and ATHs from here. Now it’s just about letting the market do its thing, trailing stops, and taking profits into strength as alerts and targets get hit.
Zooming way out — I’m also watching DOGE’s 10-year uptrend channel. Price has once again tagged the lower bound of that channel, and historically, this has led to moves back to the channel highs.
🧠 Layer on a fib projection from the previous ATH to the bear market low, and we get:
1.272 Fib → ~$1.54
1.618 Fib → ~$3.92
Both of which align perfectly with the upper bounds of that long-term trend channel — giving us a key HTF reversal zone to monitor in the future.
In summary:
- Reversal from demand ✅
- DCA filled ✅
- HLs printing ✅
- Targets = ATH and beyond
- Watching HTF fibs + channel highs for eventual cycle top formation
DOGE is doing what DOGE does — don’t overcomplicate it.
1D:
3D:
1W:
1M:
Dogecoin - This is the key structure!Dogecoin - CRYPTO:DOGEUSD - has to reverse now:
(click chart above to see the in depth analysis👆🏻)
A couple of months ago Dogecoin retested the previous all time high. We have been seeing a harsh correction of about -65% thereafter. However Dogecoin still remains in a bullish market with bullish structure. In order to validate this trend, a reversal must happen now.
Levels to watch: $0.15, $0.5
Keep your long term vision🙏🙏
Philip (BasicTrading)

Complete Analysis of DOGE/USDT 4hComplete Analysis of DOGE/USDT 4h
The chart suggests a transition phase toward an uptrend.
Moving averages are beginning to slope upward, indicating a potential trend reversal. The MACD shows weakening selling pressure and is approaching a bullish crossover, which often precedes upward price movement.
Entry zones: Between 0.14452 and 0.15185 — favorable areas for position accumulation.
Price targets:
First target: 0.20455 (a key resistance zone).
Second target: 0.22942, where stronger selling pressure may emerge.
Risk management: A suggested stop-loss at 0.13561 to protect capital if the anticipated move fails.
If the price breaks and consolidates above 0.17, the market could gain momentum to reach the projected targets. Monitor volume during breakout candles to confirm the presence of buying flow.

This retrace was never weakness — it was refinementDOGE delivered the exact narrative I’ve come to expect from algorithmic flow on the low timeframes. This wasn’t about volatility. This was about cleanup.
The play:
After the initial spike, price formed a visible FVG and retraced into the 0.5–0.618 fib zone. That’s not random — that’s rebalancing. Not only did we see a fade into the midpoint, but volume increased into the dip, not out of it.
What this does is simple: it clears out early longs, taps deeper liquidity, and prepares for re-delivery — all while structure remains intact.
Expectation:
Two paths are mapped — both favoring upside:
Ideal scenario: sweep 0.618 or 0.786 (down to 0.1726) → quick rejection → rally back into the FVG and above
Conservative: hold above 0.1761 fib (0.5) and slowly grind into 0.1795
Final target remains the inefficiency fill near 0.1825
Risk profile:
Entry: 0.174–0.176 zone
Invalidation: below 0.169
TP1: 0.1795
TP2: 0.1825
I’m not interested in chasing. I’m interested in absorption. This is where smart entries are born — deep in discount, backed by displacement.
Final word:
“If you can’t see the intention behind the pullback, you’re not trading Smart Money — you’re reacting to it.”

DOGEUSDT BINANCE:DOGEUSDT Price is ranging between 0.18200 and 0.18650 dollars after a sharp rise from 0.17000. A break above 0.186 triggers a buy, targeting 0.19450 and 0.19950 dollars. A break below 0.182 triggers a sell, with supports at 0.17650 and 0.17000 dollars.
Trigger Levels:
Buy Trigger: 0.186
Sell Trigger: 0.182
⚠️Contorl Risk management for trades.
