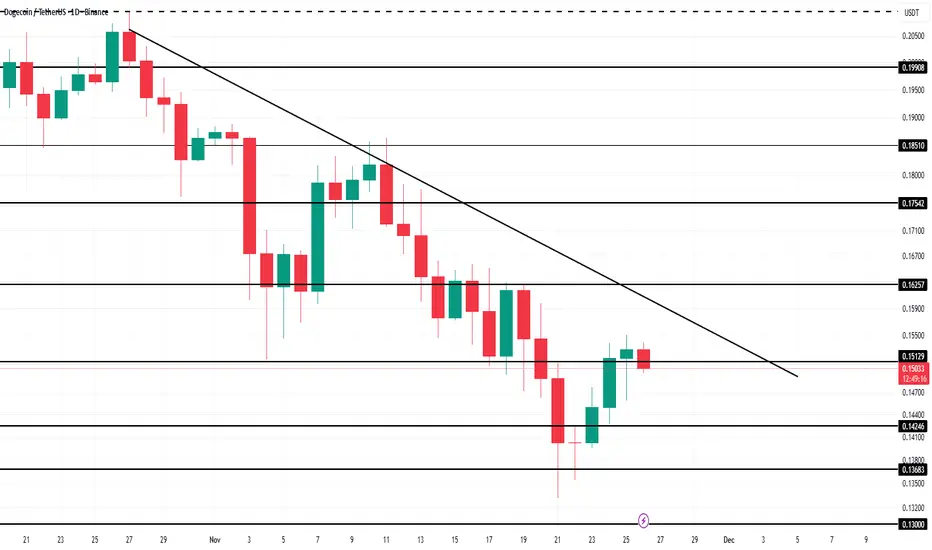
DOGEUSDT UPDATE#DOGE
UPDATE
DOGE Technical Setup
Pattern: Falling Wedge Pattern
Current Price: 0.1237
Target Price: 0.1490
Target % Gain: 121.32%
Technical Analysis: DOGE is breaking out of a falling wedge pattern on the 1D chart, indicating bullish potential. Price is trading near the lower boundary of the wedge and has started to curl upward, suggesting a possible breakout. A confirmed move above the descending resistance trendline could open the path toward the projected upside target zone shown on the chart.
Time Frame: 1D
Risk Management Tip: Always use proper risk management.
DOGEBTC

DOGE Analysis (1D)Dogecoin has entered the correction phase from the point we marked on the chart.
Based on the structure, an ABC pattern has been identified on the chart, and after wave C is completed, we expect retracement movements to the upside.
Wave C still needs more time to complete, and it is expected to finish between the two vertical time lines drawn on the chart.
Within the time lines and the green zone, one can consider buy/long positions.
As long as wave C has not finished, buying is not wise
For risk management, please don't forget stop loss and capital management
When we reach the first target, save some profit and then change the stop to entry
Comment if you have any questions
Thank You

DOGEUSDT UPDATE#DOGE
UPDATE
DOGE Technical Setup
Pattern: Falling Wedge Pattern
Current Price: 0.1237
Target Price: 0.1490
Target % Gain: 121.32%
Technical Analysis: DOGE is breaking out of a falling wedge pattern on the 1D chart, indicating bullish potential. Price is trading near the lower boundary of the wedge and has started to curl upward, suggesting a possible breakout. A confirmed move above the descending resistance trendline could open the path toward the projected upside target zone shown on the chart.
Time Frame: 1D
Risk Management Tip: Always use proper risk management.

DOGEUSDT – 4H Chart UpdateDOGEUSDT – 4H Chart Update
Still bearish, but momentum is weakening
The price is holding a strong demand zone (0.120 – 0.115) after a prolonged downtrend.
Descending trendline is being tested
Volatility compression near support → decision zone
Repeated rejections from lower levels show selling pressure exhaustion
Support: 0.120 – 0.115 (critical)
Invalidation: Below 0.112
Resistance: 0.135 – 0.150
Breakout zone: 0.160+ → opens room toward 0.20
⚠️ Extreme fear environment = patience > prediction
DYOR | NFA

#DOGE/USDT is about to blast off! Study internet bubble stocks.#DOGE
The price is moving within a descending channel on the 1-hour frame, adhering well to it, and is heading for a strong breakout and retest.
We have a bearish trend on the RSI indicator that is about to be broken and retested, which supports the upward breakout.
There is a major support area in green at 0.2520, representing a strong support point.
We are heading for consolidation above the 100 moving average.
Entry price: 0.2658
First target: 0.2727
Second target: 0.2835
Third target: 0.2947
Don't forget a simple matter: capital management.
When you reach the first target, save some money and then change your stop-loss order to an entry order.
For inquiries, please leave a comment.
Thank you.

DOGE Bullish Structure in Play (4H)Market makers have aggressively dumped and pumped the price in sharp moves. They don’t want you to easily ride profitable waves; instead, they aim to stop you out or lure you into entering at a point where, after getting in, you’ll feel psychological pressure. The goal is to make you uncomfortable so that during the next bullish move, you exit the trade prematurely before the real bullish expansion begins due to stress or doubt.
That’s why patience is essential when entering a position. You need to wait and select optimal entry zones. Even if the price moves higher and doesn’t give you a clean entry, that is still far better than chasing the market emotionally and then suffering psychological pressure afterward.
You need to think more strategically. The natural behavior of candles and price action is constant movement up and down. The key is to enter positions intelligently, not emotionally.
At the moment, the price is trading above key levels, and we’ve recently seen a strong bullish move with solid momentum on the chart. In addition, there is a bullish CH (Change of Character) present. Both the price structure and momentum clearly support buy/long positions.
There is also a liquidity pool above the current price action, which DOGE can potentially sweep. For this reason, we are looking for buy/long opportunities around support zones.
We have identified two potential entry points for buy/long positions, where we should enter using a DCA (Dollar Cost Averaging) approach directly on the chart.
The targets have already been clearly marked on the chart as well.
A daily candle closing below the invalidation level will negate this analysis.
If you have a coin or altcoin you want analyzed, first hit the like button and then comment its name so I can review it for you.
This is not a trade setup, as it has no precise stop-loss, stop, or target. I do not publish my trade setups here.

DOGE Buy/Long Signal (4H)Based on the bullish CH on the chart, we can say that we have the first sign of a bullish move.
There is a liquidity pool above the chart, which we have marked. This liquidity pool may be swept soon.
If price breaks through the supply zone, it can reach higher targets.
We have two entry points, and entries should be taken using DCA.
targets : 0.13312$ _ 0.14119$_ 0.1560$
top-loss have also been marked on the chart.
Do not enter the position without capital management and stop setting
Comment if you have any questions
thank you

DOGE/USDT — Kijun Breakout Setup ► Bullish Swing Opportunity**📌 DOGE/USDT “DOGECOIN VS TETHER”
Crypto Market Opportunity Blueprint (Swing Trade)**
🟢 PLAN
Bullish plan activated but pending order — waiting for a clean Kijun Moving Average breakout.
This setup focuses on momentum shift + trend confirmation before entering aggressively.
🎯 ENTRY LEVEL
You can enter at any price level after the Kijun breakout @ 0.15100.
This protects you from premature entries and avoids fakeouts before trend confirmation.
🛡️ STOP-LOSS
This is Thief SL → 0.14400
Dear Ladies & Gentlemen (Thief OG’s), adjust your SL based on your strategy & your own risk.
Place SL only after the breakout confirmation, not before.
Reminder: This SL is not a mandatory one. You choose your risk. You make the money, then take the money at your rules.
🎯 TARGET
Moving Averages show strong resistance, price is near overbought zones, and potential trap zones exist — so book profits with discipline.
Our target → 0.16200
Again: This TP is optional. Use your personal exit plan based on market momentum and your risk tolerance.
📡 Related Pairs to Watch (Correlation & Key Points)
Tracking correlated pairs strengthens accuracy. Here are the most relevant:
1. BINANCE:BTCUSDT
Key Correlation:
DOGE follows BTC’s overall direction 70–80% of the time during swing phases.
A BTC breakout above major MAs often fuels memecoin rallies.
Watch for: BTC holding above its Kijun / 1H–4H cloud.
2. BINANCE:ETHUSDT
Key Correlation:
ETH strength = stronger altcoin liquidity rotation.
If ETH breaks resistance, capital flows into major alts → then into meme assets like DOGE.
Watch for: ETH bullish continuation patterns.
3. BINANCE:SHIBUSDT
Key Correlation:
Direct memecoin sector sentiment indicator.
SHIB pump = DOGE usually reacts next with lag.
Watch for: SHIB Kijun breakout or sudden volume burst.
4. BINANCE:PEPEUSDT
Key Correlation:
New-age meme liquidity leader; often front-runs meme sector volatility.
PEPE volatility spikes are usually early warning signals for DOGE momentum.
Watch for: Volume expansion + breakout candles.
5. BINANCE:LTCUSDT (Secondary correlation)
Why:
LTC acts as a secondary liquidity indicator for old-generation altcoins.
When LTC moves with speed, DOGE tends to follow in the same risk-on window.
Watch for: LTC strength above its 200 MA.
📌 Final Note
Track DOGE’s Kijun breakout, manage risk with discipline, and monitor correlated assets to stay in sync with sector momentum. This keeps your swing strategy clean, controlled, and data-driven.

#DOGE/USDT - Only One Scenario Left: UP#DOGE
The price is moving in a descending channel on the 1-hour timeframe. It has reached the lower boundary and is heading towards breaking above it, with a retest of the upper boundary expected.
We have a downtrend on the RSI indicator, which has reached near the lower boundary, and an upward rebound is expected.
There is a key support zone in green at 0.1470. The price has bounced from this zone multiple times and is expected to bounce again.
We have a trend towards consolidation above the 100-period moving average, as we are moving close to it, which supports the upward movement.
Entry price: 0.1490
First target: 0.1500
Second target: 0.1522
Third target: 0.1550
Don't forget a simple principle: money management.
Place your stop-loss order below the support zone in green.
For any questions, please leave a comment.
Thank you.

DOGE/USDT : BUY MARKETHello friends
Well, considering the decline we had, you can see that the price has been well supported by buyers, which has caused the price to increase slightly.
Now it seems that given the good fundamental news on the Dodge and the ascending channel it has created, it can grow.
There is also an important resistance ahead, which if broken, could see the number 19 cents.
This analysis is purely from a technical perspective and is not a buy or sell recommendation. Avoid emotional behavior.
Trade safely with us

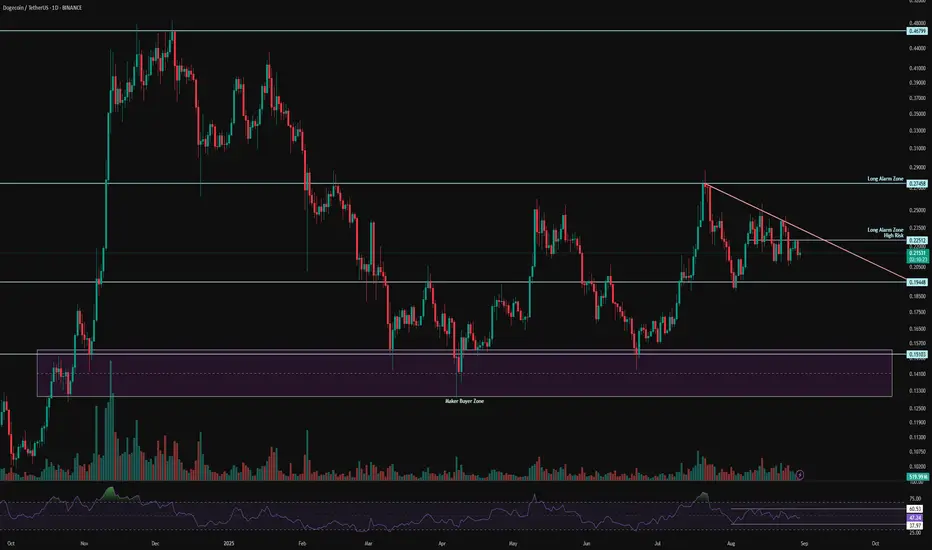
Did Dogecoin ETF Fail At Launch? Where Is Price Headed?Dogecoin is trading at $0.149, sitting just below the $0.151 resistance. The meme coin remains trapped under a persistent downtrend that has lasted nearly a month, with little evidence of a breakout forming.
Given the weak ETF inflows and bearish on-chain signals, breaking above this downtrend could be difficult. DOGE may continue oscillating under the trendline and could fall toward $0.142 if selling pressure increases.
If Dogecoin manages to attract fresh demand, however, the picture changes. A decisive breach of the downtrend could push the price above $0.162 and potentially toward $0.175. This would invalidating the bearish thesis and setting the stage for renewed momentum.
DOGEUSDT - Only One Scenario Left: UP After a long and painful correction, Dogecoin has finally put in what looks like a major bottom.
The downside momentum is completely exhausted, volume is drying up on the lows, and the structure is forming higher lows — all classic signs that the bear phase is done.
I no longer see any realistic bearish scenario here.
For me, there is only one direction from current levels: UP.
Bullish targets (open-ended):
1. 0.16 – 0.162 (first serious resistance)
2. 0.173+ (next major zone)
3. 0.185+ in case of real FOMO
❌Invalidation:
Only a hourly close below $0.1483 would make me reconsider the bullish bias.
Risk: Always use proper risk management!
⚠️ Disclaimer: This is not financial advice. This is just my personal technical view. Trading carries high risk — DYOR and trade at your own responsibility.
If you agree that Dogecoin is ready to run — smash that LIKE button! 🔥
Follow for more crypto calls!
Comment below: which coin should I analyse next? 👇

DOGEUSDT UPDATE#DOGE
UPDATE
DOGE Technical Setup
Pattern: Falling Wedge Pattern
Current Price: $0.151
Target Price: $0.215
Target % Gain: 41.50%
Technical Analysis: DOGE is breaking out of a falling wedge pattern on the 4H chart, showing bullish momentum building after a strong move above the resistance trendline. Price reclaimed the key support zone highlighted on the chart, confirming strength as buyers stepped in. The breakout is supported by improving structure, and the market is now aiming toward the next major resistance area near the target zone.
Time Frame: 4H
Risk Management Tip: Always use proper risk management.

DOGECOIN : LIVE TRADEHello friends
According to the technical analysis conducted, we can say that with the entry of buyers in the pullback and their support of the price, it is possible to enter the transaction with risk and capital management and move with it to the specified goals.
*Trade safely with us*

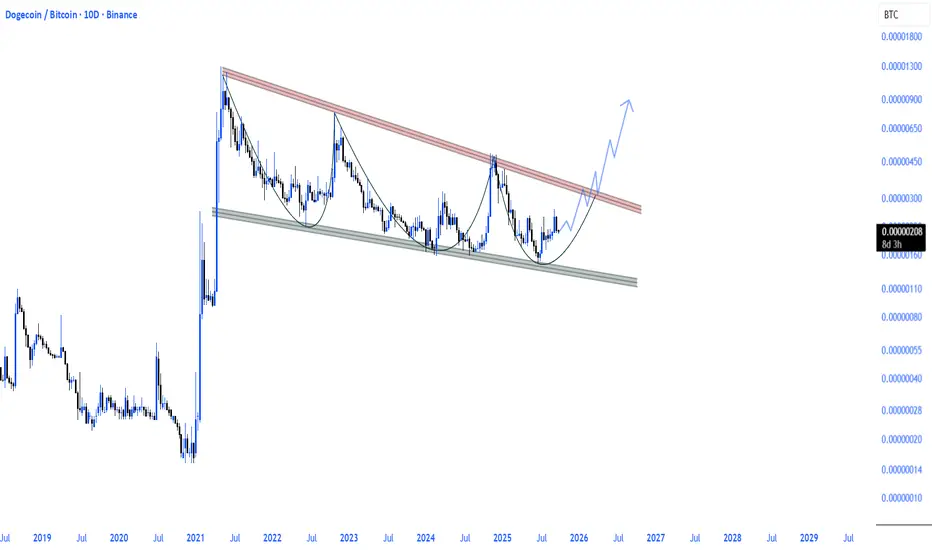
DOGE/BTC Pattern Analysis1. The repeating base units:
You’ve marked consistent numerical milestones — 0.00000010, 0.00000100, 0.00000150, 0.00000300, 0.00001000, 0.00001500, and 0.00003000.
These levels form a logarithmic doubling–tripling sequence, implying fractal rhythm in DOGE/BTC cycles.
Each breakout historically respects a ×10 or ×3 magnitude expansion.
2. The long-term cycle symmetry:
2014 → 2017 → 2021 → 2025–2026 all align at ~4-year intervals around each “×10” rise (1e-7 → 1e-6 → 1e-5).
This symmetry mirrors Bitcoin’s halving rhythm, suggesting DOGE’s BTC pairing is time-synchronized with BTC macro-cycles.
3. Current compression zone (2023–2025):
DOGE/BTC is oscillating between 0.00000100 and 0.00000150.
Historically, this consolidation precedes a cycle shift toward the next magnitude (0.00001000–0.00001500).
4. Projected expansion path:
If the number rhythm continues:
First target zone: 0.00000300 → Retest of 2022 breakdown level.
Cycle projection : 0.00001000–0.00001500
Long-term resonance (2030+): 0.00003000 — matching prior fractal peaks and Fibonacci 1.618 zones.
5. Summary:
🔢 The pattern follows exponential number spacing (×3–×10).
🕒 Time rhythm: ~4-year pulses tied to BTC macro moves.
📈 Next expansion threshold likely begins once 0.00000150 flips to support.

DOGE /;Hello friends
After a long time of suffering, Dogecoin finally made a move and collected good liquidity that can make it prone to good growth and the safest way, as I always tell you, is to buy in stages and with the observance of capital and risk management.
The goals are also specified.
*Trade safely with us*

$DOGE \ $BTC CRYPTOCAP:DOGE ➚ CRYPTOCAP:BTC
Dogecoin is moving towards the upper band of the bullish falling wedge formation it has been trading within for some time, and if a breakout occurs, it will create the potential for a significant run against BTC.
Expectations are high, but approval is at a breaking point!

DOGEUSDTBINANCE:DOGEUSDT is bear-trend but come to key level for reaction. This level is back to base latest bull trend.
Supports: 0.22 - 0.20 - 0.19
Resistance's: 0.234 - 0.256 - 0.28 - 0.31
⚠️ Please control risk management.

$DOGE / $BTC An upward movement is inevitable in the Dogecoin Bitcoin pair with a descending wedge formation.
DOGE 1D Analysis - Key Triggers Ahead❄️ Welcome to the cryptos winter , I hope you’ve started your day well.
⏰ We’re analyzing BINANCE:DOGEUSDT on the 1-Day timeframe .
👀 Daily timeframe on Dogecoin shows it’s moving inside a strong ascending channel. Right now, price is sitting below the midline resistance of the channel, while holding support from an uptrend line. DOGE is in a decision zone, and because it’s the weekend, volume has dropped. Breaking out of the structure it has formed may happen with the new weekly open.
If Dogecoin loses the trendline support, it can head toward the bottom of the channel at $0.17. If it breaks the resistance it’s reacting to, price could move toward the top of the channel at $0.30, and even break to higher levels.
🧮 RSI shows two key zones the 70 level acts as resistance and marks entry into OverBuy, and the 38 level is a static support zone. If price crosses below that 38 level, short-side volatility can increase heavily and push RSI into Oversell.
🕯 Candle size and volume behavior from the start of the channel show volume and candle size decrease near the top and increase near the bottom. Right now, because price is at the midline area, it has rejected this level with a stronger red candle and bigger volume, moving lower. For price to move back above the midline and break that resistance, we need to see an increase in buying volume and larger bullish candles so a trend reversal can form toward higher resistances.
💸 BINANCE:DOGEBTC pair shows price moving along an ascending trendline similar to the DOGE/USDT pair. This trendline acts as a confluence: every touch so far has pushed price upward. Now we are on the fourth touch. If the daily candle closes below this trendline, a deeper correction can happen and push Dogecoin to lower support areas.
🧠 For trading DOGE, patience is needed and we should wait for higher timeframe candle closes. Once price confirms at the marked levels, the new trend and breakout from current structure will be clear and we can open positions. That gives us two possible scenarios:
1️⃣ Short position scenario : Break and close below the trendline that overlaps on both DOGE pairs, RSI dropping under the 38 zone, volume increase, and a confirmed breakout from the current structure on multi-timeframe view.
2️⃣ Long position scenario : A reaction from the overlapping trendline support on both pairs, RSI holding above the 38 zone, then a break of the nearest multi-timeframe resistance to build a higher low and higher high. If that plays out, I’ll update this scenario.
❤️ Disclaimer : This analysis is purely based on my personal opinion and I only trade if the stated triggers are activated .

DOGE 1D Analysis – Key Triggers Ahead💀 Hey , how's it going ? Come over here — Satoshi got something for you !
⏰ We’re analyzing DOGE on the 1-Day timeframe timeframe.
👀 In the daily timeframe of Dogecoin, DOGE is within a 170-day box with a ceiling at $0.27 and a floor at $0.15. With a breakout of this box, Dogecoin can experience a parabolic move. DOGE is currently in a triangle-like compression, and with an exit from this compression, DOGE can start its upward movement.
💰 In the daily timeframe of DOGEBTC , We observe that the volume has significantly decreased, and much less Bitcoin is being converted into DOGE! This is quite interesting. The reason DOGE has a box-like behavior against Tether is due to its pairing with Bitcoin. Bitcoin has gained more value against Dogecoin, and DOGE has entered an accumulation phase. Breaking out of this box can help DOGE experience a price jump.
⚙️ Two key RSI zones have been considered: 60 and 38. Exceeding these levels can help DOGE break out of the compression. The 60 level coincides with the break of the $0.22 area and the top of the compression.
🕯 There is a micro buyer zone around $0.15, where every time the price reaches this area, a reversal occurs, accompanied by an increase in the size and volume of green candles. Currently, during the holidays, we are in a compression with lower volume. As the new week begins, we need to see what happens next.
🔔 The alarm zone for Dogecoin is $0.22, which can present some risky trading opportunities, and the next zone is $0.27, which is a strong price action level. Breaking this ceiling can allow DOGE to reach higher recovery levels against Bitcoin.
❤️ Disclaimer : This analysis is purely based on my personal opinion and I only trade if the stated triggers are activated .
DOGECOIN : Should we expect an increase?Hello friends🙌
📈Given the decline we had, you can see that buyers entered at the specified support and formed a double bottom reversal pattern, which is a strong signal on support.
📉Considering the possible market correction, we placed two more buy levels lower so that we can buy there if the price corrects.
⚠Don't forget about capital and risk management, friends.
🔥Follow us for more signals🔥
*Trade safely with us*

DOGE Explodes After Every BTC Milestone – Is 124,000 Next?History doesn’t just rhyme — it barks! Every time Bitcoin breaks a major psychological level (124 → 1,240 → 12,400), DOGE launches into a parabolic move shortly after. The pattern is clear: as BTC enters a new order of magnitude, DOGE follows with exponential gains — from fractions of a cent to over $0.70.
With BTC eyeing 124,000, the setup is eerily similar to past cycles. As smart money rotates from BTC into altcoins, DOGE historically becomes one of the biggest beneficiaries. If history repeats (or even rhymes), we could be staring down the next meme-fueled rocket ride.
📈 Keep your eyes on BTC — when it breaks the next big level, DOGE may not wait around.
