ROAD TO 15 CENTS (4h)ROAD TO 15 CENTS
We can be hopeful that after breaking out of the wedge, we will see significant price growth.AB=CD
Best regards CobraVanguard.💚
Give me some energy !!
✨We spend hours finding potential opportunities and writing useful ideas, we would be happy if you support us.
Best regards CobraVanguard.💚
Dogeusd

DOGEUSD | The DOG is ready for a jump Vol.2Hello traders,
Looks like DOGE broke a 3 months old heavy trendline with a strong impulsive candle. My trade plan will look for a pullback to fill the FVG then a bullish continuation.
The R:R is very good and the target areas can't be ignored.
Good Luck!
All our analysis is shared with honesty, care, and real effort. If you find value in it, a like or comment means a lot to show your support🙏📊

DOGE Analysis (1D)Dogecoin has entered the correction phase from the point we marked on the chart.
Based on the structure, an ABC pattern has been identified on the chart, and after wave C is completed, we expect retracement movements to the upside.
Wave C still needs more time to complete, and it is expected to finish between the two vertical time lines drawn on the chart.
Within the time lines and the green zone, one can consider buy/long positions.
As long as wave C has not finished, buying is not wise
For risk management, please don't forget stop loss and capital management
When we reach the first target, save some profit and then change the stop to entry
Comment if you have any questions
Thank You

DOGEUSDT – 4H Chart UpdateDOGEUSDT – 4H Chart Update
Still bearish, but momentum is weakening
The price is holding a strong demand zone (0.120 – 0.115) after a prolonged downtrend.
Descending trendline is being tested
Volatility compression near support → decision zone
Repeated rejections from lower levels show selling pressure exhaustion
Support: 0.120 – 0.115 (critical)
Invalidation: Below 0.112
Resistance: 0.135 – 0.150
Breakout zone: 0.160+ → opens room toward 0.20
⚠️ Extreme fear environment = patience > prediction
DYOR | NFA

#DOGE/USDT is about to blast off! Study internet bubble stocks.#DOGE
The price is moving within a descending channel on the 1-hour frame, adhering well to it, and is heading for a strong breakout and retest.
We have a bearish trend on the RSI indicator that is about to be broken and retested, which supports the upward breakout.
There is a major support area in green at 0.2520, representing a strong support point.
We are heading for consolidation above the 100 moving average.
Entry price: 0.2658
First target: 0.2727
Second target: 0.2835
Third target: 0.2947
Don't forget a simple matter: capital management.
When you reach the first target, save some money and then change your stop-loss order to an entry order.
For inquiries, please leave a comment.
Thank you.

DOGE Bullish Structure in Play (4H)Market makers have aggressively dumped and pumped the price in sharp moves. They don’t want you to easily ride profitable waves; instead, they aim to stop you out or lure you into entering at a point where, after getting in, you’ll feel psychological pressure. The goal is to make you uncomfortable so that during the next bullish move, you exit the trade prematurely before the real bullish expansion begins due to stress or doubt.
That’s why patience is essential when entering a position. You need to wait and select optimal entry zones. Even if the price moves higher and doesn’t give you a clean entry, that is still far better than chasing the market emotionally and then suffering psychological pressure afterward.
You need to think more strategically. The natural behavior of candles and price action is constant movement up and down. The key is to enter positions intelligently, not emotionally.
At the moment, the price is trading above key levels, and we’ve recently seen a strong bullish move with solid momentum on the chart. In addition, there is a bullish CH (Change of Character) present. Both the price structure and momentum clearly support buy/long positions.
There is also a liquidity pool above the current price action, which DOGE can potentially sweep. For this reason, we are looking for buy/long opportunities around support zones.
We have identified two potential entry points for buy/long positions, where we should enter using a DCA (Dollar Cost Averaging) approach directly on the chart.
The targets have already been clearly marked on the chart as well.
A daily candle closing below the invalidation level will negate this analysis.
If you have a coin or altcoin you want analyzed, first hit the like button and then comment its name so I can review it for you.
This is not a trade setup, as it has no precise stop-loss, stop, or target. I do not publish my trade setups here.

DOGE: Something Familiar is CookingThe chart explains everything. Similar patterns, similar structures. I think something is brewing right now...
Invalidated if it breaks below the support line.

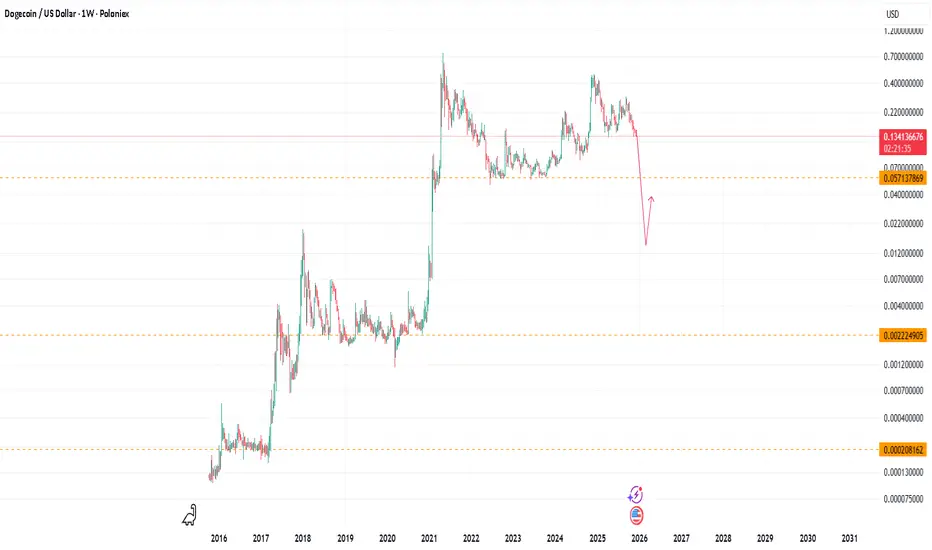
DOGE road map (weekly) !After the drop, the price can slightly bounce back up if buyers support it and we have a price correction. If the red trendline is broken, the price can move to the ranges we have specified.

DOGE/USDT: Consolidation Resolves LowerHi!
Market Structure:
Dogecoin remains in a well-defined descending channel, confirming a sustained bearish trend. Price continues to print lower highs and lower lows, indicating that sellers are still in control on the 4H timeframe.
Pattern Development:
Within the channel, price consolidated into a bearish rectangle, which typically acts as a continuation pattern. The breakdown from this range aligns with the dominant downtrend and reinforces the bearish bias rather than signaling accumulation.
Trend & Momentum:
Repeated rejections from the upper channel boundary and the median line show weak bullish follow-through. Each corrective bounce has been sold aggressively, suggesting distribution rather than reversal.
Key Levels:
Resistance: Upper channel/rectangle top
Support: Channel lower boundary near 0.117–0.118
As long as DOGE trades below the descending channel resistance, downside pressure remains dominant. A continuation toward the lower channel support is favored. Only a confirmed breakout above the channel would neutralize the bearish structure.

DOGE: Wedge Squeeze PlayWe're sitting at the decision point. DOGE has compressed into a textbook converging wedge with 11 touches on descending resistance, and price is literally touching that line at $0.1300 right now. The structure has already broken bearish (CHoCH confirmed), and with volume down 83%, the setup favors continuation over reversal. This is a patience game, the wedge resolves soon, but forcing the trade before confirmation is how traders get chopped up.
1. THE TECHNICAL REALITY 📉
• Converging wedge apex: Descending resistance from $0.1400 (11 touches) meets ascending support at $0.1200 - $0.01 squeeze zone
• Structure broken: CHoCH Bearish confirmed with lower high formation, market structure favors downside
• Bearish order block: $0.1288-$0.1330 acting as supply zone, price testing the top right now
• Moving averages stacked bearish: Price below EMA20 ($0.1304), EMA50 ($0.1319), and EMA200 ($0.1442)
2. THE INDICATORS ⚖️
Bearish Signals:
• Volume collapse: $121M vs $728M average (83% drop), zero conviction behind breakout attempts
• Price trading in discount zone but unable to reclaim premium
• CHoCH Bearish with lower highs, structure thesis intact
Bullish Signals:
• MACD bullish crossover (0.0002 vs 0.0000), marginal at best
• Price above HMA55 ($0.1292) and Bollinger middle band ($0.1296)
• Lower wicks (34.2%) exceeding upper wicks (14.5%) on current candle
The Conflict:
RSI at 58.3 sits in neutral territory, not oversold enough to signal reversal, but not overbought either. The single-candle wick analysis shows buying pressure, but broader structure with CHoCH bearish matters more than one bar.
3. THE TRADE SETUP 🎯
🔴 Scenario A: Wedge Rejection (Higher Probability)
• Trigger: Rejection at bearish OB $0.1330 with descending resistance hold
• Entry: Scale in $0.1300-$0.1310 on rejection wicks
• Target 1: $0.1263 (unfilled bullish FVG, imbalance needs filling)
• Target 2: $0.1198 (swing low + ascending support + bullish OB zone)
• Stop: 4H close above $0.1330 (bearish OB breaks, thesis invalidated)
🟢 Scenario B: Wedge Breakout (Requires Confirmation)
• Trigger: Strong 4H close above $0.1330 with volume expansion
• Entry: Retest of $0.1330 as support after breakout
• Target: $0.1505 (CHoCH bullish reversal level, premium zone entry)
• Invalidation: Failure to hold $0.1330 on retest, rejection back into wedge
MY VERDICT
The setup favors Scenario A with 62% confidence. Structure is bearish, volume is non-existent, and the unfilled FVG at $0.1263 acts as a magnet. But the wedge apex means the break happens soon... wait for the rejection at $0.1330 or the confirmed breakout above it. Let the market show its hand before committing capital.
What's your read on this compression? Are you waiting for the break or already positioned for one scenario?

DOGE Buy/Long Signal (4H)Based on the bullish CH on the chart, we can say that we have the first sign of a bullish move.
There is a liquidity pool above the chart, which we have marked. This liquidity pool may be swept soon.
If price breaks through the supply zone, it can reach higher targets.
We have two entry points, and entries should be taken using DCA.
targets : 0.13312$ _ 0.14119$_ 0.1560$
top-loss have also been marked on the chart.
Do not enter the position without capital management and stop setting
Comment if you have any questions
thank you

DOGE – Downtrend Channel + Bearish Head & Shoulders BreakdownDogecoin continues to move inside a large multi-year descending channel, respecting both the upper and lower boundaries. Recently, the chart has formed a clear bearish Head and Shoulders pattern , which has already broken down and is currently playing out.
At this stage, I expect a small relief retest toward the $0.15–$0.175 zone , which corresponds to the broken neckline area. If this retest confirms resistance, DOGE may enter a deeper correction phase.
The main downside target lies at the $0.04–$0.03 zone , aligned with the lower boundary of the long-term descending channel.
From this area, I expect the beginning of a new bullish cycle for DOGE, potentially initiating a macro trend reversal.
Future bullish targets:
$0.80–$1.00
$1.70–$2.20

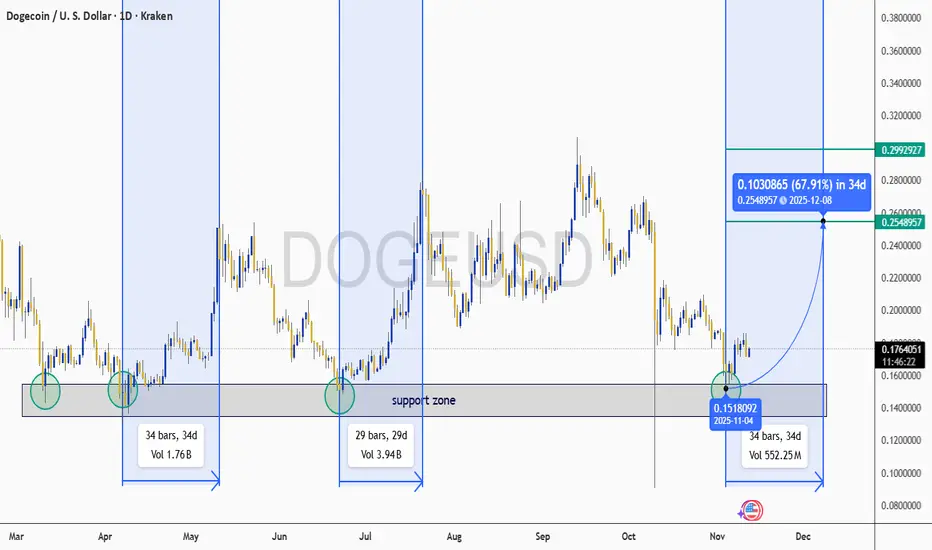
The doge is ready for a jump?DOGE has once again found itself testing a critical local support zone, a level that has historically acted as a springboard for significant price rallies.
In late April, after hitting this zone, DOGE initiated a rally that saw a substantial gain over 34 days.
Remember...history repeats itself. 34 days for a potential 65%? Not too bad, eh?
DOGE to 0.0135 USDThere won't be another alt season until DOGEBTC returns to 20 satoshis (BTCUSD = 69k, DOGEUSD = 0.0135, DOGEBTC = 0.00000020.
DeGRAM | DOGEUSD aims to return to $0.15📊 Technical Analysis
● DOGE rebounded cleanly from the 0.1359 support line, forming a higher low and recovering back inside short-term structure.
● Price is aiming toward 0.1420 and the descending resistance near 0.1465, where the channel top may cap the move.
💡 Fundamental Analysis
● Sentiment improved as meme-assets reacted positively to broader crypto strength and rising risk appetite.
✨ Summary
● Long bias; targeting 0.1420 → 0.1465 as price lifts from support.
-------------------
Share your opinion in the comments and support the idea with a like. Thanks for your support!

Dogecoin DOGE price analysis#Dogecoin ( CRYPTOCAP:DOGE ) shows a completed Cup & Handle structure on the OKX:DOGEUSDT chart.
Key observations:
• The memecoin sector is unwinding slower than it expanded
• CRYPTOCAP:DOGE represents more than 50% of total memecoin market cap
• The technical structure suggests two main scenarios:
1️⃣ Minimal target: ~$0.78 (mild breakout / local ATH retest)
2️⃣ Extended target: ~$1.55–1.60 (x10–11 from current levels)
A full move would imply a market cap close to $250B — aggressive, but not impossible under peak liquidity conditions.
Additionally, the same macro pattern may later appear on CRYPTOCAP:ETC and CRYPTOCAP:ADA , which structurally resemble earlier stages of Dogecoin’s formation.
❓ Which scenario do you consider more realistic for CRYPTOCAP:DOGE in the upcoming market phase?
______________
◆ Follow us ❤️ for daily crypto insights & updates!
🚀 Don’t miss out on important market moves
🧠 DYOR | This is not financial advice, just thinking out loud

DOGE near term TARGET $0,34Dogecoin is likely on it's way to more bullish prices.
Since around 22 June, there's been a near "up-only" trend on DOGE, where the price is continuously making higher highs and the corrections are all still higher lows.
In terms of technical indicators, we see strong bullish indication in the weekly timeframe as the price trade above all moving averages:
The daily timeframe's price is trading above the moving averages as well. A good place to watch for SHORT term corrections is the first and second band of the moving averages here:
OKX:DOGEUSDT BINANCE:DOGEUSDT

DOGEUSD - Top of Channel Again Soon price will hit the lower band of drawn channel and price from there tends to act pretty bullishly
Horizontal lines are long periods of stability
Long term view of DOGE on this Weekly timeframe
Good alt choice

DeGRAM | DOGEUSD is falling in the channel📊 Technical Analysis
● DOGE continues to trade within a descending channel, repeatedly rejecting the dynamic resistance near 0.1473. The recent lower-high formation and breakdown from the short-term trendline signal renewed bearish momentum.
● The failed right-shoulder recovery and tightening consolidation below 0.1460 increase the probability of continuation toward the 0.1400 support.
💡 Fundamental Analysis
● Sentiment toward memecoins remains weak as risk appetite softens and broader crypto rotation favors large-caps.
✨ Summary
● Bias: bearish; below 0.1460 targeting 0.1400 → 0.1357.
-------------------
Share your opinion in the comments and support the idea with a like. Thanks for your support!

DOGE/USDT — Kijun Breakout Setup ► Bullish Swing Opportunity**📌 DOGE/USDT “DOGECOIN VS TETHER”
Crypto Market Opportunity Blueprint (Swing Trade)**
🟢 PLAN
Bullish plan activated but pending order — waiting for a clean Kijun Moving Average breakout.
This setup focuses on momentum shift + trend confirmation before entering aggressively.
🎯 ENTRY LEVEL
You can enter at any price level after the Kijun breakout @ 0.15100.
This protects you from premature entries and avoids fakeouts before trend confirmation.
🛡️ STOP-LOSS
This is Thief SL → 0.14400
Dear Ladies & Gentlemen (Thief OG’s), adjust your SL based on your strategy & your own risk.
Place SL only after the breakout confirmation, not before.
Reminder: This SL is not a mandatory one. You choose your risk. You make the money, then take the money at your rules.
🎯 TARGET
Moving Averages show strong resistance, price is near overbought zones, and potential trap zones exist — so book profits with discipline.
Our target → 0.16200
Again: This TP is optional. Use your personal exit plan based on market momentum and your risk tolerance.
📡 Related Pairs to Watch (Correlation & Key Points)
Tracking correlated pairs strengthens accuracy. Here are the most relevant:
1. BINANCE:BTCUSDT
Key Correlation:
DOGE follows BTC’s overall direction 70–80% of the time during swing phases.
A BTC breakout above major MAs often fuels memecoin rallies.
Watch for: BTC holding above its Kijun / 1H–4H cloud.
2. BINANCE:ETHUSDT
Key Correlation:
ETH strength = stronger altcoin liquidity rotation.
If ETH breaks resistance, capital flows into major alts → then into meme assets like DOGE.
Watch for: ETH bullish continuation patterns.
3. BINANCE:SHIBUSDT
Key Correlation:
Direct memecoin sector sentiment indicator.
SHIB pump = DOGE usually reacts next with lag.
Watch for: SHIB Kijun breakout or sudden volume burst.
4. BINANCE:PEPEUSDT
Key Correlation:
New-age meme liquidity leader; often front-runs meme sector volatility.
PEPE volatility spikes are usually early warning signals for DOGE momentum.
Watch for: Volume expansion + breakout candles.
5. BINANCE:LTCUSDT (Secondary correlation)
Why:
LTC acts as a secondary liquidity indicator for old-generation altcoins.
When LTC moves with speed, DOGE tends to follow in the same risk-on window.
Watch for: LTC strength above its 200 MA.
📌 Final Note
Track DOGE’s Kijun breakout, manage risk with discipline, and monitor correlated assets to stay in sync with sector momentum. This keeps your swing strategy clean, controlled, and data-driven.

Is DOGE/USD Preparing for a Major Upside Move?🚀 DOGE/USD: ULTIMATE SWING TRADE BLUEPRINT 🚀
Catch the Rocket Before Liftoff!
🔥 WHY THIS SETUP IS FIRE
BULLISH MOMENTUM building on DOGE against the USD.
Key levels aligning for a potential SWING OPPORTUNITY.
Perfect for traders looking to RIDE THE VOLATILITY with a clear plan.
🎯 TRADE PLAN (BULLISH)
Entry: ANY PRICE – Flexibility is key! Scale in strategically.
Stop Loss: THIEF SL @ 0.14000 ⚠️
(Note: I’m not your financial advisor – adjust SL based on YOUR strategy & risk tolerance. Place SL ONLY after breakout confirmation!)
Take Profit: TP @ 0.16500 ✅
SMA acting as strong resistance + overbought signals = trap zone.
Escape with profits before the pullback!
(Reminder: TP is YOUR choice – take money at your own risk!)
📌 DEAR LADIES & GENTLEMEN (THIEF OG’s) 👑
This is a BLUEPRINT – not financial advice. Adapt it to YOUR style. Your money, your rules.
🔗 RELATED PAIRS TO WATCH
$BTC/USD – Crypto king moves, DOGE often follows sentiment.
$SHIB/USD – Meme coin sibling, correlation spikes during hype cycles.
$ETH/USD – Altcoin leader, influences broader crypto momentum.
SP:SPX (S&P 500) – Risk-on/risk-off cues can impact crypto flows.
💡 KEY CORRELATION INSIGHTS
DOGE often mirrors BTC’s direction with amplified volatility.
Meme coin rallies can be sector-wide – watch SHIB for confirmation.
USD strength (DXY) inversely affects crypto – a falling DXY = crypto bullish signal.
LIKE & FOLLOW if this resonates – boosts visibility for all!
COMMENT your entry & exit strategies – let’s build knowledge together.
SHARE to help fellow traders spot the opportunity.
📈 Stay smart, trade sharp, and manage your risk!
✅ Follow for more high-impact setups.
#DOGE #DOGEUSDT #Crypto #SwingTrade #TradingView #Memecoin #Bullish #TradingStrategy #Cryptocurrency #Bitcoin #Altcoins
#DOGE/USDT - Only One Scenario Left: UP#DOGE
The price is moving in a descending channel on the 1-hour timeframe. It has reached the lower boundary and is heading towards breaking above it, with a retest of the upper boundary expected.
We have a downtrend on the RSI indicator, which has reached near the lower boundary, and an upward rebound is expected.
There is a key support zone in green at 0.1470. The price has bounced from this zone multiple times and is expected to bounce again.
We have a trend towards consolidation above the 100-period moving average, as we are moving close to it, which supports the upward movement.
Entry price: 0.1490
First target: 0.1500
Second target: 0.1522
Third target: 0.1550
Don't forget a simple principle: money management.
Place your stop-loss order below the support zone in green.
For any questions, please leave a comment.
Thank you.

DOGE 4H – Trendline + EMA Rejection, Liquidity Below?DOGE is reacting cleanly to a multi-factor resistance cluster: the descending trendline, the 50 EMA, and the 100 EMA all converge at the same price level. This area has rejected every retest during the downtrend, and today’s wick into the circle shows the same behavior.
Stoch RSI is extended into overbought territory, adding momentum exhaustion to the setup. Below, the $0.136 level remains the key liquidity draw from previous lows — and price has not fully tapped into that zone since the last sweep.
For bulls to regain control, DOGE must break and hold above the EMA cluster and trendline. Until then, the structure favors a continuation move toward lower liquidity levels.
