DOGEUSDT 6X Long with 2184% profits potentialDogecoin closed five consecutive weeks red and this week is turning green. The only time DOGE performed like this was back in 2022, so we already have extreme conditions. Even a lower low showed up last week compared to the October 2025 market flush.
I am thinking that this bearish period will never end, it will simply go on forever. That's it. Lower and lower and lower. If you are not a seller, you should quit the market because it is never going up, ever, again.
Not being negative just telling it like it is.
The weekly RSI hit the lowest level since July 2022, extreme oversold conditions. Only a full blown bear market can produce such readings. It happened only once in all of Dogecoin's history, now twice with February 2026.
Forever down? We are going LONG!
Full trade-numbers below:
_____
LONG DOGEUSDT
Leverage: 6X
Potential: 2184%
Allocation: 5%
Entry zone: $0.0888 - $0.0999
Targets:
1) $0.1136
2) $0.1335
3) $0.1666
4) $0.1934
5) $0.2202
6) $0.2583
7) $0.3604
8) $0.3935
9) $0.4470
Stop: Close weekly below $0.0870
_____
Thank you for reading.
If you enjoy the content, good for you, continue to enjoy.
Namaste.
Dogeusdtlong

#DOGE/USDT - Only One Scenario Left: UP#DOGE
The price is moving within a descending channel on the hourly timeframe. It has reached the lower boundary and is heading towards a breakout, with a retest of the upper boundary expected.
The Relative Strength Index (RSI) is showing a downward trend, approaching the lower boundary, and an upward bounce is anticipated.
There is a key support zone in green at 0.09330. The price has bounced from this level several times and is expected to bounce again.
The RSI is showing a trend towards consolidation above the 100-period moving average, which we are approaching, supporting the upward move.
Entry Price: 0.09445
First Target: 0.09669
Second Target: 0.09890
Third Target: 0.1016
Stop Loss: Below the green support zone.
Remember this simple thing: Money management.
For any questions, please leave a comment.
Thank you.

#DOGE/USDT - Only One Scenario Left: UP#DOGE
The price is moving within a descending channel on the hourly timeframe. It has reached the lower boundary and is heading towards a breakout, with a retest of the upper boundary expected.
The Relative Strength Index (RSI) is showing a downward trend, approaching the lower boundary, and an upward bounce is anticipated.
There is a key support zone in green at 0.10500. The price has bounced from this level several times and is expected to bounce again.
The RSI is showing a trend towards consolidation above the 100-period moving average, which we are approaching, supporting the upward move.
Entry Price: 0.10655
Target 1: 0.10856
Target 2: 0.11080
Target 3: 0.11335
Stop Loss: Below the green support zone.
Remember this simple thing: Money management.
For any questions, please leave a comment.
Thank you.

DOGEUSDT 2,608% profits potential with 8X leverage —LONG tradeGood morning my fellow Cryptocurrency trader, I hope you are having a wonderful day, a wonderful start to a beautiful and hopefully prosperous and profitable week.
We are now looking at DOGEUSDT. This is a long-term chart. The action has been happening at bottom prices for months.
I will try to explain my thinking real quick to see if you can agree with this trade and the potential I am seeing in this chart setup.
The downtrend is no more, because we are not seeing lower prices. We can argue that a pause isn't necessarily bullish and a bearish resumption can happen at anytime. This can be a valid argument. But, if we go deeper into this chart and consider the whole market, then a reversal can be expected. The best time to buy is when prices are low trading at support. That's the best time to go LONG.
Dogecoin just closed three weeks red yet failed to produce a lower low compared to 29-Dec. 2025. Many altcoins in this same situation are breaking bullish. Bitcoin has been trading with no new lows since 21-November. Marketwide action points to a reversal rather than a bearish continuation.
We can also appreciate the dynamics of a relief rally on Bitcoin and the fact that it hit $98,000 before retracing, which is bullish. Bitcoin's conditions right now are bullish because the retrace happened at a major resistance point. The retrace ends in a higher low and this produces a new advance. Since Bitcoin is set to move forward, and in this case reach beyond $100,000, the altcoins will produce a strong reaction as well and this will lead to higher prices.
Since this is the last major bullish move before Bitcoin's long-term decline, the altcoins will produce one major climax, bull run type of action before a period of long quiet and bearish action. This is the last chance.
With that said, market conditions can always change. This is a high probability chart setup but anything goes. I appreciate you for reading. Thanks a lot for your time. Thanks a lot for your continued support.
Full trade-numbers below:
____
LONG DOGEUSDT
Leverage: 8X
Potential: 2608%
Allocation: 5%
Entry zone: $0.1065 - 0.1250
Targets:
1) $0.1450
2) $0.1759
3) $0.2010
4) $0.2260
5) $0.2615
6) $0.3068
7) $0.3568
8) $0.3878
9) $0.4377
10) $0.5180
Stop: Close weekly below $0.1050
____
I am wishing you tons of profits, health, wealth and success.
Namaste.

DOGE/USDT: Defending the High-Time-Frame Support ClusterThe Macro Context DOGE/USDT is currently interacting with a High-Confluence HTF (High Time Frame) Support Cluster on the Daily timeframe. After a period of corrective price action, the asset has entered a stabilization phase within a historical demand zone. This area has previously acted as a springboard for liquidity absorption and trend reversals.
Why this setup is on our radar:
Support Cluster Defense: The chart highlights a well-defined demand block where buyers have consistently stepped in. The price is currently testing the lower boundary of this zone, providing a logical area for risk-defined entries.
Volatility Compression: We are observing a decrease in selling momentum as price approaches the 0.117 - 0.120 region. This compression often precedes an expansion phase as the market seeks new liquidity.
Market Structure: While the immediate trend has been corrective, the ability to hold this HTF floor suggests that the broader accumulation structure remains intact. We are looking for a "Spring" or higher-low formation to confirm the reversal.
Technical Levels & Plan:
Accumulation Zone: We are watching the 0.120 - 0.125 region for structural stabilization.
Invalidation Level: The bullish thesis is strictly contingent on holding this support cluster. A Daily close below the swing low (~0.1139) would signal a breakdown of the HTF structure and invalidate the setup.
Structural Resistance (Targets): Short Term: 0.130 - 0.135 (Immediate Reclaim) Mid Term: 0.145 - 0.150 (Range Highs)
Macro / Moonbag: If momentum reclaims the 0.150 level, we look toward 0.160+ and a challenge of yearly highs.
Risological Note: We are trading the "reaction" at support, not the prediction. A bounce here validates the level; a slice through it invalidates the trade immediately.
Disclaimer: This analysis is for educational purposes only. Crypto assets are highly volatile. This is not financial advice.
Check my trading setup: Links below.

#DOGE/USDT - Only One Scenario Left: UP#DOGE
The price is moving within a descending channel on the hourly timeframe. It has reached the lower boundary and is heading towards a breakout, with a retest of the upper boundary expected.
The Relative Strength Index (RSI) is showing a downward trend, approaching the lower boundary, and an upward bounce is anticipated.
There is a key support zone in green at 0.1210, and the price has bounced from this level several times and is expected to bounce again.
The indicator is showing a trend towards consolidation above the 100-period moving average, which we are approaching, supporting the upward move.
Entry Price: 0.1244
First Target: 0.1265
Second Target: 0.1295
Third Target: 0.1331
Stop Loss: Below the green support zone.
Remember this simple thing: Money management.
For any questions, please leave a comment.
Thank you.

Doge and a BIG rise!Hi!
As shown on the chart, DOGE has clearly broken above the long-term descending trendline, which had been acting as resistance for several weeks. Following this breakout, price moved higher and confirmed the shift in market structure.
Importantly, the breakout was supported by a strong bullish engulfing move, taking out the previous local high. This price action strengthens the case for a trend reversal rather than a simple relief bounce.
After the impulsive move up, DOGE is now pulling back toward a key demand zone around $0.11–$0.13, which aligns with prior structure support and the breakout retest area. This zone offers a favorable risk-to-reward opportunity for long positions.
As long as price holds above this support, the upside target remains around $0.17, which corresponds to the next major resistance level and the projected move from the breakout.

#DOGE/USDT is about to blast off! Study internet bubble stocks#DOGE
The price is moving in a descending channel on the 1-hour timeframe. It has reached the upper limit and is heading towards breaking downwards, with a retest of the upper limit expected.
We have an upward trend on the RSI indicator, which has reached near the upper limit, and a downward reversal is expected.
There is a major resistance zone in green at 0.1546. The price has bounced from this zone multiple times and is expected to bounce again.
We have a trend of consolidation above the 100-period moving average, as we are moving close to it, which supports a downward move towards touching it.
Entry price: 0.1420
First target: 0.1395
Second target: 0.1355
Third target: 0.1307
Stop loss: Above the resistance zone in green.
Don't forget a simple thing: capital management.
For inquiries, please leave a comment.
Thank you.

DOGE/USDT at Critical Resistance – Breakout or Rejection?DOGE/USDT on the 1D timeframe is still trading in a clear downtrend, characterized by a consistent formation of lower highs and lower lows. Price is currently moving inside a descending channel and is experiencing a relief rally / corrective move toward dynamic resistance.
From a market structure perspective, sellers remain in control, and the current upside move has not yet confirmed any trend reversal.
---
Pattern Explanation
Descending Channel (Bearish Continuation Pattern)
This pattern is defined by:
Upper trendline (red) acting as dynamic resistance
Lower trendline (yellow) acting as dynamic support
Price consistently respecting the channel boundaries
Key characteristics:
Upward moves are typically corrective in nature
A valid breakout requires a strong daily close above the upper trendline
As long as price remains inside the channel, bearish continuation has a higher probability
---
Key Levels
Resistance Zones
0.15500 – Minor resistance & recent rejection area
0.18180 – Mid-term resistance / supply zone
0.20800 – Strong resistance & early bullish confirmation
0.26550 – 0.29000 – Major resistance & upper distribution range
Support Zones
0.13500 – 0.13000 – Intraday support
0.12000 – Lower channel support
0.09500 – Major demand zone & previous low
---
Bullish Scenario
The bullish scenario becomes valid if:
Price breaks and closes above the upper descending channel
Successfully reclaims 0.15500 – 0.16000 as support
Potential upside targets:
0.18180
0.20800
0.26550
Additional confirmation:
Increasing volume on breakout
Structure shift into higher high and higher low
Without a clean breakout, upside movement should still be considered a temporary retracement.
---
Bearish Scenario
The bearish scenario remains dominant if:
Price fails to break above the upper channel
Strong rejection occurs around the 0.15500 resistance zone
Downside targets:
0.13500
0.12000
0.09500 (major support & potential technical bounce)
A breakdown below 0.12000 would strengthen bearish continuation toward lower demand zones.
---
Conclusion
DOGE/USDT remains in a technically healthy downtrend structure. As long as price stays inside the descending channel, any upside move should be treated as a pullback or sell-on-resistance opportunity.
The market bias only shifts bullish after a confirmed breakout with strong volume and a solid daily close above the channel.
#DOGEUSDT #DOGE #Dogecoin #CryptoAnalysis #TechnicalAnalysis #DescendingChannel #BearishTrend #AltcoinTrading #PriceAction #SupportResistance #Downtrend

DOGEUSDT: Bullish Push to 0.200?BINANCE:DOGEUSDT is eyeing a bullish reversal on the 4-hour chart , with price rebounding from a bottom near higher low after lower highs in a downward trendline, converging with a potential entry zone that could spark upside momentum if buyers break the downtrend amid recent consolidation. This setup suggests a recovery opportunity post-downtrend, targeting higher resistance levels with more than 1:3 risk-reward .🔥
Entry in the 0.129–0.135 range for a long position (entry at current price with proper risk management is recommended). Target at 0.200 range. Set a stop loss at a daily close below 0.115 , yielding a risk-reward ratio of more than 1:3 . Monitor for confirmation via a bullish candle close above entry with rising volume, leveraging Dogecoin's volatility near the bottom.🌟
📝 Trade Setup
🎯 Entry (Long):
0.129 – 0.135
(Entry from current price is valid with proper risk & position sizing.)
🎯 Target:
• 0.200 area
❌ Stop Loss:
• Daily close below 0.115
⚖️ Risk-to-Reward:
• > 1:3
💡 Your take?
Is DOGE preparing for a trend reversal toward 0.20, or do you expect more consolidation before the breakout? 👇

#DOGE/USDT - Only One Scenario Left: UP#DOGE
The price is moving in a descending channel on the 1-hour timeframe. It has reached the lower boundary and is heading towards breaking above it, with a retest of the upper boundary expected.
We have a downtrend on the RSI indicator, which has reached near the lower boundary, and an upward rebound is expected.
There is a key support zone in green at 0.1470. The price has bounced from this zone multiple times and is expected to bounce again.
We have a trend towards consolidation above the 100-period moving average, as we are moving close to it, which supports the upward movement.
Entry price: 0.1490
First target: 0.1500
Second target: 0.1522
Third target: 0.1550
Don't forget a simple principle: money management.
Place your stop-loss order below the support zone in green.
For any questions, please leave a comment.
Thank you.

DOGEUSDT UPDATE#DOGE
UPDATE
DOGE Technical Setup
Pattern: Falling Wedge Pattern
Current Price: 0.1237
Target Price: 0.1490
Target % Gain: 121.32%
Technical Analysis: DOGE is breaking out of a falling wedge pattern on the 1D chart, indicating bullish potential. Price is trading near the lower boundary of the wedge and has started to curl upward, suggesting a possible breakout. A confirmed move above the descending resistance trendline could open the path toward the projected upside target zone shown on the chart.
Time Frame: 1D
Risk Management Tip: Always use proper risk management.

DOGEUSDT – 4H Chart UpdateDOGEUSDT – 4H Chart Update
Still bearish, but momentum is weakening
The price is holding a strong demand zone (0.120 – 0.115) after a prolonged downtrend.
Descending trendline is being tested
Volatility compression near support → decision zone
Repeated rejections from lower levels show selling pressure exhaustion
Support: 0.120 – 0.115 (critical)
Invalidation: Below 0.112
Resistance: 0.135 – 0.150
Breakout zone: 0.160+ → opens room toward 0.20
⚠️ Extreme fear environment = patience > prediction
DYOR | NFA

#DOGE/USDT is about to blast off! Study internet bubble stocks.#DOGE
The price is moving within a descending channel on the 1-hour frame, adhering well to it, and is heading for a strong breakout and retest.
We have a bearish trend on the RSI indicator that is about to be broken and retested, which supports the upward breakout.
There is a major support area in green at 0.2520, representing a strong support point.
We are heading for consolidation above the 100 moving average.
Entry price: 0.2658
First target: 0.2727
Second target: 0.2835
Third target: 0.2947
Don't forget a simple matter: capital management.
When you reach the first target, save some money and then change your stop-loss order to an entry order.
For inquiries, please leave a comment.
Thank you.

DOGE/USDT — Market UpdateSince the last review, the structure has slightly changed.
Price has once again reached the midline of the channel, and buyers are reacting again — a bullish engulfing pattern is forming.
Last time, the bounce from the channel midline produced ~100% upside.
During the flash crash, the rebound was around 80%.
This creates a favorable risk/reward setup:
— entry at current levels,
— stop-loss below the local low,
— targets: 0.17 → 0.20 → near the downtrend resistance.

DOGE near term TARGET $0,34Dogecoin is likely on it's way to more bullish prices.
Since around 22 June, there's been a near "up-only" trend on DOGE, where the price is continuously making higher highs and the corrections are all still higher lows.
In terms of technical indicators, we see strong bullish indication in the weekly timeframe as the price trade above all moving averages:
The daily timeframe's price is trading above the moving averages as well. A good place to watch for SHORT term corrections is the first and second band of the moving averages here:
OKX:DOGEUSDT BINANCE:DOGEUSDT

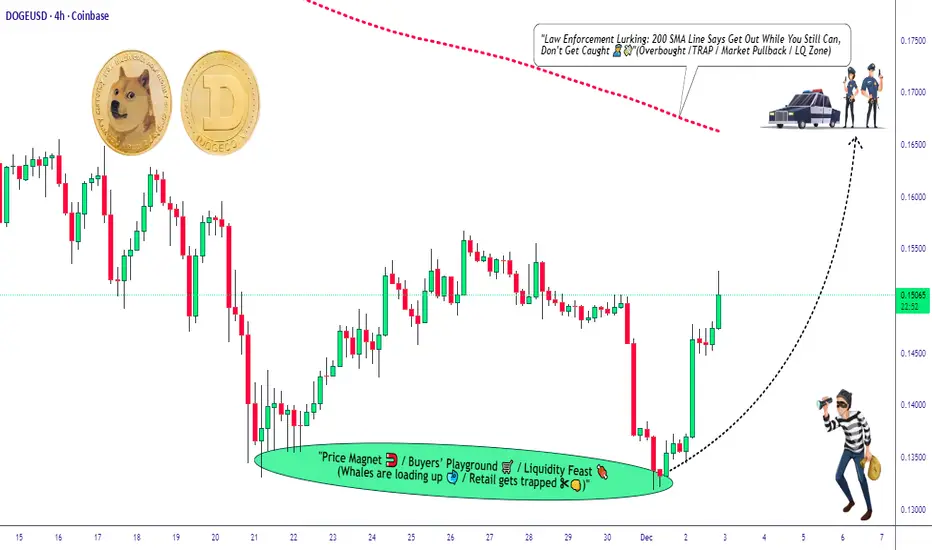
DOGE/USDT — Kijun Breakout Setup ► Bullish Swing Opportunity**📌 DOGE/USDT “DOGECOIN VS TETHER”
Crypto Market Opportunity Blueprint (Swing Trade)**
🟢 PLAN
Bullish plan activated but pending order — waiting for a clean Kijun Moving Average breakout.
This setup focuses on momentum shift + trend confirmation before entering aggressively.
🎯 ENTRY LEVEL
You can enter at any price level after the Kijun breakout @ 0.15100.
This protects you from premature entries and avoids fakeouts before trend confirmation.
🛡️ STOP-LOSS
This is Thief SL → 0.14400
Dear Ladies & Gentlemen (Thief OG’s), adjust your SL based on your strategy & your own risk.
Place SL only after the breakout confirmation, not before.
Reminder: This SL is not a mandatory one. You choose your risk. You make the money, then take the money at your rules.
🎯 TARGET
Moving Averages show strong resistance, price is near overbought zones, and potential trap zones exist — so book profits with discipline.
Our target → 0.16200
Again: This TP is optional. Use your personal exit plan based on market momentum and your risk tolerance.
📡 Related Pairs to Watch (Correlation & Key Points)
Tracking correlated pairs strengthens accuracy. Here are the most relevant:
1. BINANCE:BTCUSDT
Key Correlation:
DOGE follows BTC’s overall direction 70–80% of the time during swing phases.
A BTC breakout above major MAs often fuels memecoin rallies.
Watch for: BTC holding above its Kijun / 1H–4H cloud.
2. BINANCE:ETHUSDT
Key Correlation:
ETH strength = stronger altcoin liquidity rotation.
If ETH breaks resistance, capital flows into major alts → then into meme assets like DOGE.
Watch for: ETH bullish continuation patterns.
3. BINANCE:SHIBUSDT
Key Correlation:
Direct memecoin sector sentiment indicator.
SHIB pump = DOGE usually reacts next with lag.
Watch for: SHIB Kijun breakout or sudden volume burst.
4. BINANCE:PEPEUSDT
Key Correlation:
New-age meme liquidity leader; often front-runs meme sector volatility.
PEPE volatility spikes are usually early warning signals for DOGE momentum.
Watch for: Volume expansion + breakout candles.
5. BINANCE:LTCUSDT (Secondary correlation)
Why:
LTC acts as a secondary liquidity indicator for old-generation altcoins.
When LTC moves with speed, DOGE tends to follow in the same risk-on window.
Watch for: LTC strength above its 200 MA.
📌 Final Note
Track DOGE’s Kijun breakout, manage risk with discipline, and monitor correlated assets to stay in sync with sector momentum. This keeps your swing strategy clean, controlled, and data-driven.

Is DOGE/USD Preparing for a Major Upside Move?🚀 DOGE/USD: ULTIMATE SWING TRADE BLUEPRINT 🚀
Catch the Rocket Before Liftoff!
🔥 WHY THIS SETUP IS FIRE
BULLISH MOMENTUM building on DOGE against the USD.
Key levels aligning for a potential SWING OPPORTUNITY.
Perfect for traders looking to RIDE THE VOLATILITY with a clear plan.
🎯 TRADE PLAN (BULLISH)
Entry: ANY PRICE – Flexibility is key! Scale in strategically.
Stop Loss: THIEF SL @ 0.14000 ⚠️
(Note: I’m not your financial advisor – adjust SL based on YOUR strategy & risk tolerance. Place SL ONLY after breakout confirmation!)
Take Profit: TP @ 0.16500 ✅
SMA acting as strong resistance + overbought signals = trap zone.
Escape with profits before the pullback!
(Reminder: TP is YOUR choice – take money at your own risk!)
📌 DEAR LADIES & GENTLEMEN (THIEF OG’s) 👑
This is a BLUEPRINT – not financial advice. Adapt it to YOUR style. Your money, your rules.
🔗 RELATED PAIRS TO WATCH
$BTC/USD – Crypto king moves, DOGE often follows sentiment.
$SHIB/USD – Meme coin sibling, correlation spikes during hype cycles.
$ETH/USD – Altcoin leader, influences broader crypto momentum.
SP:SPX (S&P 500) – Risk-on/risk-off cues can impact crypto flows.
💡 KEY CORRELATION INSIGHTS
DOGE often mirrors BTC’s direction with amplified volatility.
Meme coin rallies can be sector-wide – watch SHIB for confirmation.
USD strength (DXY) inversely affects crypto – a falling DXY = crypto bullish signal.
LIKE & FOLLOW if this resonates – boosts visibility for all!
COMMENT your entry & exit strategies – let’s build knowledge together.
SHARE to help fellow traders spot the opportunity.
📈 Stay smart, trade sharp, and manage your risk!
✅ Follow for more high-impact setups.
#DOGE #DOGEUSDT #Crypto #SwingTrade #TradingView #Memecoin #Bullish #TradingStrategy #Cryptocurrency #Bitcoin #Altcoins
DOGEUSDT - Only One Scenario Left: UP After a long and painful correction, Dogecoin has finally put in what looks like a major bottom.
The downside momentum is completely exhausted, volume is drying up on the lows, and the structure is forming higher lows — all classic signs that the bear phase is done.
I no longer see any realistic bearish scenario here.
For me, there is only one direction from current levels: UP.
Bullish targets (open-ended):
1. 0.16 – 0.162 (first serious resistance)
2. 0.173+ (next major zone)
3. 0.185+ in case of real FOMO
❌Invalidation:
Only a hourly close below $0.1483 would make me reconsider the bullish bias.
Risk: Always use proper risk management!
⚠️ Disclaimer: This is not financial advice. This is just my personal technical view. Trading carries high risk — DYOR and trade at your own responsibility.
If you agree that Dogecoin is ready to run — smash that LIKE button! 🔥
Follow for more crypto calls!
Comment below: which coin should I analyse next? 👇

DOGEUSDT UPDATE#DOGE
UPDATE
DOGE Technical Setup
Pattern: Falling Wedge Pattern
Current Price: $0.151
Target Price: $0.215
Target % Gain: 41.50%
Technical Analysis: DOGE is breaking out of a falling wedge pattern on the 4H chart, showing bullish momentum building after a strong move above the resistance trendline. Price reclaimed the key support zone highlighted on the chart, confirming strength as buyers stepped in. The breakout is supported by improving structure, and the market is now aiming toward the next major resistance area near the target zone.
Time Frame: 4H
Risk Management Tip: Always use proper risk management.

DOGE/USDT - Momentum Shifts Toward the 0.105–0.093 Demand Zone?DOGE has entered one of its most decisive phases in recent months.
The chart shows the market has just lost one of its strongest technical pillars:
the primary ascending trendline that supported the entire multi-month rally.
Once that trendline broke, structure shifted from accumulation → distribution, and the momentum immediately favored the sellers.
DOGE attempted a recovery, but the retest into 0.183–0.208 was rejected aggressively, forming a classic failed bullish continuation pattern. This typically signals that market makers have chosen the lower liquidity zones as the next destination.
Price is now sitting around 0.151, caught between:
A freshly-confirmed resistance zone above, and
The major demand block at 0.105–0.093, one of the strongest historical accumulation zones on the chart.
This demand block is not random.
It is where high-volume positioning and historical liquidity clusters have repeatedly formed.
If DOGE drifts lower, this is where the next major battle will take place.
---
Key Pattern Highlights
1. Trendline Breakdown + Failed Retest
A textbook sign of a trend transition from bullish to bearish.
A failed retest often leads to a continuation selloff.
2. Consistent Lower Highs
A clear representation of seller dominance and weakening bullish momentum.
3. Deep Liquidity Wick
The long downward wick signals liquidity hunting — often occurring before price seeks a major support level.
4. Compression Toward Demand
Price structure is tightening downward, a typical sign of distribution.
---
Bullish Scenario
The bullish path is countertrend and requires strong confirmation.
Bullish structure only returns if:
1. DOGE closes above 0.183,
2. Reclaims 0.208 as support,
3. Retests the zone successfully without losing it again.
If these conditions are met, higher targets open:
0.260
0.290
0.395 (macro resistance zone)
Until then, every bounce remains a relief bounce, not a reversal.
---
Bearish Scenario
This remains the structurally dominant scenario:
1. Rejection around 0.160–0.170,
2. Breakdown below 0.148–0.140,
Opens the door toward the main target:
🎯 0.105 – 0.093 (major demand zone)
If this zone fails, DOGE may hunt liquidity as low as:
🔻 0.072 — a macro support level visible on the chart.
Because the gap between these zones is wide, downward continuation can accelerate quickly if sell volume increases.
---
> DOGE is trading below a trendline that once shaped its entire bullish structure.
The failed retest tells us the market still favors the downside.
Unless price reclaims 0.183–0.208, the primary scenario remains a continuation move toward the 0.105–0.093 demand zone — the key area that will determine whether DOGE prepares for a major rebound or extends its correction further.
---
#DOGE #Dogecoin #Crypto #TechnicalAnalysis
#PriceAction #CryptoCharts
#DemandZone #TrendlineBreak #AltcoinAnalysis
#SwingTrading #CryptoMarket

Dogecoin Forming a Macro Cup & HandleHi!
Dogecoin is developing a clear macro Cup & Handle structure, formed over several years. After the strong pole & flag rally that initiated the 2021 bull market, price spent multiple years rounding out a large cup, signaling long-term accumulation.
Price is now moving inside a descending handle, which is typical before a major breakout. A clean move above the handle’s upper trendline would confirm a continuation of the macro bullish structure.
If the handle breakout is validated, DOGE could potentially enter a multi-year expansion phase aiming toward this upper target.
The target of these patterns is around $2.80–$4.00, based on the full cup-and-handle measured move and the strength of the previous pole.

