#DOGS/USDT is currently strongly bullish#DOGS
The price is moving in a descending channel on the 1-hour timeframe. It has reached the lower boundary and is heading towards a breakout, with a retest of the upper boundary expected.
We are seeing a bearish trend in the Relative Strength Index (RSI), which has reached near the lower boundary, and an upward bounce is expected.
There is a key support zone in green at 0.0000411, and the price has bounced from this level several times. Another bounce is expected.
We are seeing a trend towards stabilizing above the 100-period moving average, which we are approaching, supporting the upward trend.
Entry Price: 0.0000421
First Target: 0.0000428
Second Target: 0.0000438
Third Target: 0.0000451
Place your stop-loss order below the green support zone.
Remember a simple principle: Money Management.
For any questions, please leave a comment.
Thank you.
Dogs

#DOGS/USDT : be careful#DOGS
The price is moving in a descending channel on the 1-hour timeframe. It has reached the upper limit and is heading towards breaking it. A retest of the upper limit is expected.
We have an upward trend on the RSI indicator, which has reached near the upper limit. A downward reversal is expected.
There is a key support zone in green at 0.0000512. The price has bounced from this zone multiple times and is expected to bounce again.
We have a trend of consolidation above the 100-period moving average, as we are moving close to it. This supports a downward move towards touching this level.
Entry price: 0.0000487
First target: 0.0000471
Second target: 0.0000460
Third target: 0.0000444
Stop loss: Above the support zone in green.
Don't forget a simple thing: capital management.
For inquiries, please leave a comment.
Thank you.

#DOGS/USDT is currently strongly bullish#DOGS
The price is moving in a descending channel on the 1-hour timeframe. It has reached the lower boundary and is heading towards breaking above it, with a retest of the upper boundary expected.
We have a downtrend on the RSI indicator, which has reached near the lower boundary, and an upward rebound is expected.
There is a key support zone in green at 0.0000392. The price has bounced from this zone multiple times and is expected to bounce again.
We have a trend towards consolidation above the 100-period moving average, as we are moving close to it, which supports the upward movement.
Entry price: 0.0000396
First target: 0.0000402
Second target: 0.0000408
Third target: 0.0000415
Stop loss: Below the support zone in green.
Don't forget a simple thing: capital management.
For inquiries, please leave a comment.
Thank you.

#DOGS/USDT is currently strongly bullish#DOGS
The price is moving in a descending channel on the 1-hour timeframe. It has reached the lower boundary and is heading towards breaking above it, with a retest of the upper boundary expected.
We have a downtrend on the RSI indicator, which has reached near the lower boundary, and an upward rebound is expected.
There is a key support zone in green at 0.0000397. The price has bounced from this zone multiple times and is expected to bounce again.
We have a trend towards consolidation above the 100-period moving average, as we are moving close to it, which supports the upward movement.
Entry price: 0.0000419
First target: 0.0000436
Second target: 0.0000466
Third target: 0.0000498
Don't forget a simple principle: money management.

#DOGS/USDT is currently strongly bullish#DOGS
The price is moving in a descending channel on the 1-hour timeframe. It has reached the lower boundary and is heading towards breaking above it, with a retest of the upper boundary expected.
We have a downtrend on the RSI indicator, which has reached near the lower boundary, and an upward rebound is expected.
There is a key support zone in green at 0.0000397. The price has bounced from this zone multiple times and is expected to bounce again.
We have a trend towards consolidation above the 100-period moving average, as we are moving close to it, which supports the upward movement.
Entry price: 0.0000432
First target: 0.0000437
Second target: 0.0000467
Third target: 0.0000503
Don't forget a simple principle: money management.
Place your stop-loss below the support zone in green.
For any questions, please leave a comment.
Thank you.

#DOGS/USDT is currently strongly bullish#DOGS
The price is moving in a descending channel on the 1-hour timeframe. It has reached the lower boundary and is heading towards a breakout, with a retest of the upper boundary expected.
We are seeing a bearish bias in the Relative Strength Index (RSI), which has reached near the lower boundary, and an upward bounce is expected.
There is a key support zone in green at 0.0000444. The price has bounced from this level several times and is expected to bounce again.
We are seeing a trend towards stabilizing above the 100-period moving average, which we are approaching, supporting the upward trend.
Entry Price: 0.0000460
First Target: 0.0000483
Second Target: 0.0000515
Third Target: 0.0000553
Remember a simple principle: Money Management.
Place your stop-loss order below the green support zone.
For any questions, please leave a comment.
Thank you.

#DOGS/USDT is currently strongly bullish#DOGS
The price is moving in a descending channel on the 1-hour timeframe. It has reached the lower boundary and is heading towards breaking above it, with a retest of the upper boundary expected.
We have a downtrend on the RSI indicator, which has reached near the lower boundary, and an upward rebound is expected.
There is a key support zone in green at 0.0000381. The price has bounced from this zone multiple times and is expected to bounce again.
We have a trend towards consolidation above the 100-period moving average, as we are moving close to it, which supports the upward movement.
Entry price: 0.0000403
First target: 0.0000433
Second target: 0.0000465
Third target: 0.0000503
Don't forget a simple principle: money management.
Place your stop-loss below the support zone in green.
For any questions, please leave a comment.
Thank you.

#DOGS/USDT is currently strongly bullish#DOGS
The price is moving in a descending channel on the 1-hour timeframe and is expected to break out and continue upwards.
We have a trend to stabilize above the 100-period moving average again.
We have a downtrend on the RSI indicator, which supports an upward move if it breaks above it.
We have a key support zone in green that pushed the price higher at 0.0000433.
Entry price: 0.0000440
First target: 0.0000453
Second target: 0.0000467
Third target: 0.0000485
For risk management, don't forget stop-loss orders and capital management.
The stop-loss is below the support zone in green.
Upon reaching the first target, take some profits and then change the stop-loss order to an entry order.
For any questions, please comment.
Thank you.

#DOGS/USDT is currently strongly bullish#DOGS
The price is moving within an ascending channel on the 1-hour timeframe and is holding well. It is poised to break out strongly and retest the channel.
We have a downtrend line on the RSI indicator that is about to break and retest, which supports the upward move.
There is a key support zone in green at 0.0000436, representing a strong support point.
We have a trend of consolidation above the 100-period moving average.
Entry price: 0.0000452
First target: 0.0000462
Second target: 0.0000476
Third target: 0.0000494
Don't forget a simple money management rule.
Place your stop-loss order below the green support zone.
Once you reach the first target, save some money and then change your stop-loss order to an entry order.
For any questions, please leave a comment.
Thank you.

#DOGS/USDT ranges for long term break out#DOGS
The price is moving within an ascending channel on the 1-hour timeframe and is adhering to it well. It is poised to break out strongly and retest the channel.
We have a downtrend line on the RSI indicator that is about to break and retest, which supports the upward move.
There is a key support zone in green at 0.0000518, representing a strong support point.
We have a trend of consolidation above the 100-period moving average.
Entry price: 0.0000531
First target: 0.0000541
Second target: 0.0000553
Third target: 0.0000570
Don't forget a simple money management rule.
Place your stop-loss order below the green support zone.
Once you reach the first target, save some money and then change your stop-loss order to an entry order.
For any questions, please leave a comment.
Thank you.

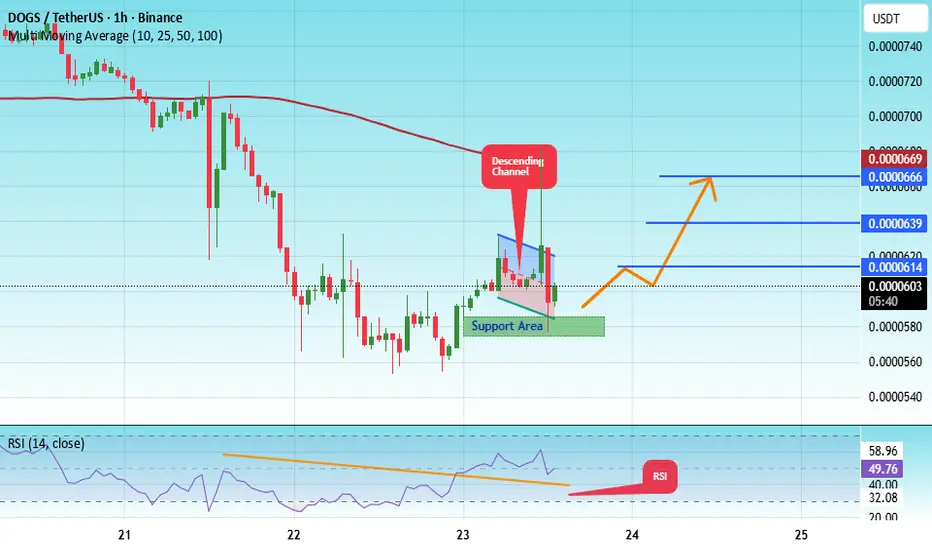
#DOGS/USDT is currently strongly bullish#DOGS
The price is moving within a descending channel on the 1-hour frame, adhering well to it, and heading for a strong breakout and retest.
We have a bearish trend on the RSI indicator that is about to be broken and retested, which supports the upward breakout.
There is a major support area in green at 0.0000577, which represents a strong support point.
We are heading for consolidation above the 100 moving average.
Entry price: 0.0000600
First target: 0.0000614
Second target: 0.0000639
Third target: 0.0000666
Don't forget a simple matter: capital management.
When you reach the first target, save some money and then change your stop-loss order to an entry order.
For inquiries, please leave a comment.
Thank you.
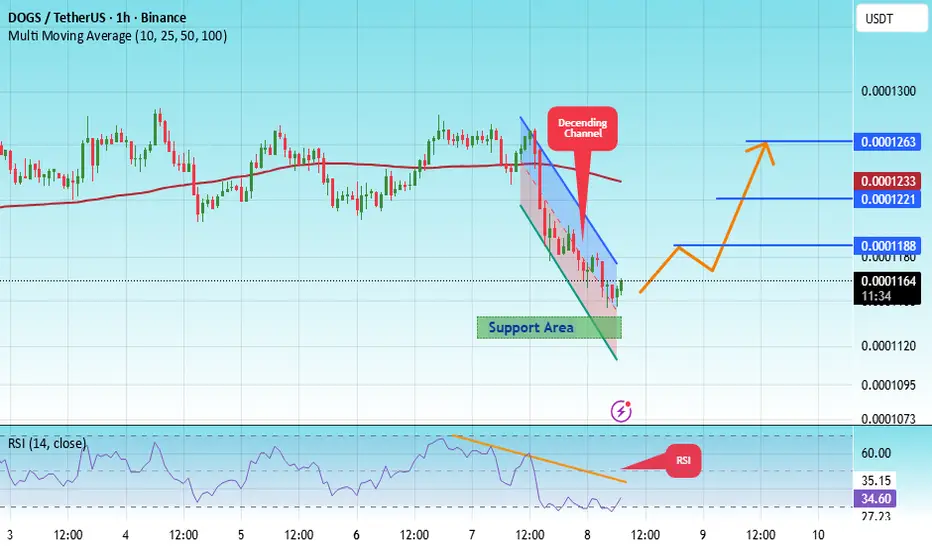
#DOGS/USDT is currently strongly bullish#DOGS
The price is moving within a descending channel on the 1-hour frame, adhering well to it, and is heading for a strong breakout and retest.
We have a bearish trend on the RSI indicator that is about to be broken and retested, which supports the upward breakout.
There is a major support area in green at 0.0001130, which represents a strong support point.
We are heading for consolidation above the 100 moving average.
Entry price: 0.0001162
First target: 0.0001188
Second target: 0.0001221
Third target: 0.0001263
Don't forget a simple matter: capital management.
When you reach the first target, save some money and then change your stop-loss order to an entry order.
For inquiries, please leave a comment.
Thank you.
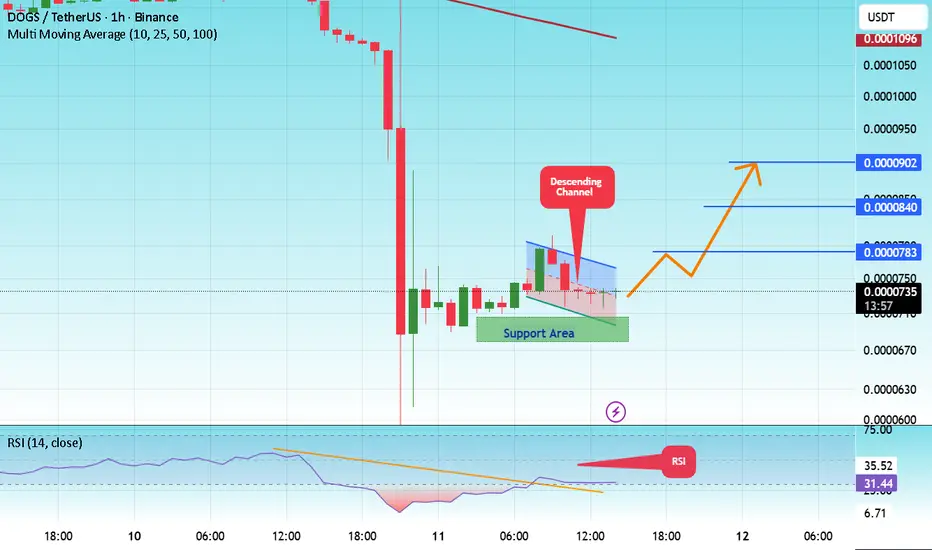
#DOGS/USDT is currently strongly bullish#DOGS
The price is moving in a descending channel on the 1-hour frame and is expected to break and continue upward.
We have a trend to stabilize above the 100 moving average again.
We have a downtrend on the RSI indicator that supports the upward move with a breakout.
We have a major support area in green that pushed the price higher at 0.0000700.
Entry price: 0.0000732.
First target: 0.0000783.
Second target: 0.0000840.
Third target: 0.0000902.
To manage risk, don't forget stop loss and capital management.
When you reach the first target, save some profits and then change the stop order to an entry order.
For inquiries, please comment.
Thank you.
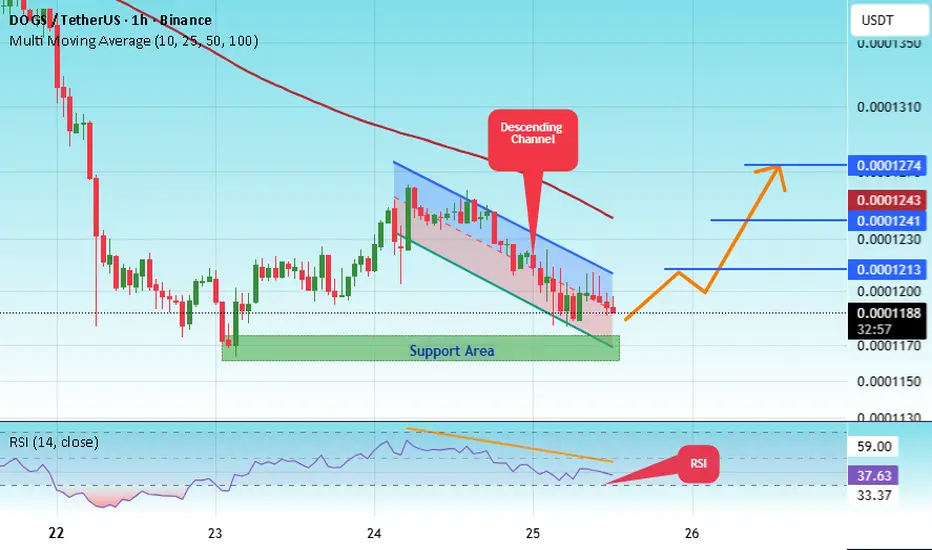
#DOGS/USDT is currently strongly bullish#DOGS
The price is moving within a descending channel on the 1-hour frame, adhering well to it, and is heading for a strong breakout and retest.
We have a bearish trend on the RSI indicator that is about to be broken and retested, which supports the upward breakout.
There is a major support area in green at 0.0001170, which represents a strong support point.
We are heading for consolidation above the 100 moving average.
Entry price: 0.0001190
First target: 0.0001213
Second target: 0.0001241
Third target: 0.0001274
Don't forget a simple matter: capital management.
When you reach the first target, save some money and then change your stop-loss order to an entry order.
For inquiries, please leave a comment.
Thank you.
DOGS; BUY OR SELL?Hello friends
Given that the price has reached the specified support and the price is supported by buyers in the specified area and the specified resistance has been broken, we can buy in steps with risk and capital management and move to the specified targets.
*Trade safely with us*

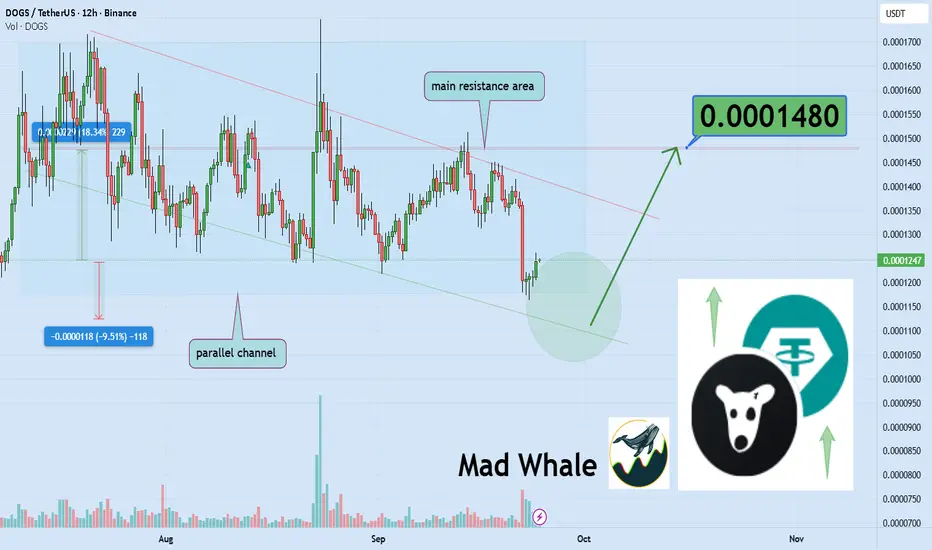
DOGS Awaits Breakout Toward 0.00014 With 18% UpsideHello✌️
Let’s analyze DOGS’s price action both technically and fundamentally 📈.
🔍Fundamental analysis:
Right now DOGS looks fragile – donations and Telegram wallet help, but it’s still down 85% this year. If BTC holds above 100K, memecoin hype could wake up again.
📊Technical analysis:
DOGS is currently testing the lower boundary of its parallel channel, holding near a key support level 📉. A successful defense here could trigger an estimated 18% rebound, with the next target set around 0.00014 USD 🚀.
📈Using My Analysis to Open Your Position:
You can use my fundamental and technical insights along with the chart. The red and green arrows on the left help you set entry, take-profit, and stop-loss levels, serving as clear signals for your trades.⚡️ Also, please review the TradingView disclaimer carefully.🛡
✨We put love into every post!
Your support inspires us 💛 Drop a comment we’d love to hear from you! Thanks, Mad Whale
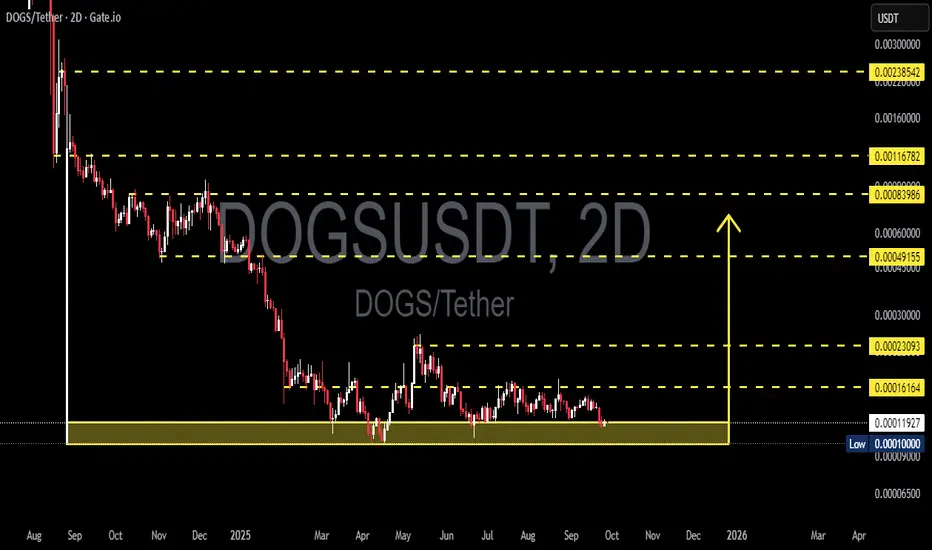
DOGS/USDT — Preparing for a Major Rebound or Deeper Breakdown?Full Analysis
DOGS/USDT is currently sitting at a critical accumulation zone between 0.00010–0.00012 USDT. This level has been tested multiple times, acting as the last stronghold for buyers. While sellers have lost some dominance, buyers still lack the conviction to confirm a full reversal.
The next decisive move will depend on whether this support holds and triggers a breakout rally, or fails and opens the door to deeper lows.
---
Key Levels to Watch
Major Support (accumulation zone): 0.00010 – 0.00012
Step-by-step Resistances:
R1: 0.00016164
R2: 0.00023093
R3: 0.00049155
Long-term resistance: 0.00083986 – 0.00238542
---
Pattern & Structure
Macro view: still trapped in a long-term downtrend (lower highs & lower lows).
Current setup: sideways consolidation around strong demand — forming a potential base accumulation.
Risk: the more times support is retested without a strong bounce, the higher the chance of a breakdown.
---
Bullish Scenario (If Accumulation Zone Holds)
1. Early confirmation: 2D close + strong volume above 0.00016164 → buyers taking control.
2. Upside targets:
TP1: 0.00016164 (confirmation breakout)
TP2: 0.00023093 (major resistance area)
TP3: 0.00049155 (potential multi-bagger level)
3. Key requirement: breakout must come with significant volume, not just a false pump.
4. Momentum boost: hype or broader altcoin market rally could accelerate upside potential.
---
Bearish Scenario (If Support Breaks Down)
1. Trigger: 2D close below 0.00010 → invalidation of accumulation zone.
2. Consequence: heavy sell pressure unleashed as psychological support breaks.
3. Downside target: previous structural low around 0.000065, or new lower lows.
4. Warning sign: repeated retests without strong rebounds signal buyer exhaustion.
---
Strategy & Risk Management
Aggressive entry: buy inside support zone 0.00010–0.00012, stop below 0.000095.
Conservative entry: wait for a clean breakout above 0.00016164 and successful retest.
Risk control: limit exposure to 1–2% of capital per trade, take profits gradually at each target, and move stop to breakeven after TP1.
---
Conclusion
DOGS/USDT is at a make-or-break moment. If the 0.00010–0.00012 support holds, a rebound toward 0.00023–0.00049 is highly possible. But if this level fails, the chart opens the path to new lows around 0.000065.
This prolonged sideways movement could turn into either a distribution phase (further downtrend) or an accumulation phase (new bullish cycle). The key lies in upcoming breakout or breakdown confirmation over the next few 2D candles.
---
DOGS/USDT (2D) — Price is consolidating at the critical accumulation zone (0.00010–0.00012).
Bullish case: breakout above 0.00016164 + volume → targets 0.00023 / 0.00049.
Bearish case: 2D close below 0.00010 → breakdown toward ~0.000065.
➡️ DOGS market is at a decisive turning point: accumulation for a rally, or distribution for lower lows.
---
#DOGSUSDT #DOGS #CryptoAnalysis #SupportResistance #Breakout #Accumulation #Altcoins #PriceAction #CryptoTrading
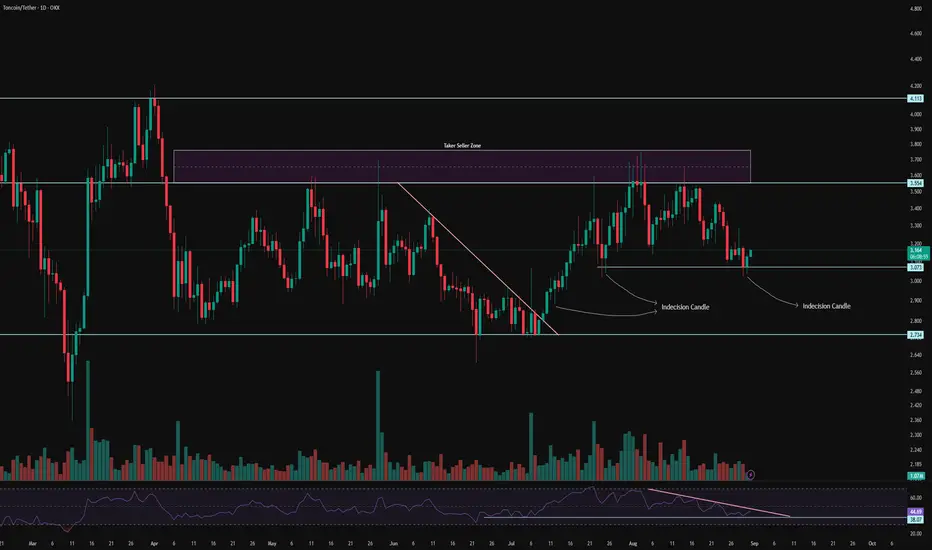
TON 1D Analysis – Key Triggers Ahead💀 Hey , how's it going ? Come over here — Satoshi got something for you !
⏰ We’re analyzing TON on the 1-Day timeframe timeframe .
👀 On the daily timeframe of Toncoin, we can see that Toncoin has very high credibility in the crypto space, and recently even Snoop Dogg and Toncoin did an NFT drop together which was amazing. Toncoin is in a range with a box structure, with the top of this box at the $3.553 area and the bottom of this box at the $2.734 area. The price of Toncoin has been fluctuating inside this price box for about 150 days so far.
⚙️ This time, since we are analyzing the beloved coin of hearts, we try to use all the technicals we know. Our key RSI level is at 38, and a descending trendline has been drawn on this oscillator as well, which shows compression and reduced volatility. This means that Toncoin can soon break out of this compressed volatility. With increased volatility in the upcoming week, Toncoin could move upward.
🕯 Looking at Toncoin’s volume in the daily timeframe, we can see that after breaking its trendline, Toncoin broke out of its compression and showed a significant increase in volume for the bullish trend. The size and volume of green candles are larger compared to the red ones, and 50% of Toncoin holders are still keeping their coins and haven’t sold. The one-day indecision candles for Toncoin have been respected by buyers and each time have pushed the price upward.
💎💰 On the daily timeframe of TONBTC, we can see that after breaking its descending trendline, Toncoin experienced an upward trend and moved 25% higher, then it was rejected from the seller ticker area and moved toward the midline of its box. From this area, it has been supported by two indecision candles, but a compressed range structure has formed. With a breakout from this compression, Toncoin can experience other price levels.
🔔 To determine the alert zones for Toncoin, we look at the 4-hour multi-timeframe. On the 4-hour timeframe of Toncoin, we can see that a short-term resistance has formed at the $3.177 price level. With a breakout of this area, Toncoin can experience a short-term price recovery. This area seems to be a good level to observe price behavior.
❤️ Disclaimer : This analysis is purely based on my personal opinion and I only trade if the stated triggers are activated .
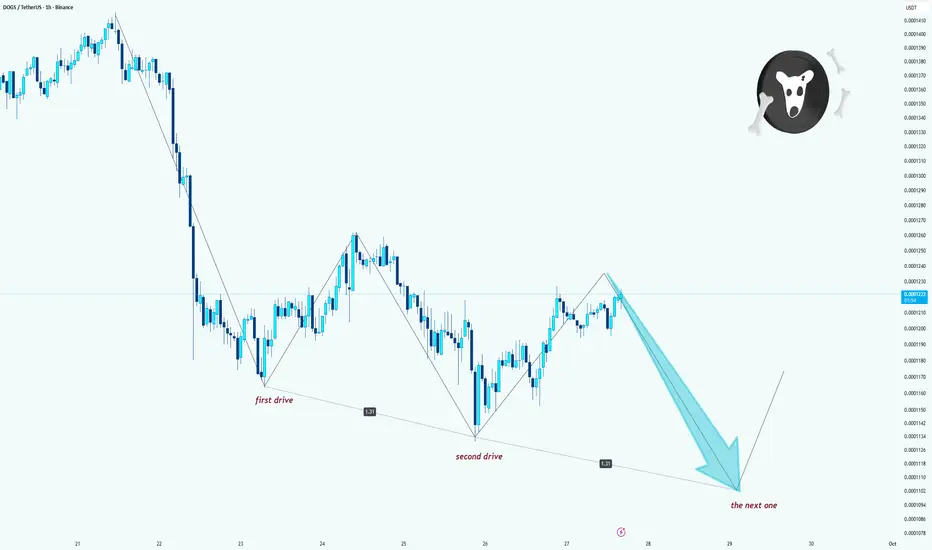
DOGS/USDT – Three Drives PatternHello guys!
The chart is shaping into a classic three-drives pattern.
We already saw the first drive and the second drive, complete with similar extensions.
Now, the market seems to be setting up for the third drive lower, which could push the price into the 0.000110 – 0.000115 area.
If this structure works out, that zone may provide a potential reaction or reversal point. For now, momentum remains bearish until the third leg completes.
Plan:
Bearish bias short-term, looking for the next drive to the downside.
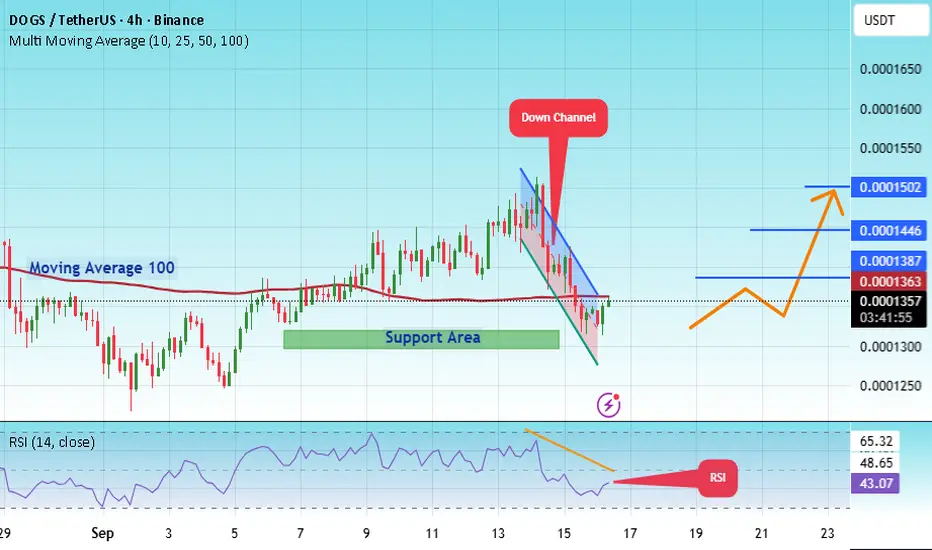
#DOGS – Launchpad or Breakdown?
#DOGS
The price is moving within a descending channel on the 4-hour frame and is expected to break and continue upward.
We have a trend to stabilize above the 100 moving average once again.
We have a downtrend on the RSI indicator that supports the upward break.
We have a support area at the lower boundary of the channel at 0.0001322, acting as strong support from which the price can rebound.
We have a major support area in green that pushed the price upward at 0.0001306.
Entry price: 0.0001360.
First target: 0.0001387.
Second target: 0.0001447.
Third target: 0.0001504.
To manage risk, don't forget stop loss and capital management.
When you reach the first target, save some profits and then change the stop order to an entry order.
For inquiries, please comment.
#DOGS/USDT – Launchpad or Breakdown?#DOGS
The price is moving within a descending channel on the 1-hour frame and is expected to break and continue upward.
We have a trend to stabilize above the 100 moving average once again.
We have a downtrend on the RSI indicator that supports the upward break.
We have a support area at the lower boundary of the channel at 0.0001322, acting as strong support from which the price can rebound.
We have a major support area in green that pushed the price upward at 0.0001306.
Entry price: 0.0001360.
First target: 0.0001387.
Second target: 0.0001447.
Third target: 0.0001504.
To manage risk, don't forget stop loss and capital management.
When you reach the first target, save some profits and then change the stop order to an entry order.
For inquiries, please comment.
Thank you.

DOGS SIGNALHello friends
Given the decline we had, the price has been trading in a range for a long time in a support area.
You can see that once the buyers attacked the ceiling of the range, but they were met with a reaction from the sellers and the price could not break the range and fell to the bottom of the range. Now that the buyers are raising the price again, it remains to be seen whether they can break the ceiling of the range, which is also an important resistance, or not?
If they manage to break the range, the price can move to the specified ranges.
*Trade safely with us*
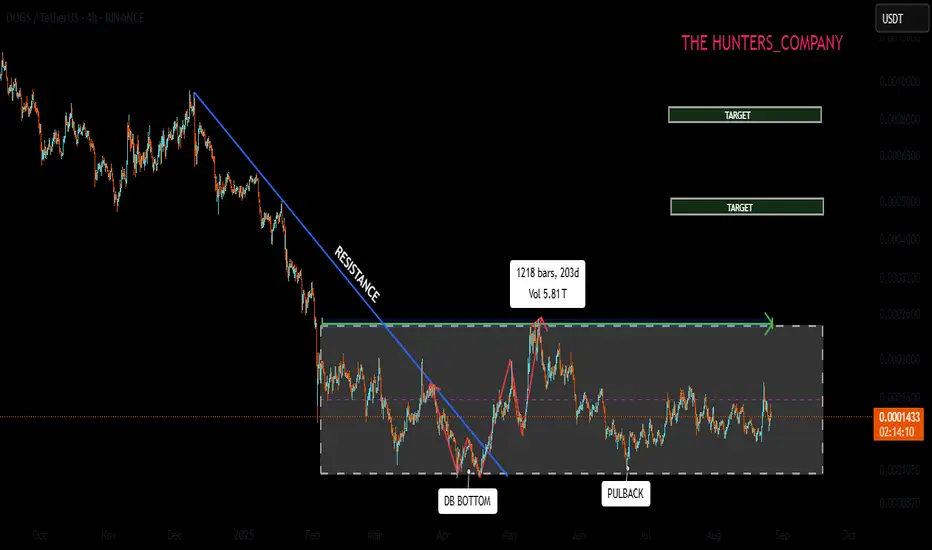
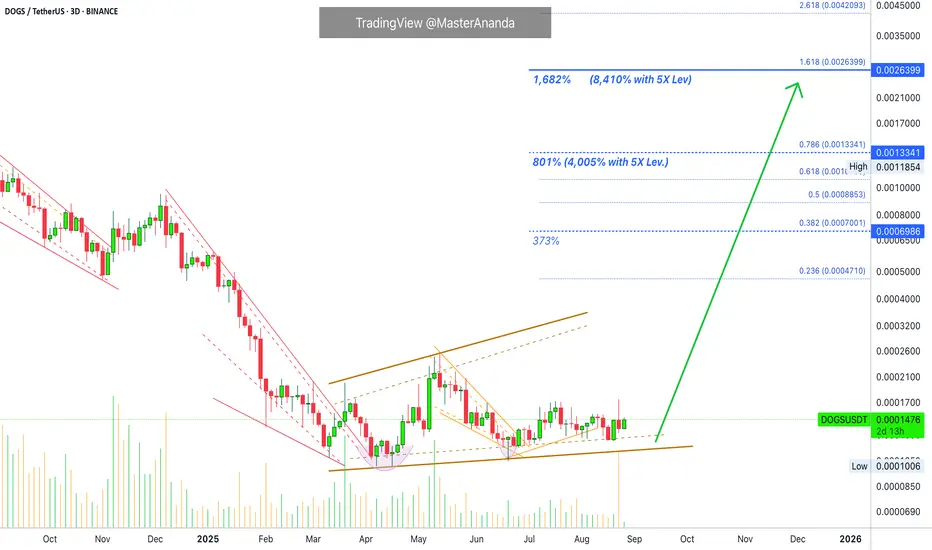
Dogs · The Bottom Structure · Accumulation Continues But...Notice here how DOGSUSDT continues to trade long-term at bottom prices. Notice how on 23-August the highest volume since March came up. Notice how there are always big green buying days but no significant big red selling days, when it comes to volume.
The action at bottom range has now been ongoing for 205 days, almost 7 full months. This is a very long accumulation period.
Consider, 205 days the market going sideways, at the bottom and yet no new lows. This reveals always that the bearish cycle ended a long time ago. The market is in a process of transition. Once this period of accumulation ends, Dogs is going up. This is obvious and easy to predict but, I am sharing this now because the breakout is getting close.
At one point we spot the bottom and start to prepare. Then we see the transition and start to buy and accumulate. Then we see the breakout is getting close, at this point, we step up our game and go LONG.
Whatever way you choose to approach the market, know that Crypto is going up. The proof comes again from this chart. From the bottom we grow. As DOGS grow, watch for many other projects do the same.
Those trading at resistance will not crash, these will continue to consolidate just to move higher. The entire altcoins market is set to produce a strong advance. It is getting better but my patience continues to be tested. I rather just wait. It is so easy and so profitable... Let's trade.
Namaste.