DXY - Gann Square of Nine Chart DailySome price and time projections using june to dec solstice time period via gann square of nine method
Support at 96.338; 94.448; 92.143; 89.515
Resistance at 97.905; 99/058; 99.887; 100.302; 100.348; 100.902; 101.731; 102.884; 104.451; 106.342
Dollar_index

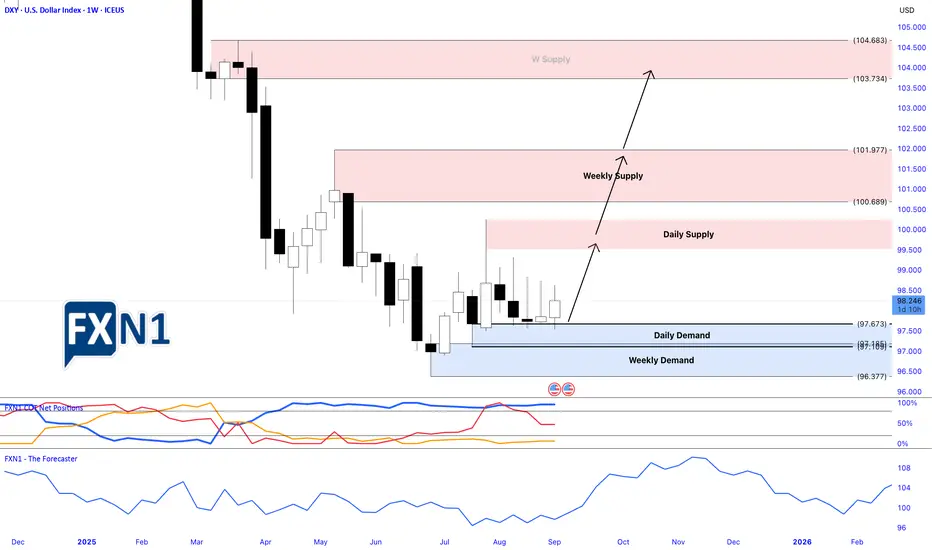
U.S. Dollar Index (DXY) – Daily / Long-Term OutlookThe U.S. Dollar Index is currently trading at a major long-term demand zone, holding above the key support around 96.25–98.20. This area has historically acted as a strong reaction zone, and price is showing signs of base formation after an extended corrective phase.
Structurally, DXY previously completed a strong impulsive rally toward the 114.87 resistance (real algo level) before entering a prolonged distribution and decline. The recent selloff appears corrective rather than trend-ending, as price has now begun to respect an ascending trendline, suggesting early signs of bullish re-accumulation.
The projected path highlights a potential higher-low structure, followed by a gradual bullish expansion. A sustained move above the psychological 100–102 zone would confirm momentum shift, opening the door for a retest of the 110 SMT resistance, and ultimately a push back toward the 114.87 major high.
As long as price holds above the 96.25 support and continues to print higher lows, the long-term bullish bias remains valid. A clean break below this support would invalidate the bullish scenario and signal further downside risk.

Dollar Index Respects Trend Support — Buyers in Control💵 DXY DOLLAR INDEX | Swing Trade Setup 📊
Strategic Bullish Recovery with Multi-Layer Entry Strategy
📈 CURRENT MARKET STATUS
Current Price: 98.02 - 98.36 USD 📍 | Bias: BULLISH SWING TRADE 🟢 | Timeframe: 4H-Daily Swing Trade ⏰ | Market Condition: Pullback to Support Zone 💪
🎯 TECHNICAL SETUP
Plan: Bullish breakout from triangular moving average pullback with strong support confirmation from the 97.50-97.90 demand zone. 📉➡️📈
📍 MULTI-LAYER ENTRY STRATEGY (Thief Strategy)
Using Limit Order Layering - Scale-In Approach for Risk Management
Utilize multiple buy limit orders to reduce entry risk and maximize fill probability:
🔵 Layer 1 @ 97.60 📍 - 30% Position Size - Initial Entry at Strong Support ✅
🔵 Layer 2 @ 97.70 📍 - 30% Position Size - Secondary Level Confirmation ✅
🔵 Layer 3 @ 97.80 📍 - 25% Position Size - Tertiary Entry Momentum Build 📈
🔵 Layer 4 @ 97.90 📍 - 15% Position Size - Final Layer Aggressive Entry 🚀
✅ Pro Tip: Adjust layer prices based on your risk tolerance and account size. Scalable entry reduces overall trade risk and improves entry quality significantly. 💡
🛑 STOP LOSS
🔴 Hard SL @ 97.50 📍 - Below demand zone for protection 🛡️
📊 Risk: -50 pips maximum per trade 📉
⚠️ NOTE: Stop loss placement is your personal risk decision. Dear Ladies & Gentleman (Thief OG's) - Manage your own risk parameters accordingly. This is YOUR choice, YOUR responsibility, YOUR profit or loss. 🎯
🎁 PROFIT TARGETS
🟢 Target 1 (Easy Win) @ 98.30 📍 - +50 pips 💰 - Take 25% profit and lock in gains immediately ✅
🟢 Target 2 (Main Target) @ 98.60 📍 - +80 pips 💵 - Take 40% profit at moving average resistance zone 📊
🟢 Target 3 (Extended) @ 98.80 📍 - +100 pips 🤑 - Trailing stop on remaining 35% position for momentum capture 🚀
🟢 Target 4 (Aggressive) @ 99.00+ 📍 - +130+ pips 🎊 - Let your winners run with intelligent trailing stops for maximum profit 📈
⚠️ NOTE: High voltage electric gate acts as STRONG RESISTANCE + overbought zone detected at 98.50-98.70. This is a potential market TRAP zone - please take profits responsibly and don't get greedy. Final TP is YOUR personal choice based on YOUR strategy and risk appetite. 🎲
💡 TECHNICAL ANALYSIS BREAKDOWN
Bullish Confluence Factors ✅:
✅ Strong support from 97.50-97.90 demand zone (Historical reaction area proven) 📍
✅ Triangular moving average confirmation (Key technical indicator) 📊
✅ Pullback from overbought conditions (Healthy correction setup) 🔄
✅ Potential base formation pattern (Accumulation zone visible) 🏗️
⚡ 52-week range: 96.22 - 110.18 (Plenty of room for upside movement) 📈
Risk Factors to Monitor ⚠️:
⚠️ Overbought signals at 98.50-98.70 (Strong resistance overhead) 🚧
⚠️ Market trap potential (Price rejection very possible) 🪤
⚠️ Thin year-end trading volumes (Additional volatility risk) 📉
🌍 RELATED PAIRS TO WATCH (Dollar Correlation Analysis)
HIGH NEGATIVE CORRELATION 🔴 (Inverse to DXY - If DXY up, these go down):
🔗 EUR/USD - Correlation: -0.95 ⚡ (STRONGEST HEDGE PAIR) - EUR is 57.6% of DXY weight, watch for BrexitNews & ECB statements 📢
🔗 Gold (XAUUSD) - Correlation: -0.90 ⚡ (Safe-haven inverse) - Precious metals rise when USD weakens, strong economic indicator 💛
🔗 Crude Oil (XTIUSD) - Correlation: -0.75 ⚡ (Commodity proxy) - Weaker dollar = higher oil prices, OPEC decisions matter 🛢️
🔗 Silver (XAGUSD) - Correlation: -0.88 ⚡ (Precious metals) - Follows gold closely but with more volatility, watch industrial demand 🏭
🔗 Bitcoin (BTCUSD) - Correlation: -0.65 ⚡ (Crypto hedge) - Dollar weakness = crypto strength, watch Fed policy closely 🪙
OTHER MAJOR PAIRS 📊 (Direct constituents of DXY Index):
🔗 USD/JPY - DXY Weight: 13.6% 📊 - Currently 156.44 - Watch BOJ (Bank of Japan) statements + Yen carry trades 🇯🇵
🔗 GBP/USD - DXY Weight: 11.9% 📊 - Brexit dynamics remain + BoE policy movements important 🇬🇧
🔗 USD/CAD - DXY Weight: 9.1% 📊 - Oil-sensitive pair, commodity correlations + BoC rate decisions 🇨🇦
🔗 USD/SEK - DXY Weight: 4.2% 📊 - Nordic economy barometer + Riksbank policy 🇸🇪
🔗 USD/CHF - DXY Weight: 3.6% 📊 - Safe-haven currency pair, SNB decisions matter 🇨🇭
📰 FUNDAMENTAL FACTORS & ECONOMIC DRIVERS
🔴 HIGH IMPACT CATALYSTS (Coming Up)
📌 FOMC Minutes Release ⏰ - CRITICAL for USD direction 🚨 - Expected guidance on 2026 rate cuts (2 cuts currently priced in by markets) 📉 - Dovish bias would support DXY weakness, hawkish would support strength 📊
📌 Fed Chair Announcement (Early January 2026) - Trump administration to announce Powell's successor 👔 - Market uncertainty = potential big USD volatility swings 💥 - Could change entire policy expectations for 2026 🎯
📌 US Non-Farm Payroll (NFP) (First Friday of Each Month) 👥 - Strong employment data = Bullish for USD 📈 - Weak employment data = Bearish for USD 📉 - Previous trend showing mixed signals, watch closely 🔍
📌 US CPI Release (Mid-month Inflation Data) 📊 - Inflation currently at 2.7% (Dec 18, 2025 data) 📍 - Below Fed target of 3%, supports rate-cut narrative 🎯 - This weakens USD support structure 📉
📌 US Pending Home Sales 🏠 - Already jumped +3.3% in November = Bullish economic indicator ✅ - Consumer strength supports USD flows 💪
🟠 MACRO HEADWINDS PRESSURING DXY (Current Environment)
💨 2025 Dollar Decline - Already down -9.6% year-to-date (worst year since 2017!) 📉 - This is a major structural weakness signal for USD
💨 Trump Tariff Uncertainty - Aggressive tariff policies creating significant dollar weakness 📉 - Protectionism narrative reduces USD safe-haven demand 🚫
💨 Fed Independence Concerns - Political pressure on Federal Reserve reduces hawkish USD support 📢 - Powell successor uncertainty adds volatility 🎲
💨 Rate Differential Narrowing - Other central banks holding rates higher relative to US expectations 📊 - Makes USD less attractive on yield basis 💰
💨 Fiscal Deficit Concerns - US government spending pressures mounting 🏛️ - Structural USD weakness risk for 2026 ⚠️
🟢 BULLISH DXY FACTORS (Supporting Our Trade)
💪 Stronger GDP - Q3 GDP data came in strong, showing economic resilience 📈 - Manufacturing sector showing signs of recovery 🏭
💪 Labor Market Resilience - Despite recent volatility, employment remains relatively stable 👥 - Fewer major job losses than expected 📊
💪 Safe-Haven Demand - Geopolitical tensions support USD flows into safe assets 🛡️ - Middle East conflicts, Russia-Ukraine ongoing ⚠️
💪 Real Yield Attractiveness - US 10Y Treasury yield at 4.13% is attractive vs. peer nations 💰 - Investors seeking better returns flowing to USD 📈
💪 Month-End Flows - Potential technical bounces from dollar repositioning happening now 📊 - Year-end rebalancing creates support zones 🎯
📊 HISTORICAL CONTEXT & KEY LEVELS
🔵 96.22 - 52-week LOW (October 2025) - Major support zone 📍
🔵 97.50-97.90 - DEMAND ZONE (Our current trade setup area) ✅ - Strong historical reaction level 📊
🔵 98.30-98.70 - RESISTANCE ZONE (Strong overbought area with trap potential) 🚧 - Take profits here, don't be greedy 💡
🔵 99.00 - Psychological round number resistance 📍 - Major price target for aggressive traders 🎯
🔵 110.18 - 52-week HIGH (February 2025 event-driven spike) - Distant target for extended bull 🚀
🎲 RISK MANAGEMENT CHECKLIST (Must Do)
✅ Only risk 1-2% of your account per single trade 💰 - Never go all-in, always protect capital 🛡️
✅ Use stop loss without ANY exceptions 🛑 - No emotional decisions, pre-set your exit 📍
✅ Scale into positions with limit orders 📊 - Don't chase market price, let price come to you 🎯
✅ Monitor FOMC announcements closely 📢 - Set alerts for important economic releases 🔔
✅ Watch geopolitical news (Fed, Trump statements) 📰 - Breaking news can reverse markets instantly ⚡
✅ Take profits at resistance levels 💹 - Lock in gains, don't let winners turn into losers 📈
✅ Don't add to losing positions 🚫 - Patience is key, better opportunities always come 🎯
✅ Keep detailed records of all entries/exits 📝 - Track your performance and improve continuously 📊
⚡ TRADE PLAN SUMMARY
🎯 Setup: Swing trade LONG on DXY from demand zone 97.50-97.90 📍
🎯 Entry Method: 4-layer limit order strategy (Scale-in approach recommended) 📊
🎯 Stop Loss: Hard stop at 97.50 (No exceptions, no moving it) 🛑
🎯 Profit Targets: 98.30 (T1) → 98.60 (T2) → 98.80 (T3) → 99.00+ (T4) 🎁
🎯 Risk/Reward Ratio: Approximately 1:1.6 to 1:2.6 depending on which layer you enter 💹
🎯 Timeframe: 4H-Daily swing trade (3-7 trading days typical duration) ⏰
🎯 Conviction Level: MEDIUM-HIGH (Technical confluence + demand zone + economic setup) 📈
🟢 PROBABILITY EDGE SUMMARY
This setup combines multiple confluence factors for higher probability:
📊 Technical Setup - EMA pullback + demand zone confirmation
🏗️ Structural Setup - Triangular pattern + base formation
😊 Sentiment Setup - Oversold conditions creating bounce opportunity
📈 Fundamental Setup - Rate expectations + economic data supporting
Estimated Win Rate: 55-60% (Based on confluence factors, not guaranteed) 📈
Risk/Reward Ratio: Minimum 1:2.0 target recommendation 💰
Best Trading Sessions: New York + London overlap (9am-12pm EST) ⏰
💬 FINAL THOUGHTS FOR TRADERS
Dear Ladies & Gentleman (Thief OG's) 🎩 - This is a carefully crafted setup based on real market data and technical confluence. However, markets are always unpredictable. Your discipline in following your trading plan matters MORE than being right 100% of the time.
Trade responsibly. Manage your risk. Take your profits. Protect your capital. 💪
The best traders aren't the ones who win every trade - they're the ones who survive and profit over time through disciplined risk management and emotional control. 🎯
Good luck traders! May your profits flow like the currency you're trading! 📈💰
Remember: Your broker, your rules. Your strategy, your risk. Adjust all levels to match YOUR trading plan perfectly. ✅

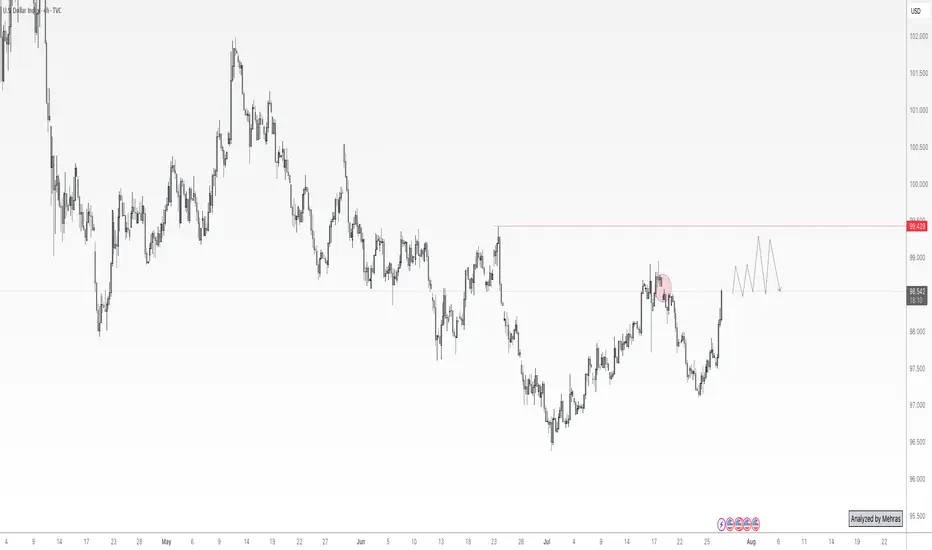
DXY Bullish Continuation Inside Ascending ChannelThe U.S. Dollar Index is trading within a clear ascending channel showing a sustained bullish structure after forming a strong low near 97.87. Price respected the lower trendline and printed multiple CHoCH and BOS signals confirming a shift from bearish to bullish momentum. Currently DXY is consolidating around 98.62–98.65 holding above the key 0.382–0.5 Fibonacci retracement zone which acts as a strong demand area.
The recent pullback looks corrective targeting liquidity before continuation. As long as price holds above 98.20–98.30 the bias remains bullish with upside targets toward the weak high near 99.00–99.20 aligned with the -0.382 and -0.618 Fibonacci levels. A clean breakout above this zone could accelerate further upside while a breakdown below channel support would weaken the bullish outlook.
Note
Please risk management in trading is a Key so use your money accordingly. If you like the idea then please like and boost. Thank you and Good Luck!

Dollar Index at Critical Support — Is a Big USD Rally Coming?Today I want to analyze the DXY index( TVC:DXY ) for you, which is one of the key indices in the financial markets.
At the moment, the DXY index is moving near a support zone($98.85-$98.50), Monthly Support (1) level, and the 21_SMA(Weekly).
In addition, the DXY has been trending inside a descending channel for roughly the past 13 trading days.
The main question is whether the DXY can break below this confluence of support levels or not.
Looking at the 4-hour chart, we can identify a Morning Star candlestick reversal pattern, and there is also a clear bullish Regular Divergence (RD+) between the last two lows.
Moreover, the US 10-Year Government Bond Yield ( TVC:US10 ) appears bullish in my view — and its upward movement can potentially support a rise in the DXY as well.
From my perspective, the best currency pairs to capitalize on a stronger USD are USDJPY( FX:USDJPY ) and EURUSD( FX:EURUSD ).
We should also keep in mind that several important US economic indicators will be released this week, which could significantly impact market direction. So be extra cautious with your positions, especially during data releases:
JOLTS Job Openings➡️09 December
Federal Funds Rate➡️10 December
FOMC Statement➡️10 December
FOMC Press Conference➡️10 December
Unemployment Claims➡️11 December
I expect that once the DXY breaks above the upper line of the descending channel, it could at least move toward one of the higher Fibonacci levels.
Do you think the U.S. interest rate will be cut this week?
💡 Please respect each other's opinions and express agreement or disagreement politely.
📌U.S. Dollar index Analysis (DXYUSD), 4-hour time frame.
🛑 Always set a Stop Loss(SL) for every position you open.
✅ This is just my idea; I’d love to see your thoughts too!
🔥 If you find it helpful, please BOOST this post and share it with your friends.

DXY: The Dollar Isn’t Done Talking YetDXY, I’ve been staring at the Dollar long enough to notice something important: this isn’t a random bounce. After months of digestion and frustration on both sides of the trade, DXY looks like it’s quietly regaining control. The tape is no longer just reacting to single data prints. It’s responding to a broader realization that the Fed may cut rates, but not in a way that collapses the dollar story. This chart feels less like noise and more like a setup.
Current Bias
Bullish, with confirmation pending.
DXY has spent most of the year consolidating after a deep pullback and now appears to be breaking higher from a rising structure. Momentum is rebuilding as the market reassesses how aggressive Fed easing will really be.
Key Fundamental Drivers
The dominant driver remains relative monetary policy expectations. While the Fed is expected to cut, markets are increasingly dialing back the idea of rapid or deep easing. US growth is slowing but holding up better than Europe and parts of Asia. Labor markets are softening but not collapsing, keeping the Fed cautious rather than urgent. This supports USD resilience.
At the same time, other major central banks look more constrained. The ECB and BoE face weaker growth backdrops, and the BoJ’s normalization path remains slow and fragile, which limits sustained USD downside versus JPY.
Macro Context
Interest rate differentials still matter. Even with Fed cuts priced, US real yields remain relatively attractive. Global growth remains uneven, with Europe stagnating, China stabilizing but not accelerating, and the US still outperforming at the margin.
Commodity flows also matter here. A firm dollar tends to weigh on commodities and commodity-linked currencies, reinforcing feedback loops into AUD, NZD, and CAD. Geopolitical risk remains a background bid for USD, especially as markets remain sensitive to trade policy, Middle East tensions, and shifting US election rhetoric.
Primary Risk to the Trend
The biggest risk is overconfidence in the Fed staying behind the curve. A sharp deterioration in US labor data or a sudden drop in inflation could force the Fed into a faster easing cycle, undermining the yield support for USD and invalidating the bullish structure.
Most Critical Upcoming News/Event
The next cluster of US inflation data, labor market releases, and Fed communication is critical. Markets are watching for confirmation that cuts will be measured, not panicked. Any clear Fed pushback against aggressive easing expectations would strongly support this DXY breakout.
Leader/Lagger Dynamics
DXY is a leader.
When DXY moves with intent, it drags the rest of FX with it. Strength here typically pressures EURUSD, AUDUSD, NZDUSD, and gold, while reinforcing downside risks in USDJPY pullbacks and risk-sensitive assets. If DXY follows through, expect confirmation across USD pairs rather than divergence.
Key Levels
Support Levels:
98.20–98.50 (structure support and trend retention zone)
96.20 (major downside invalidation level)
Resistance Levels:
100.00 (psychological and structural resistance)
102.00–103.00 (measured move resistance if momentum accelerates)
Stop Loss (SL):
Below 96.20 on a daily close, which would signal a failed structure and broader USD weakness.
Take Profit (TP):
First objective near 102.00, with extended upside toward the prior highs near 109–110 if macro conditions align.
Summary: Bias and Watchpoints
The bias for DXY is cautiously bullish. The structure suggests accumulation rather than distribution, supported by relative growth resilience, steady real yields, and a Fed that remains careful, not desperate, to cut. The key risk is a sudden shift toward aggressive Fed easing driven by weak inflation or labor data. Until that happens, dips look corrective rather than trend-ending. As a leader asset, DXY’s next move is likely to ripple across major FX pairs, commodities, and risk sentiment. If this breakout holds, the dollar conversation is far from over.

DXY Bullish Outlook | SMA Pullback + Breakout Confirmation🚀 DXY BULLISH SWING SETUP: SMA PULLBACK CONFIRMED! | Key Levels & Correlated Pairs 📈
🎯 Trade Idea: Bullish Swing on DXY (US Dollar Index)
📊 Asset: TVC:DXY | Timeframe: 4H & Daily
🔥 Strategy: Simple Moving Average Pullback + Resistance Breakout Confirmation
⚡ ENTRY PLAN:
Trigger: Break & close above 99.900 resistance
Ideal Entry: Any pullback toward 99.700-99.850 after breakout
Confirmation: Price holding above SMA support (adjust to your preferred period)
🛑 STOP LOSS (RISK MANAGEMENT):
Reference level: 99.300
👑 Dear Trading Family (Thief OGs) – This is MY protective stop. PLEASE adjust based on YOUR risk tolerance and strategy. I am not responsible for your SL/TP decisions. Manage your own risk!
✅ TAKE PROFIT TARGETS:
Primary TP: 100.900 (Strong confluence: SuperTrend ATR resistance + overbought zone potential trap)
Partial take profits advised along the way
🧠 Reminder: You can take money at YOUR own discretion. Not financial advice!
📈 RELATED PAIRS TO WATCH & CORRELATIONS:
FX:EURUSD – Inversely correlated (~57.6% weight in DXY). DXY up = EURUSD down.
FX:GBPUSD – Negative correlation. Strong dollar pushes GBPUSD lower.
FX:USDJPY – Positive correlation. DXY bullish = USDJPY often rises.
OANDA:XAUUSD (Gold) – Typically inverse to dollar strength.
TVC:USOIL (Crude) – Dollar up can pressure oil prices (denominated in USD).
🔍 KEY POINTS:
Watch for USD strength across majors to confirm DXY momentum
If DXY rallies, expect EURUSD & GBPUSD to show sell setups
Always correlate with Fed policy expectations & US economic data
📌 DISCLAIMER:
This is my personal analysis, not financial advice. Trade at your own risk. You are responsible for your own decisions.
Let’s get this bread! 🍞 If you find this helpful, drop a like 👍, follow for more ideas, and share your thoughts in the comments!
#DXY #USDollar #TradingSetup #SwingTrading #ForexTrading #MarketAnalysis #TradingView #FX #RiskManagement #ThiefOGs
Dollar Index Bearish Trend Continuation From Marked ResistancesH1 - Bearish Trend in play
Two Solid Resistance Levels
Trend continuation very likely after pullback.

DXY Breakout Confirmed — How Far Can Bulls Run?💰 Thief’s Heist: DXY Bull Raid in Progress ⚡ Layered Entry Strategy!
📈 Setup Summary
Asset: DXY Dollar Index (Cash)
📊 Bias / Plan: BULLISH — 0.786 Triangular Moving Average was breached by buyers → trend confirmation in progress 🚀
🎯 Thief’s Game Plan (Swing / Day Trade)
🕵️ Entry Plan — “Layered Thief Style”:
💎 Any price level entry is valid — flexibility is the Thief’s advantage!
🔹 Sample Limit Layers:
• 97.800
• 98.000
• 98.200
(💡 You can increase or reduce layers based on your own style — stack smartly!)
🧨 Stop Loss (Thief SL):
⚠️ 97.400 → This is the “Thief SL Zone”
👉 But you’re the mastermind — set your own SL if you prefer!
💰 Target Zone (TP):
🚧 Police Barricade at ~99.400 — strong resistance area + oversold trap likely
💨 Thieves escape with bags before the trap closes!
⚙️ Take profit partially or fully at your own comfort — be swift, be smart 🦅
🧩 Market Insight & Technical Reasoning
✅ 786 Triangular MA breach confirms bullish structure
✅ DXY strength often follows Treasury Yield push 📈
✅ Strong USD = Weak Gold & EUR/USD usually
✅ Oversold readings hint buyers ready to counter attack
🔗 Correlation Watchlist (Related Pairs)
Keep an eye on these for confirmation 🔍
💶 FX:EURUSD → usually inverse to DXY
💷 FX:GBPUSD → tracks EUR/USD correlation
💴 FX:USDJPY → directly correlates with DXY
🥇 Gold ( OANDA:XAUUSD ) → moves opposite to DXY
💵 TVC:US10Y Yields → rising yields = bullish DXY
💡 Key Tip:
When EUR/USD & GBP/USD drop sharply + yields rise → DXY often continues its rally 🧭
⚠️ Notes & Thief Disclaimers
👑 Dear Ladies & Gentlemen (Thief OGs):
I’m not recommending my SL or TP — make your own risk rules 💼
You can make money, take money, or just watch the play unfold 🎭
This is a “Thief Style” strategy, shared for fun & educational inspiration only 🧠
Always manage risk & protect capital first — thieves survive by escaping, not over-staying 💨
✨ “If you find value in my analysis, a 👍 and 🚀 boost is much appreciated — it helps me share more setups with the community!”
Disclaimer: this is thief style trading strategy just for fun
#DXY #USDIndex #Dollar #Forex #LayeredEntry #SwingTrade #DayTrade #ThiefStrategy #TrendBreak #SmartMoney #TechnicalAnalysis #USD #TradingView #FXStrategy
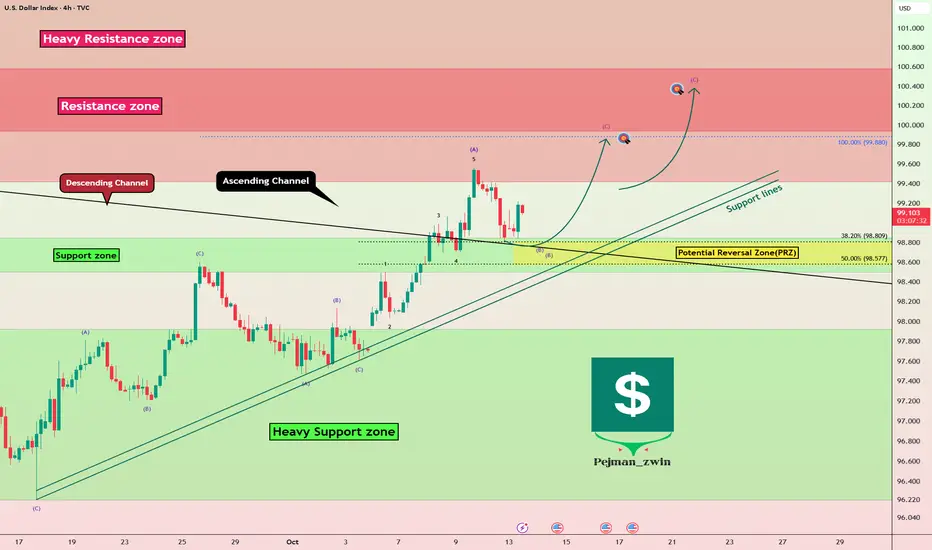
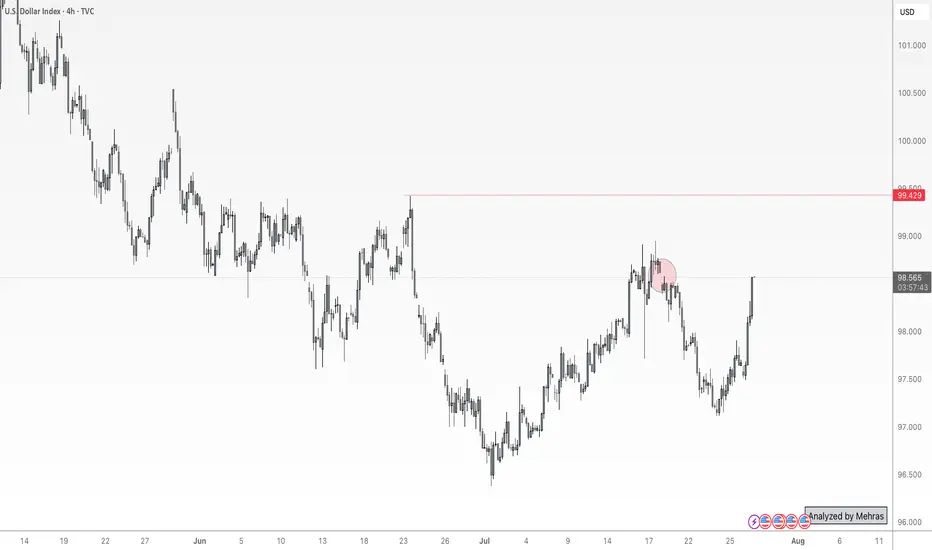
DXY index Near Resistance – Will Powell Trigger the Next Move?To kick off this week, let's take a quick look at the upcoming key indexes in the economic calendar before diving into the DXY analysis ( TVC:DXY ).
On Tuesday, we have Fed Chair Powell speaking, which could stir some excitement in the DXY index and ripple through correlated financial markets . Then, on Thursday , we have a bunch of key indexes like Core PPI, Core Retail Sales, PPI, and Unemployment Claims coming out. These releases could spark some volatility as well.
So, before we jump into the DXY analysis , I wanted to give you a heads-up on this week’s events
From a technical analysis standpoint , the DXY index is currently moving near a Heavy Resistance zone($101.30-$99.42) . At the same time, it has managed to break above the upper line of its descending channel and is now in a pullback phase to retest that broken line.
In terms of Elliott Wave theory , it seems that the DXY is completing wave B of a zigzag corrective(ABC/5-3-5) .
I expect that wave B will finish around the Potential Reversal Zone(PRZ) , and we might see the DXY index approach that Resistance zone($100.58-$99.93) before Powell’s speech tomorrow .
First Target: $99.770
Second Target: $100.06
Stop Loss(SL): $98.28
Please respect each other's ideas and express them politely if you agree or disagree.
U.S. Dollar Index Analysis (DXYUSD), 4-Hour Time Frame.
Be sure to follow the updated ideas.
Do not forget to put a Stop loss for your positions (For every position you want to open).
Please follow your strategy and updates; this is just my Idea, and I will gladly see your ideas in this post.
Please do not forget the ✅' like '✅ button 🙏😊 & Share it with your friends; thanks, and Trade safe.
DXY Strategy Unlocked — Will Bulls Control the Next Swing?⚡ US Dollar Index (DXY) Swing/Day Trade Setup ⚡
💹 Asset: DXY (US Dollar Index)
📈 Plan: Bullish — Pending Order Strategy
📊 US Dollar Index (DXY) Real-Time Data
Daily Change: +0.55 (+0.56%)
Day's Range: 97.62 – 98.60
52-Week Range: 96.38 – 110.18
🔔 Trade Setup (Thief Plan)
Breakout Entry: 98.800 ⚡ (Set TradingView alarm to catch the move in real time)
Stop Loss: “Thief SL” @ 24,000.0 (only after breakout confirmation).
📝 Adjust your SL based on your strategy & risk appetite, Ladies & Gentlemen (Thief OG’s).
Target: Resistance/overbought zone at 100.20
🎩 Escape target: 100.000 (take profits before market flips).
😰 Fear & Greed Sentiment
Index Level: 64 (Greed)
Market Mood: Moderately greedy, driven by:
📉 Net new 52-week highs vs. lows (bullish)
📊 VIX near averages (neutral)
🛡️ Bonds underperforming stocks (risk-on)
📈 Junk bond demand narrowing spreads (greed signal)
🌍 Fundamental & Macro Score
Fed Rate Cut Probability: 90% (Sept 18 FOMC, 25 bps cut expected)
Key Drivers:
✅ Labor Data: NFP (Sept 5) is crucial for direction.
⚠️ Trade Policy: Court ruled Trump tariffs illegal (appeal pending).
⬇️ Consumer Confidence: Michigan Index at 3-month low (58.2).
⬆️ ISM Manufacturing: Ahead of release, possible USD support.
Safe-Haven Demand: Geopolitical tensions supporting USD.
🐂 Overall Market Outlook Score
Bullish (Long): 60%
Bearish (Short): 40%
Bias: Short-term bullish as long as 97.60 holds.
USD rebound + bond yield strength + equity weakness backing USD.
⚠️ Risk: Break below 97.60 → next target 96.55 (bearish).
💡 Key Takeaways
🎯 NFP Report (Sept 5) = decisive catalyst.
⚖️ Fed debates + trade policy = medium-term uncertainty.
📉 Breakout above 98.80 is the key to bullish continuation.
🔍 Related Markets to Watch
FX:EURUSD
FX:GBPUSD
FX:USDJPY
OANDA:XAUUSD
CAPITALCOM:US30
✨ “If you find value in my analysis, a 👍 and 🚀 boost is much appreciated — it helps me share more setups with the community!”
#DXY #USD #DollarIndex #Forex #DayTrading #SwingTrading #BreakoutStrategy #ThiefTrader #TradingSetup

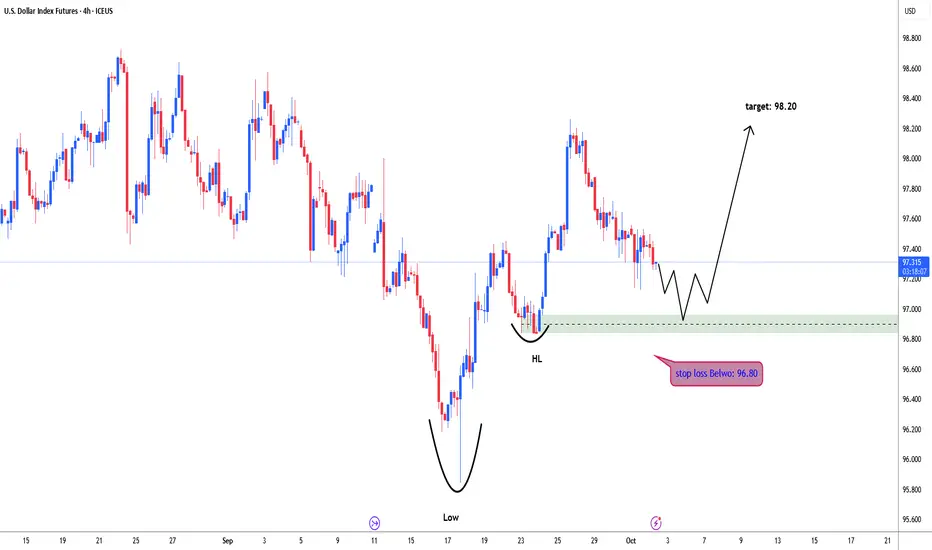
USD Dollar index possible bullish for 98.2024th September daily strong bullish candle (engulfing candle). price move down with low volume pullback. 96.97-84 daily demand zone for dollar index bullish continuation. if price fails and breaks below 96.45-95.90. stop loss 96.70, target: 98.20
DXY Dollar Heist: Can You Escape @100?🔥 DXY Dollar Index Bank Heist Plan (Swing Trade) 🔥
Asset: DXY Dollar Index 💵Plan: Bullish 📈Thief Trading Style: Layered Limit Order Strategy 🕵️♂️
🏦 The Heist Plan 🏦
Dear Thief OG's, Ladies & Gentlemen, get ready to pull off the ultimate DXY heist! 💰 We're using the Thief Layering Strategy to stack multiple limit orders and maximize our loot. Follow the plan, adjust to your risk, and let’s escape with the cash! 🚨
📈 Entry: The Break-In
Strategy: Deploy multiple buy limit orders to layer your entries like a master thief 🕴️. Suggested levels:
98.00 💸
98.20 💸
98.40 💸
98.60 💸
Flexibility: Add more layers based on your risk appetite or market conditions 📊.
Pro Tip: Set an alert on TradingView to catch the breakout or pullback at these levels 🚨.
🛑 Stop Loss: The Escape Route
Thief SL: Set at 97.50 to protect your stash 🛡️.
Risk Management: Adjust SL based on your lot size, risk tolerance, and number of layered entries ⚖️.
Warning: Don’t get caught! This is a high-stakes heist—stick to your risk plan 🔥.
🎯 Target: The Getaway
Police Barricade: Resistance at 100.30 🚓—watch out!
Our Target: Take profits at 100.00 to escape with the loot before the market traps you 🏃♂️💨.
🧠 Why This Heist?
The DXY is showing bullish momentum based on real-time market data 📡:
Macro Factors: Strong USD demand driven by economic indicators (check COT reports, geopolitics, and intermarket analysis) 🌍.
Technical Setup: Layered entries align with swing trade pullbacks and key support zones 📉.
Scalpers 👀: Stick to quick long-side trades with trailing SL to lock in profits 💰.
⚠️ Trading Alerts: Stay Sharp!
News Releases: Avoid new trades during high-impact news to dodge volatility traps 🚫.
Position Management: Use trailing stop-loss to secure your profits and stay safe 🛡️.
💪 Boost the Heist!
Hit the Boost Button to power up our Thief Trading Style! 🚀 Every like and view strengthens our crew, helping us rob the market with precision. Let’s make money and vanish like pros! 🤑
Stay tuned for the next heist plan, Thief OG’s! 🕵️♂️🎉

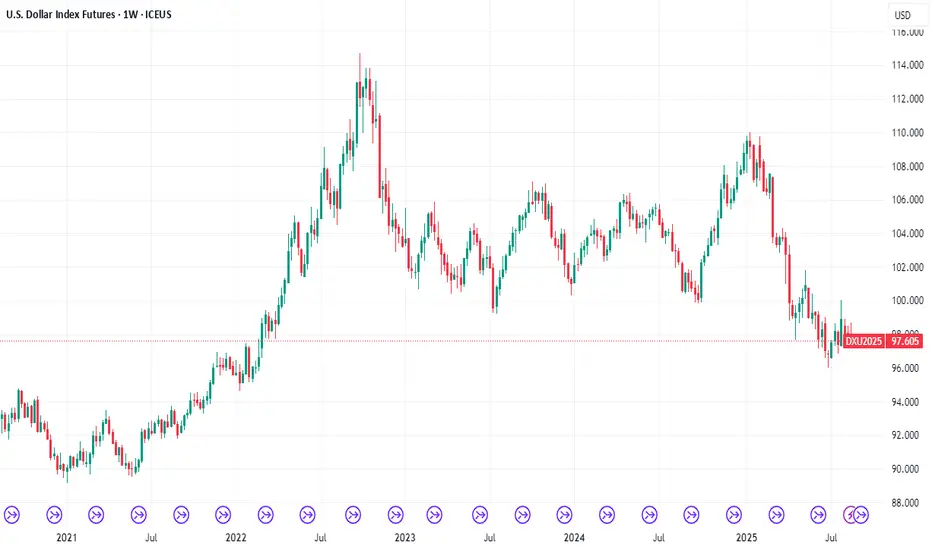
US Dollar Timeline: How Dollar is getting Destroyed Gradually The US Dollar Timeline: 2025
- The Dollar Index (DXY) has consistently weakened this year
- It fell more than 12.5% from the tops of 110 (Jan 2025) to the bottoms of 96.20, tested recently after Fed rate cuts.
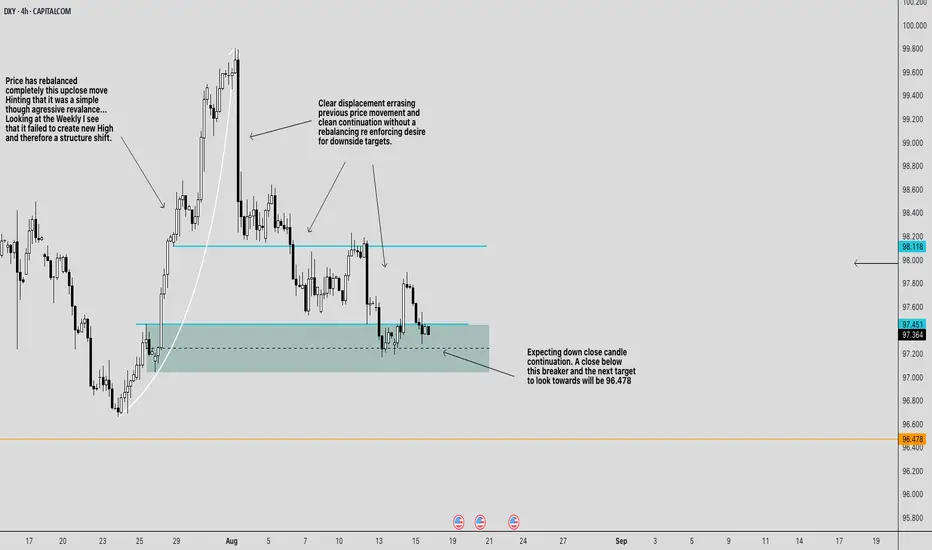
BEARISH CONTINUATION FOR DXYBearish Bias for CAPITALCOM:DXY
Weekly context:
The last up-move failed to print a new weekly high. Failing to create a shift in structure , so rallies are suspect.
4H structure:
We had a hard bearish displacement (large down candles) that erased prior price action and kept going without delivering a “full” rebalance. That usually means the price target remains lower .
The key zones on chart
Breaker / sell zone: \~ 97.45–97.75 (teal box). This is the prior bullish OB that failed (now acting as resistance).
Line in the sand: \~ 97.35–97.40 (dashed line through the teal). A decisive 4H close below here signals continuation.
Upside cap / invalidation area: 98.12 (cyan line) up to \~ 98.20 . Above this, the bearish sentiment weakens.
Primary downside draw: 96.478 (orange line). That’s the next obvious liquidity/inefficiency magnet on your chart.
Trade plan
Idea A — Rejection short from the breaker (preferred):
Entry: look for a rejection setup inside 97.45–97.75 (e.g., 15m/1h bearish shift after a sweep).
Stop: above the breaker and the cyan line ⇒ 98.12 (conservative) or 98.20 (safer).
Targets:
T1: 96.84 (take partials; pay yourself)
T2: 96.47.00
Idea B — Continuation after the break (confirmation play):
Trigger: a 4H close below \~97.35 .
Entry: sell the first clean pullback into 97.35–97.45 .
Stop: above 97.85–98.00 (back inside the breaker); conservative stop 98.12 .
Target: 96.478
Management & invalidation
If price rebalances deeper and closes 4H above 98.12–98.20 , the breaker is failing. Flatten shorts; reassess (potential squeeze toward 98.60–99.00 is then on deck).
If price hesitates at 97.00 , trail above the last 1H swing high to protect realized PnL while aiming for 96.478 .
News risk: Your chart flags upcoming US data (icons). Expect wicks; use hard stops and consider sizing down around releases.
Why this makes sense
* The strong displacement leg sets the draw lower.
* The teal box is a bearish breaker created by a failed bullish structure—ideal for “sell on rally.”
* The market rebalanced the prior up-close leg already; the lack of a symmetrical rebalance on the down-leg favors continuation to the next target ( 96.478 ).
One-liner: Bearish while 4H stays under 98.12 ; sell rallies into 97.45–97.75 or sell a 4H close-and-pullback below 97.35 ; scale out 97.20 → 97.00 → 96.80 → 96.478 ; hard stop above 98.12–98.20 .
*Not financial advice. Size appropriately and stick to your stop.*
PLEASE PUA!
Brief Analysis of US DXYDXY is trading around 97.70, while trending within a descending channel formation, and holding above 97.60 (Fib support 0.236), with resistance seen near 97.80–98.00 zone.
The RSI is rising and holding near 46, showing mild recovery momentum but not yet strong enough for a breakout.
However, prices have taken a support at the middle Bollinger band, which might lift the dollar a little higher.
Price action suggests consolidation inside the descending channel; intraday bias stays neutral-to-bullish above 97.60.
PPI data stronger than expected could lift DXY toward 98.35–98.50, while weaker data may pressure it back toward 97.30.
The 10Y auction outcome will also guide direction — higher yields can support the dollar, while softer demand may weigh on it.
Is the DXY Poised for a Breakout?Analyzing the Bullish PotentialThe DXY (US Dollar Index) appears to be on the verge of a significant upward rally. Last week, I shared my analysis highlighting a potential trigger point for a long entry, which the price subsequently surpassed, confirming the setup. According to the latest COT reports, commercial traders have reached their highest net positions of 2023. Historically, whenever commercials hit new highs, it often signals the beginning of a bullish trend in the DXY.
Additionally, we observe that many currencies measured against the dollar have weakened recently, supporting my thesis of a continued upward move for the DXY. Seasonal patterns also point toward a potential bullish phase.
Is this the moment for the DXY to initiate a strong bullish trend? Only time will tell, but the technical and fundamental signals are aligning in favor of a possible rally.
✅ Please share your thoughts about Dollar index in the comments section below and HIT LIKE if you appreciate my analysis. Don't forget to FOLLOW ME; you will help us a lot with this small contribution.
The Dollar's Descent: Understanding Historic WeaknessThe U.S. dollar, long considered the world's premier reserve currency and a symbol of American economic might, finds itself in unprecedented territory as it continues to hover near all-time lows against a basket of major currencies. This sustained weakness represents more than just a numerical decline on foreign exchange charts; it signals a fundamental shift in global economic dynamics, monetary policy effectiveness, and international confidence in American fiscal management. The implications of this historic depreciation extend far beyond currency traders and central banks, touching everything from household purchasing power to geopolitical relationships and the future architecture of the global financial system.
The current situation represents a culmination of multiple converging factors that have been building over several years. The dollar's decline hasn't occurred in isolation but rather as part of a complex interplay between domestic fiscal policies, international trade dynamics, shifting reserve currency preferences, and evolving global economic power structures. Understanding this phenomenon requires examining not just the immediate catalysts but also the deeper structural changes that have eroded the dollar's traditional sources of strength.
The Anatomy of the Dollar's Decline
The measurement of the dollar's value against other currencies typically relies on the U.S. Dollar Index (DXY), which tracks the greenback against a weighted basket of six major currencies: the euro, Japanese yen, British pound, Canadian dollar, Swedish krona, and Swiss franc. When analysts refer to the dollar approaching all-time lows, they're observing a sustained depreciation that has pushed this index to levels not seen in decades, with some bilateral exchange rates reaching historic extremes.
The technical aspects of this decline reveal a currency under persistent selling pressure. Foreign exchange markets, which trade over six trillion dollars daily, have witnessed consistent dollar weakness across multiple timeframes and against virtually all major and emerging market currencies. This broad-based depreciation suggests that the issue isn't merely tactical positioning by traders but reflects fundamental concerns about the dollar's intrinsic value and future trajectory.
Several immediate factors have contributed to this weakness. The Federal Reserve's monetary policy stance, particularly its approach to interest rates and quantitative easing, has played a crucial role. While other central banks have moved more aggressively to combat inflation or support their currencies, the Fed's policies have often prioritized domestic economic stability over currency strength. This divergence in monetary policy has created interest rate differentials that make holding dollars less attractive relative to other currencies offering higher yields.
The massive fiscal stimulus measures implemented in recent years have also weighed heavily on the dollar. The expansion of the federal deficit and the dramatic increase in the national debt have raised questions about the long-term sustainability of American fiscal policy. International investors, who must consider currency risk when purchasing U.S. assets, have grown increasingly concerned about the potential for future dollar depreciation as a means of reducing the real burden of this debt.
Trade dynamics have further complicated the dollar's position. The persistent U.S. trade deficit means that more dollars flow out of the country to purchase foreign goods than flow in from exports. This structural imbalance creates constant selling pressure on the dollar as these funds are converted into other currencies. Additionally, the weaponization of the dollar through sanctions and financial restrictions has prompted some nations to seek alternatives for international trade settlement, reducing demand for dollars in global commerce.
Historical Context and Precedents
To fully appreciate the significance of the dollar's current weakness, it's essential to examine historical precedents and the evolution of the dollar's role in the global economy. The Bretton Woods system, established in 1944, positioned the dollar as the world's primary reserve currency, backed by gold and serving as the anchor for international monetary stability. When this system collapsed in 1971, the dollar transitioned to a fiat currency, deriving its value from the strength of the U.S. economy and the confidence of global markets rather than gold reserves.
Throughout its modern history, the dollar has experienced several significant periods of weakness. The stagflation of the 1970s saw the dollar lose considerable value as inflation soared and economic growth stagnated. The Plaza Accord of 1985 deliberately weakened the dollar to address trade imbalances, demonstrating that currency depreciation could be a policy tool rather than merely a market outcome. The financial crisis of 2008 triggered another period of dollar weakness as the Federal Reserve implemented unprecedented monetary easing.
However, the current situation differs from these historical episodes in several important ways. Previous periods of dollar weakness often occurred within a framework where the dollar's fundamental role as the global reserve currency remained unchallenged. Today, that supremacy faces genuine competition from alternative currencies and payment systems. The rise of the euro, the internationalization of the Chinese yuan, and the emergence of digital currencies all represent potential challenges to dollar hegemony that didn't exist during previous cycles of weakness.
The geopolitical context has also shifted dramatically. During past periods of dollar weakness, the United States maintained relatively stable relationships with its major trading partners and allies. Current tensions, trade disputes, and the fragmentation of the global economy into competing blocs have created an environment where dollar alternatives are not just economically viable but politically desirable for some nations. This represents a structural change that could make the current period of weakness more persistent and potentially irreversible in some respects.
Global Economic Implications
The ramifications of the dollar's sustained weakness extend throughout the global economy, creating both opportunities and challenges for different stakeholders. For American consumers, a weaker dollar translates directly into reduced purchasing power for imported goods. Everything from electronics to clothing to automobiles becomes more expensive as the dollar's depreciation increases the cost of foreign-produced items. This imported inflation adds to domestic price pressures, potentially eroding living standards and complicating monetary policy decisions.
American businesses face a mixed picture. Exporters benefit from a competitive advantage as their goods become relatively cheaper in foreign markets, potentially boosting sales and market share. Multinational corporations with significant overseas earnings see those profits translate into more dollars when repatriated, improving their financial results. However, companies reliant on imported inputs face higher costs, and those with international supply chains must navigate increased complexity and currency risk.
The impact on financial markets has been profound and multifaceted. Equity markets have shown remarkable resilience, with some sectors benefiting from the currency tailwind to earnings. However, bond markets face challenges as foreign investors demand higher yields to compensate for currency risk, potentially increasing borrowing costs for the U.S. government and corporate issuers. Commodity markets, traditionally priced in dollars, have seen significant price increases as the weakening currency makes raw materials more expensive in dollar terms.
For emerging markets, the dollar's weakness presents both opportunities and risks. Countries with dollar-denominated debt benefit from the reduced real burden of their obligations, providing fiscal relief and potentially enabling increased domestic investment. However, those nations that have traditionally relied on dollar stability for their own monetary frameworks face uncertainty and potential instability. The shift away from dollar dependence requires careful management and potentially painful adjustments to monetary and fiscal policies.
Developed economies have responded to the dollar's weakness in various ways. The European Union has seen the euro strengthen significantly, creating challenges for European exporters but providing relief from imported inflation. Japan faces particular difficulties as yen strength threatens its export-dependent economy, prompting potential intervention in currency markets. These dynamics have strained international cooperation and raised the specter of competitive devaluations reminiscent of the 1930s.
The Reserve Currency Question
Perhaps the most significant long-term implication of the dollar's sustained weakness concerns its status as the world's primary reserve currency. This privileged position has provided the United States with what former French Finance Minister Valéry Giscard d'Estaing called an "exorbitant privilege" – the ability to borrow in its own currency, maintain persistent trade deficits, and exercise significant influence over global financial conditions.
The erosion of confidence in the dollar threatens this special status. Central banks worldwide have been gradually diversifying their reserves away from dollars, increasing holdings of gold, euros, yuan, and other assets. While the dollar still accounts for the majority of global reserves, its share has been declining steadily. This trend, if it continues, could fundamentally alter the global financial architecture and reduce American influence over international economic affairs.
The search for alternatives has accelerated in recent years. The Chinese yuan's inclusion in the International Monetary Fund's Special Drawing Rights basket marked a significant milestone in its internationalization. Digital currencies, both central bank digital currencies and cryptocurrencies, offer potential alternatives for international trade settlement and value storage. Regional payment systems and bilateral currency swap agreements have proliferated, creating pathways for trade that bypass the dollar entirely.
However, the transition away from dollar dominance faces significant obstacles. The depth and liquidity of U.S. financial markets remain unmatched, providing essential infrastructure for global finance. The rule of law, property rights protection, and regulatory framework in the United States continue to attract international investment despite currency concerns. No single alternative currency currently possesses all the attributes necessary to fully replace the dollar's multifaceted role in the global economy.
Policy Responses and Future Scenarios
Policymakers face difficult choices in responding to the dollar's weakness. Traditional approaches to currency support, such as raising interest rates or intervening in foreign exchange markets, carry significant economic costs and may prove ineffective against structural pressures. The Federal Reserve must balance its domestic mandate for price stability and full employment with the international implications of its policies, a task made more complex by the dollar's global role.
Fiscal policy presents another set of challenges and opportunities. Addressing the structural factors undermining dollar confidence would require difficult decisions about spending, taxation, and debt management. Political polarization and competing economic priorities make comprehensive fiscal reform challenging, yet the consequences of inaction could be severe. The possibility of a dollar crisis, while still remote, has moved from the realm of theoretical speculation to a risk requiring serious contingency planning.
International cooperation could play a crucial role in managing the transition to a new monetary order. Multilateral agreements on exchange rate management, similar to but more flexible than the Bretton Woods system, might provide stability during a period of adjustment. However, the current geopolitical climate makes such cooperation difficult to achieve. The fragmentation of the global economy into competing blocs may accelerate the development of alternative currency systems, further undermining the dollar's position.
Looking ahead, several scenarios could unfold. A gradual, managed decline in the dollar's dominance might allow for smooth adjustment to a multipolar currency system, with several major currencies sharing reserve status. This outcome would require careful coordination and policy discipline from major economies. Alternatively, a more chaotic transition could occur if confidence in the dollar erodes rapidly, potentially triggering financial instability and economic disruption.
The technological revolution in finance adds another dimension of uncertainty. Central bank digital currencies could reshape international monetary relations in ways that are difficult to predict. The adoption of blockchain technology and smart contracts might enable new forms of international trade settlement that don't require traditional reserve currencies. These innovations could either accelerate the dollar's decline or, if led by the United States, potentially reinforce its position through digital dominance.
Conclusion: Navigating Uncharted Waters
The dollar's hover near all-time lows represents more than a cyclical fluctuation in currency markets; it signals a potential inflection point in the global economic order. The convergence of fiscal pressures, monetary policy challenges, geopolitical tensions, and technological disruption has created conditions unlike any previously experienced in the modern era of fiat currencies. The implications extend beyond exchange rates to encompass fundamental questions about economic governance, international cooperation, and the distribution of global economic power.
For investors, businesses, and policymakers, navigating this environment requires careful consideration of both immediate risks and long-term structural changes. Hedging strategies, diversification approaches, and policy frameworks developed during periods of dollar strength may prove inadequate in a world where the greenback's supremacy can no longer be assumed. The ability to adapt to multiple possible futures, rather than betting on a single outcome, becomes essential for managing risk and capturing opportunities.
The social and political implications of the dollar's decline deserve equal attention to the economic aspects. Currency strength has long been intertwined with national prestige and political power. A sustained period of dollar weakness could reshape domestic politics, alter international alliances, and influence the trajectory of globalization itself. The psychological impact of losing reserve currency status, should it occur, would reverberate through American society in ways that extend far beyond financial markets.
As the world watches the dollar's trajectory with a mixture of concern and opportunism, the need for thoughtful analysis and measured response becomes paramount. The current situation demands neither panic nor complacency but rather a clear-eyed assessment of changing realities and proactive adaptation to new circumstances. The dollar's decline may mark the end of one era and the beginning of another, but the nature of that new era remains to be written by the collective actions of governments, markets, and societies worldwide.
The path forward will likely be characterized by increased volatility, structural adjustments, and the gradual emergence of new monetary arrangements. Whether this transition enhances global economic stability or triggers periodic crises will depend largely on the wisdom and cooperation of global leaders. The dollar's current weakness serves as both a warning and an opportunity – a signal that the old order is passing and a chance to build something better in its place. The challenge lies in managing this transition while maintaining the stability and prosperity that the dollar-based system, despite its flaws, has helped facilitate for decades.
In this context, the dollar's hover near all-time lows should be understood not as an isolated phenomenon but as part of a broader transformation of the global economy. The outcomes of this transformation remain uncertain, but its importance cannot be overstated. The decisions made in response to the dollar's weakness will shape international economic relations for generations to come, making this one of the most consequential periods in modern monetary history.
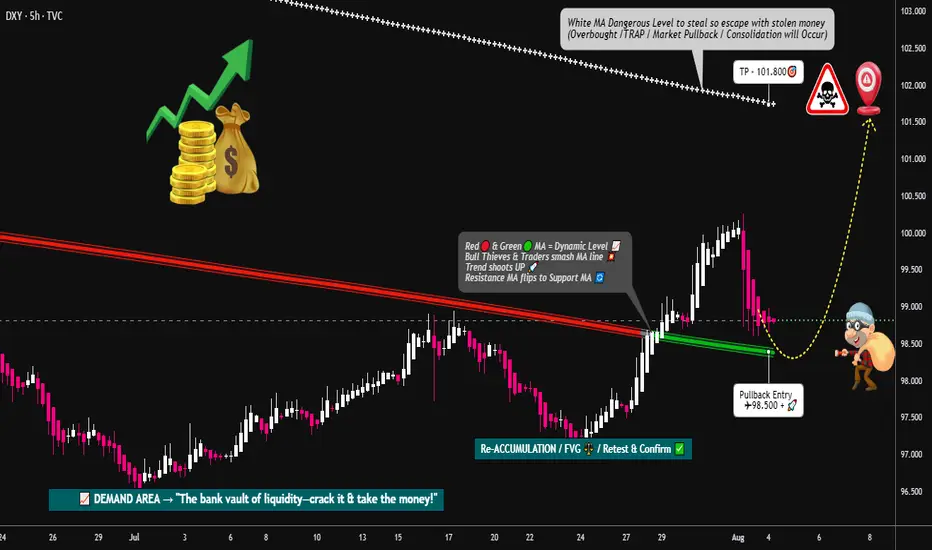
DXY Locked & Loaded: Robber's Gameplan for Profit Pullout💸💼 "DXY Market Heist Blueprint – The Thief's Bullish Escape Plan" 💼💸
Rob the Market, Not the Rules – Trade Smart, Trade Sharp, Trade Thief Style™
🌍 Hey Money Makers, Risk Takers & Market Robbers!
Hola! Ola! Bonjour! Hallo! Marhaba! 🙌
Let’s break into the DXY vault and swipe those profits with precision. 💼💸
🧠💡This Thief Trading Style™ Master Plan is a high-stakes operation backed by technical setups, macro-fundamentals, and robbery-level insights. Follow the blueprint laid out on the chart. Our target? The High-Risk Yellow ATR Zone – where the real treasure is buried.
💼 ENTRY: "The Vault Is Open – Grab the Bullish Bags!"
Enter long as price approaches key pullback levels within a 15–30 min timeframe. Use the most recent candle wick’s swing low/high for sniper-style DCA entries.
🔑 Layer multiple limit orders like a thief stacking getaway bags (aka the DCA / Layering Method). Be patient and precise.
🛑 STOP LOSS: "Don’t Get Caught by the Market Police"
📍 Place SL just below the nearest 4H swing low (example: 97.300) depending on your strategy (scalping/swing).
⚖️ Your SL should reflect your risk appetite, lot size, and how many limit orders you’re running. Thieves don’t risk it all on one job. 🎭
🎯 TARGET: 101.800 (or Escape Before the Sirens)
Once the target zone nears, decide whether to collect full loot or exit before resistance hits. We trade smart, not greedy. 🧠💰
📈 Why This Heist Makes Sense: Market Conditions Breakdown
Bullish momentum supported by macro drivers and intermarket forces
COT report and sentiment leaning in favor of USD
Dollar Index structure showing signs of reversal + trend confirmation
Consolidation trap zones hinting at institutional accumulation
💡 This is not just a blind entry—it's a well-researched and time-tested plan. Check the chart details and refer to:
🔗 Fundamentals | COT Reports | Sentiment Score | Quantitative Outlook
🚨 NEWS & POSITION MANAGEMENT ALERT
Before jumping in, beware of high-impact news!
🗞️ To keep your trades safe and stress-free:
Avoid opening new positions during major news releases
Use trailing SLs to protect gains
Monitor volatility triggers (economic calendar is your best friend!)
🏴☠️💥 BOOST THE ROBBERY – Hit That Like/Boost Button
The more you boost, the stronger the heist crew becomes! 💪🚀
Help fellow traders steal opportunities with the Thief Trading Style™ – calculated, bold, and sharp.
🔥 Let's continue to outsmart the markets and make each trade count. Stay tuned for the next heist update – fresh trades, deeper insights, and bigger bags. 🤑💼
🔔 Disclaimer: This plan is not financial advice. Use it for educational and entertainment purposes. Always conduct your own analysis and manage risk accordingly.
📌 Markets shift quickly. Stay adaptable, informed, and always ready to pivot.
Dollar Falls as Traders Price In Two 2025 Rate Cuts on Weak JobsDollar Falls as Traders Price In Two 2025 Rate Cuts on Weak Jobs Data
Introduction
In a significant turn of events for the global currency markets, the U.S. dollar has taken a sharp tumble as traders brace for a more dovish Federal Reserve. A weaker-than-expected U.S. employment report for July 2025 has prompted market participants to price in two interest-rate cuts by the Fed before the end of the year. This shift in monetary policy expectations comes during a time of heightened global uncertainty, much of it triggered by President Donald Trump's aggressive trade policies, which have already disrupted the $7.5 trillion-a-day foreign exchange market.
The Bloomberg Dollar Spot Index, a key gauge of the dollar’s strength against major currencies, plunged as much as 1%—marking its worst single-day performance since April 21, 2025. The greenback’s decline was mirrored by strong gains in rival currencies, with the Japanese yen appreciating 2.2% and the euro climbing more than 1% against the dollar.
This article delves into the recent developments surrounding the U.S. dollar, the implications of weak jobs data, the Federal Reserve’s likely response, and how Trump’s trade policies are shaping the broader economic landscape.
________________________________________
Weak Jobs Data Sparks Policy Shift
The July 2025 employment report came in well below expectations. Non-farm payrolls growth fell short, and revisions for May and June showed fewer jobs were added than previously reported. These figures suggest that the U.S. labor market is cooling more rapidly than anticipated, raising concerns about the sustainability of the post-pandemic economic recovery.
According to Helen Given, a foreign exchange trader at Monex Inc., “It’s now clear that the U.S. labor market is cooling fairly sharply. There’s a good chance that Trump’s crusade against Chair Powell ratchets up further in the coming days, and there could be further losses for the dollar to come as a result.”
The disappointing employment data has led traders to adjust their expectations for U.S. monetary policy. Futures markets are now pricing in two 25-basis-point rate cuts by the end of 2025, a stark reversal from the earlier outlook that suggested the Fed would remain on hold or even consider tightening if inflation remained sticky.
________________________________________
The Federal Reserve’s Dilemma
The Federal Reserve now finds itself in a precarious position. On one hand, inflation has moderated in recent months, giving the central bank more room to maneuver. On the other hand, a weakening labor market could indicate a broader slowdown that might require immediate action to prevent a recession.
Fed Chair Jerome Powell has come under increasing political pressure from President Trump, who has publicly criticized the Fed for keeping rates too high. Trump argues that rate cuts are necessary to support U.S. exporters and counteract the negative effects of his own tariffs and trade restrictions.
Historically, the Fed has maintained its independence from political influence, but in an election year, the pressure to act can become intense. If the Fed moves to cut rates, it will be seen as responding to both economic data and political dynamics—a delicate balancing act.
________________________________________
The Global Currency Market Reacts
The ripple effects of the dollar’s decline are being felt across the globe. The $7.5 trillion-a-day foreign exchange market, already under strain from geopolitical uncertainty and shifting central bank policies, has seen increased volatility in recent weeks.
The Japanese yen, often viewed as a safe-haven currency, surged 2.2% against the dollar following the release of the jobs data. Meanwhile, the euro gained over 1%, reflecting investor sentiment that the greenback’s era of dominance may be waning—at least for now.
Emerging market currencies also found some relief, as a weaker dollar generally eases pressure on countries with large dollar-denominated debts. However, the overall picture remains complex, as trade tensions and capital flow volatility continue to weigh on risk sentiment.
________________________________________
Trump’s Trade Policies: A Double-Edged Sword
President Trump’s trade strategies have been a central feature of his second term in office. From imposing tariffs on Chinese imports to renegotiating trade agreements with the European Union and Canada, Trump has sought to reshape the global trading system in favor of American manufacturers.
Yet these policies have produced mixed results. While some sectors have benefited from protectionist measures, others—particularly those reliant on global supply chains—have suffered from rising costs and retaliatory tariffs. The uncertainty generated by these policies has also dampened business investment, slowed global trade, and disrupted financial markets.
“The dollar had tumbled this year as Trump’s aggressive trade policies rocked the $7.5 trillion-a-day currency market, weighing on global growth outlook,” Bloomberg reported.
Investors are increasingly concerned that continued trade friction, combined with growing political pressure on the Fed, could lead to policy missteps that undermine the U.S. economy and erode confidence in the dollar.
________________________________________
Market Implications
The dollar’s recent decline has far-reaching implications for various asset classes:
1. Equities
U.S. equities have shown mixed reactions. While lower interest rates are typically supportive of stock prices, the underlying reason—economic weakness—has investors on edge. Sectors such as technology and consumer discretionary are expected to benefit from cheaper borrowing costs, but cyclical sectors may struggle if growth slows further.
2. Bonds
Treasury yields have fallen sharply as traders anticipate rate cuts. The 10-year yield dropped below 3.8%, its lowest level in months. The yield curve has also flattened, a potential warning sign of slowing economic momentum.
3. Commodities
A weaker dollar typically supports commodity prices, as most are priced in dollars. Gold, oil, and industrial metals all saw gains in the wake of the jobs report. However, demand-side concerns stemming from a global slowdown could limit the upside.
4. Emerging Markets
For emerging markets, a softer dollar offers both relief and risk. On the positive side, it reduces debt servicing costs and can attract capital flows. On the negative side, if the dollar’s weakness reflects a broader global slowdown, risk appetite could remain subdued.
________________________________________
Looking Ahead: What to Watch
As markets digest the latest economic data and policy signals, several key developments will be closely monitored:
1. Upcoming Fed Meetings
The Federal Open Market Committee (FOMC) will meet again in September. Markets will be keenly watching for any changes in tone or new forward guidance. A rate cut in September now appears increasingly likely, especially if subsequent data confirms a labor market slowdown.
2. Inflation Trends
While inflation has moderated, it remains a key concern for policymakers. If inflation rebounds unexpectedly, it could complicate the Fed’s ability to cut rates without stoking price pressures.
3. Geopolitical Risks
Trade tensions, particularly with China and the EU, remain unresolved. Any escalation could further destabilize markets and weigh on the dollar. Additionally, developments in the Middle East, Eastern Europe, and Southeast Asia could add to the uncertainty.
4. U.S. Presidential Politics
With the 2026 presidential election campaign already underway, Trump’s rhetoric and policy decisions will continue to influence market sentiment. His ongoing criticism of the Fed could erode confidence in U.S. institutions, particularly if it leads to perceived politicization of monetary policy.
________________________________________
Conclusion
The sharp fall in the U.S. dollar following weak July jobs data marks a pivotal moment in 2025’s economic narrative. With traders now pricing in two Federal Reserve rate cuts by year-end, the stakes have never been higher for policymakers, investors, and political leaders.
While a softer dollar can provide some temporary relief to exporters and boost inflation expectations, it also reflects deeper concerns about the strength of the U.S. economy and the unintended consequences of aggressive trade policies. President Trump’s confrontational approach to global trade, combined with mounting pressure on the Fed, is creating a complex and potentially volatile environment for markets.
As the year progresses, all eyes will be on the Federal Reserve’s response, the resilience of the U.S. labor market, and the evolving political landscape. In a world where headlines can move markets in seconds, clarity, stability, and sound policy have never been more critical.
________________________________________
Disclaimer: This article is for informational purposes only and does not constitute financial or investment advice.
Dollar Index - Expecting Bullish Continuation In The Short TermH4 - Strong bullish momentum followed by a pullback.
No opposite signs.
Until the two Fibonacci support zones hold I expect the price to move higher further.
If you enjoy this idea, don’t forget to LIKE 👍, FOLLOW ✅, SHARE 🙌, and COMMENT ✍! Drop your thoughts and charts below to keep the discussion going. Your support helps keep this content free and reach more people! 🚀
--------------------------------------------------------------------------------------------------------------------

DXY at Its Most Critical Level of 2025 — Will the 100 Bank LevelThe Dollar Index (DXY), just like several other majors, is approaching a very important level. We’re now near the 100 mark, which is not only a psychological level — but also a key institutional (bank) level.
There’s also a gap zone left behind that price is about to fill. I believe the index will stay in a range over the next 1–2 days as it waits for critical data later this week — especially Wednesday’s announcements and Friday’s NFP report, which could set the tone for what’s next.
Based on current market sentiment, Trump’s remarks, Powell’s upcoming speech, and broader macro factors, I believe DXY has the potential to break above 100 and move toward 102–104, if that level is broken cleanly.
Let’s also not forget — price bounced from a monthly demand block near 96, and we’re seeing weak support across majors like EUR and Gold. That adds confluence for potential dollar strength.
📌 What do you think — is dollar strength just around the corner?
🔁 This analysis will be updated whenever necessary.
Disclaimer: This is not financial advice. Just my personal opinion.