Dollar Index at Critical Support — Is a Big USD Rally Coming?Today I want to analyze the DXY index( TVC:DXY ) for you, which is one of the key indices in the financial markets.
At the moment, the DXY index is moving near a support zone($98.85-$98.50), Monthly Support (1) level, and the 21_SMA(Weekly).
In addition, the DXY has been trending inside a descending channel for roughly the past 13 trading days.
The main question is whether the DXY can break below this confluence of support levels or not.
Looking at the 4-hour chart, we can identify a Morning Star candlestick reversal pattern, and there is also a clear bullish Regular Divergence (RD+) between the last two lows.
Moreover, the US 10-Year Government Bond Yield ( TVC:US10 ) appears bullish in my view — and its upward movement can potentially support a rise in the DXY as well.
From my perspective, the best currency pairs to capitalize on a stronger USD are USDJPY( FX:USDJPY ) and EURUSD( FX:EURUSD ).
We should also keep in mind that several important US economic indicators will be released this week, which could significantly impact market direction. So be extra cautious with your positions, especially during data releases:
JOLTS Job Openings➡️09 December
Federal Funds Rate➡️10 December
FOMC Statement➡️10 December
FOMC Press Conference➡️10 December
Unemployment Claims➡️11 December
I expect that once the DXY breaks above the upper line of the descending channel, it could at least move toward one of the higher Fibonacci levels.
Do you think the U.S. interest rate will be cut this week?
💡 Please respect each other's opinions and express agreement or disagreement politely.
📌U.S. Dollar index Analysis (DXYUSD), 4-hour time frame.
🛑 Always set a Stop Loss(SL) for every position you open.
✅ This is just my idea; I’d love to see your thoughts too!
🔥 If you find it helpful, please BOOST this post and share it with your friends.
Dollaranalysis

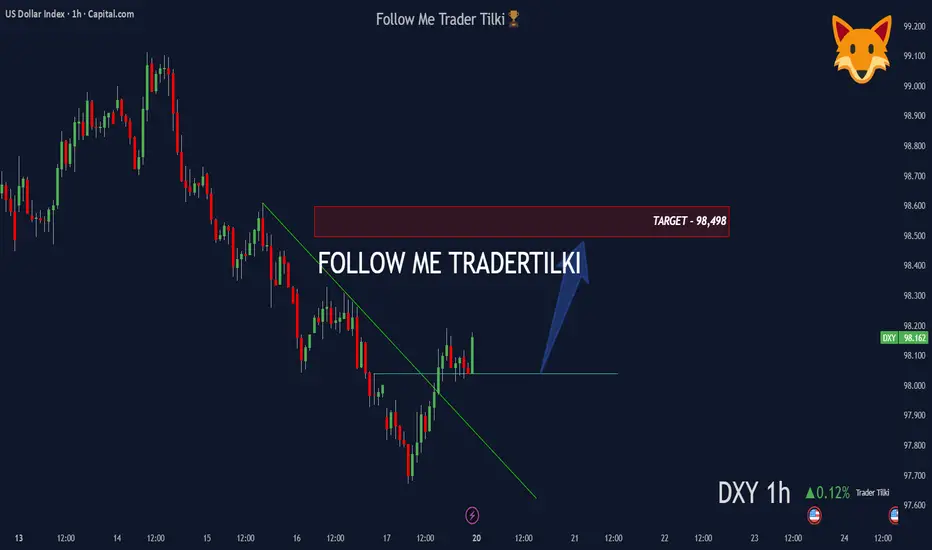
DXY 1H Analysis: Trendline Break with Rising Volume 📊 DXY – 1 Hour Analysis
Technical Outlook:
The trendline has been broken and rising volumes are drawing attention.
Based on this setup, my target level is: 98,498 🎯
Fundamental Analysis:
Recently, a White House economist stated that “we are not in any kind of economic war with China,” which reduced uncertainty in the markets and strengthened the dollar index.
In addition, FED policies, interest rate expectations, and tightening measures continue to be key factors supporting upward pricing on the DXY side.
🙏 Thanks to everyone who supports me with their likes.
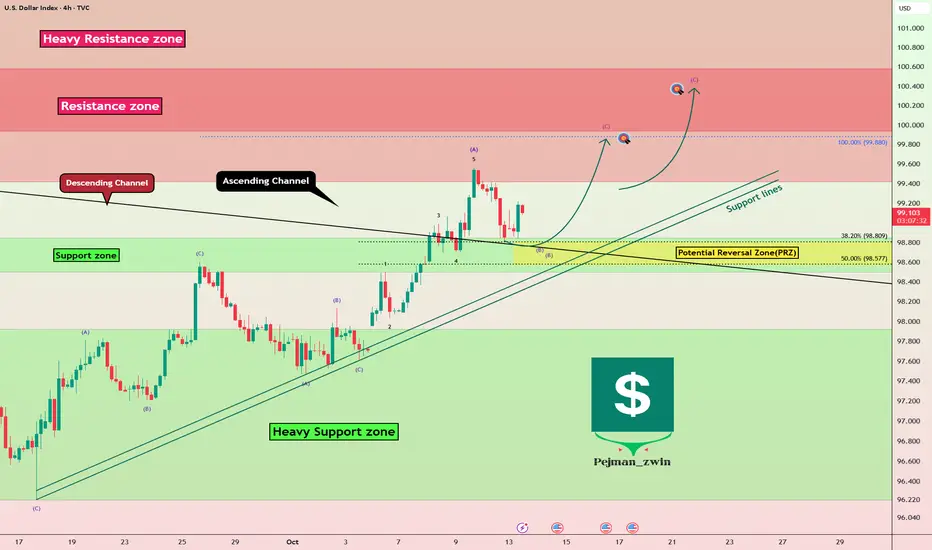
DXY index Near Resistance – Will Powell Trigger the Next Move?To kick off this week, let's take a quick look at the upcoming key indexes in the economic calendar before diving into the DXY analysis ( TVC:DXY ).
On Tuesday, we have Fed Chair Powell speaking, which could stir some excitement in the DXY index and ripple through correlated financial markets . Then, on Thursday , we have a bunch of key indexes like Core PPI, Core Retail Sales, PPI, and Unemployment Claims coming out. These releases could spark some volatility as well.
So, before we jump into the DXY analysis , I wanted to give you a heads-up on this week’s events
From a technical analysis standpoint , the DXY index is currently moving near a Heavy Resistance zone($101.30-$99.42) . At the same time, it has managed to break above the upper line of its descending channel and is now in a pullback phase to retest that broken line.
In terms of Elliott Wave theory , it seems that the DXY is completing wave B of a zigzag corrective(ABC/5-3-5) .
I expect that wave B will finish around the Potential Reversal Zone(PRZ) , and we might see the DXY index approach that Resistance zone($100.58-$99.93) before Powell’s speech tomorrow .
First Target: $99.770
Second Target: $100.06
Stop Loss(SL): $98.28
Please respect each other's ideas and express them politely if you agree or disagree.
U.S. Dollar Index Analysis (DXYUSD), 4-Hour Time Frame.
Be sure to follow the updated ideas.
Do not forget to put a Stop loss for your positions (For every position you want to open).
Please follow your strategy and updates; this is just my Idea, and I will gladly see your ideas in this post.
Please do not forget the ✅' like '✅ button 🙏😊 & Share it with your friends; thanks, and Trade safe.
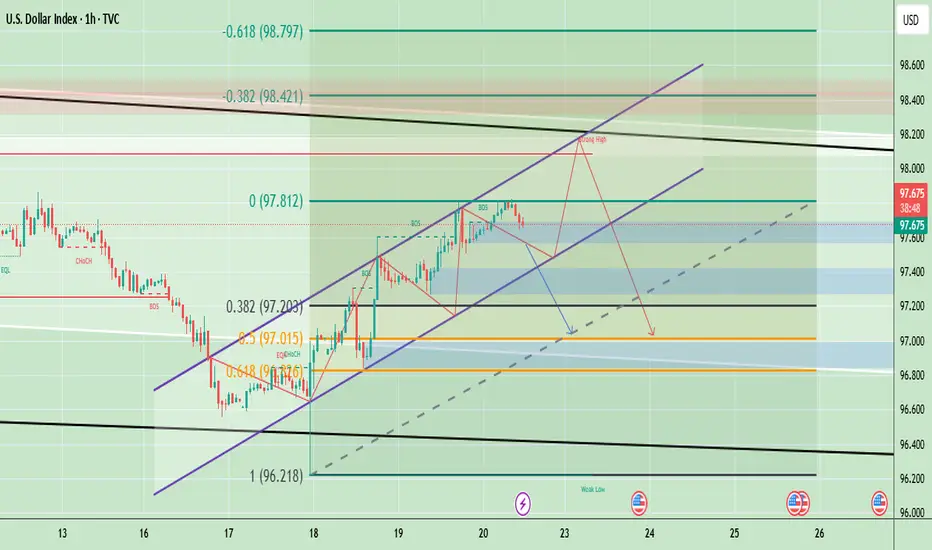
Dollar Index Resistance & Support AnalysisDXY (U.S. Dollar Index) is trading around 97.71, holding within an upward channel after bouncing from the 97.00–97.10 support zone. The structure shows a series of higher highs and higher lows, indicating short-term bullish momentum. However, the chart also highlights a potential “strong high” area near 98.20–98.40, where resistance from both Fibonacci retracement levels and channel tops converge. If DXY fails to break above this resistance, a retracement toward 97.20–97.00 is likely, with further downside risk toward 96.80 if that support breaks.
Based on the current setup, short-term upside toward 98.20–98.40 is possible, but overall bias suggests a likely pullback (downside) after testing resistance, especially if momentum weakens near the channel top.
🔴 Sell Zone (Short Setup)
- Sell Zone (Resistance area): 98.20 – 98.40
- Sell Trigger: If price tests and rejects this zone with bearish candles (reversal signals).
🟢 Buy Zone (Long Setup)
- Buy Zone (Support area): 97.20 – 97.30
- Buy Trigger: If price holds above this zone and shows bullish reversal candles (hammer, engulfing, etc.).
Note
Please risk management in trading is a Key so use your money accordingly. If you like the idea then please like and boost. Thank you and Good Luck!
USD Index Technical Outlook – Key Buy & Sell LevelsThe U.S. Dollar Index (DXY) is currently trading inside a clear downward channel, showing a bearish market structure. Price is hovering near 98.23, just below the key resistance zone between 98.5 – 99.2, where Fibonacci retracement levels (0.382, 0.5, and 0.618) also align, making it a strong supply area. As long as price remains below this zone, the bias stays bearish, with potential downside targets at 97.5 and then 96.5, in line with the channel support and Fibonacci extensions. However, if buyers manage to push above 99.2, it would signal a possible trend reversal and shift the outlook towards bullish continuation. Overall, the structure suggests that the U.S. Dollar Index is more likely to face rejection near resistance and continue lower in the short term.
🔴 Sell Zone (Short Setup)
- 98.50 – 99.20 is a strong resistance area where price aligns with the Fibonacci retracement (0.382 – 0.618) and the upper channel trendline.
- Sell Trigger: If price shows rejection (bearish candles, wicks, or reversal patterns) within this zone.
🟢 Buy Zone (Long Setup)
- 97.50 – 96.50 area is the channel support and also near Fibonacci extension levels.
- Buy Trigger: Look for bullish confirmation (bounce, bullish engulfing, or rejection wicks).
Note
Please risk management in trading is a Key so use your money accordingly. If you like the idea then please like and boost. Thank you and Good Luck!

DXY at Major Support – Dollar Ready to Rebound?Today, I want to analyze the DXY index ( TVC:DXY ) for you. First, I must say that this week, US indexes can have an impact on the DXY index trend .
US indexes to be released this week:
Core PPI m/m: Tomorrow
PPI m/m: Tomorrow
Core CPI m/m: Thursday
CPI m/m: Thursday
CPI y/y: Thursday
Unemployment Claims: Thursday
Prelim UoM Consumer Sentiment: Friday
Prelim UoM Inflation Expectations: Friday
The DXY Index is currently moving near the Support zone($97.989-$97.834) , Yearly Support(2) , and the lower line of the descending channel .
In terms of Elliott Wave theory , it seems that the DXY index has managed to complete microwave 5 of the main wave C . The corrective structure is of the Zigzag Correction(ABC/5-3-5) type.
Also, we can see the Regular Divergence (RD+) between consecutive valleys .
I expect the DXY index to rise to at least $98.07(First Target) before the US indexes are announced.
Second Target: $98.56
Stop Loss(SL): $96.997
Note: With the DXY index rising, we can expect a correction in Gold( OANDA:XAUUSD ), Bitcoin( BINANCE:BTCUSDT ), and major Forex pairs (dollar strength).
Please respect each other's ideas and express them politely if you agree or disagree.
U.S. Dollar Index Analyze (DXYUSD), 1-hour time frame.
Be sure to follow the updated ideas.
Do not forget to put a Stop loss for your positions (For every position you want to open).
Please follow your strategy and updates; this is just my Idea, and I will gladly see your ideas in this post.
Please do not forget the ✅' like '✅ button 🙏😊 & Share it with your friends; thanks, and Trade safe.
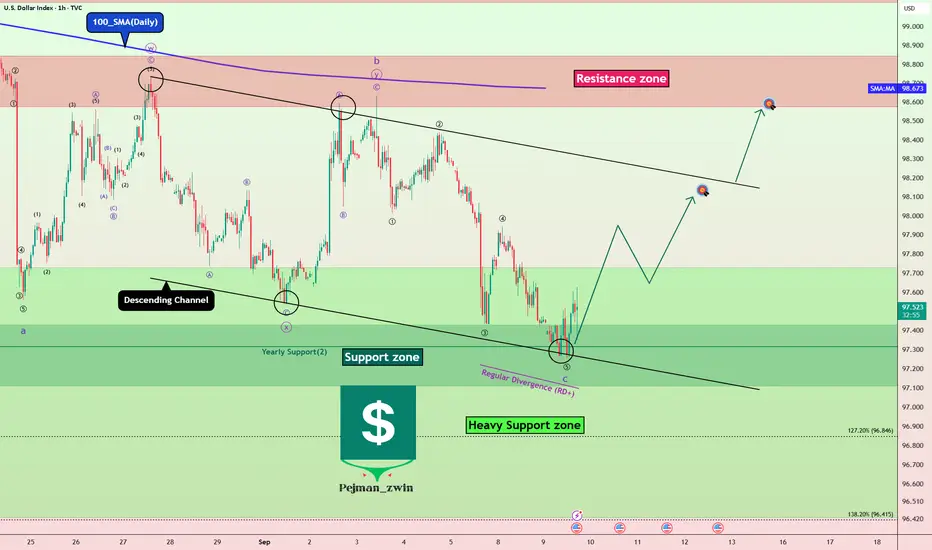
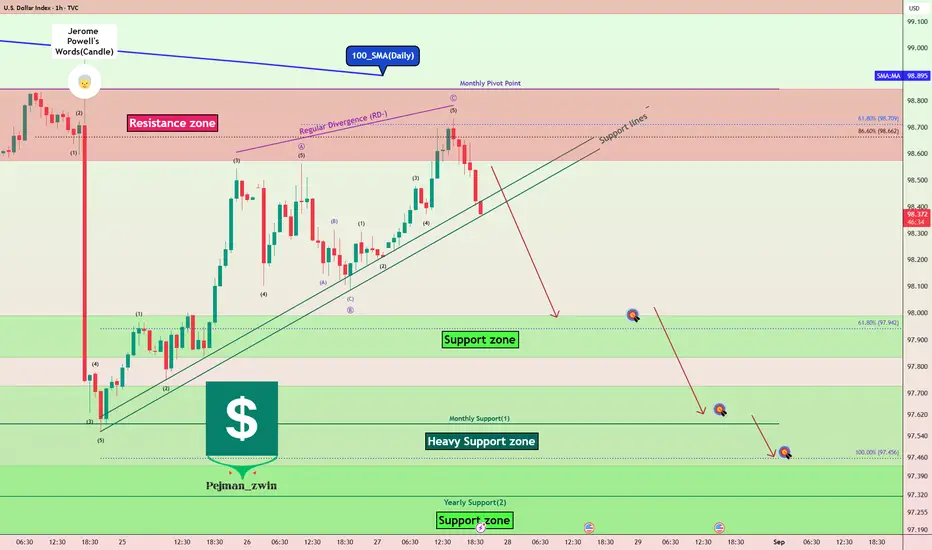
DXY Analysis: Resistances Holding Strong, Is the Downtrend Back?Today, I want to analyze one of the important indices of the financial markets , the U.S. Dollar Index ( TVC:DXY ), for you, which can be a guide for taking short-long positions in the Forex , Futures , and even Crypto markets.
The DXY index fell by about -1.2% after Jerome Powell began talking about the possibility of a rate cut in September , but as the new week began, the DXY index started to rise again.
If we look at the DXY Index chart on the 1-hour time frame , we can see that the DXY Index reacted well to the Resistances and started to decline.
The Resistances for the DXY Index include:
Resistance zone($98.843-$98.575)
Monthly Pivot Point
100_SMA(Daily)
In terms of Elliott Wave theory , it seems that this increase in the DXY Index over the last two days has been in the form of corrective waves . The structure of the corrective waves is Zigzag Correction(ABC/5-3-5). By breaking the Support lines , we can confirm the end of the corrective waves .
Also, we can see the Regular Divergence(RD-) between Consecutive Peaks .
I expect the DXY Index to decline to at least the Support zone($97.989-$97.834) AFTER breaking the Support lines .
Second Target: $97.650
Third Target: $97.450
Stop Loss(SL): $99.000
Note: With the DXY Index declining, we can expect more hope for a weakening of the U.S Dollar's strength in the major Forex pairs .
Please respect each other's ideas and express them politely if you agree or disagree.
U.S. Dollar Index Analyze (DXYUSD), 1-hour time frame.
Be sure to follow the updated ideas.
Do not forget to put a Stop loss for your positions (For every position you want to open).
Please follow your strategy and updates; this is just my Idea, and I will gladly see your ideas in this post.
Please do not forget the ✅' like '✅ button 🙏😊 & Share it with your friends; thanks, and Trade safe.
DXY Weekly Update — July 14, 2025⌛ Timeframe:
.
📆 Analysis Date: July 14, 2025
.
🎯 Weekly Bias: Bearish-to-Neutral (Potential for retracement or reversal)
🔎 Market Overview:
⬇️ Persistent USD Weakness:
DXY has dropped nearly 10% YTD, marking the steepest half-year decline since 1986.
📉 Rate Cut Expectations:
Markets are pricing in a potential 75bps rate cut by the Fed in H2 2025, pushing yields and the dollar lower.
📦 Trade War Fears:
Renewed tariff risks (targeting EU, Japan, Mexico, South Korea) aren't boosting demand for USD — a signal of lost safe-haven appeal.
⚖️ Central Bank Diversification:
Global reserve managers are rotating into gold and away from USD, weakening long-term structural demand.
🌀 Sentiment & Risk Appetite:
💸 Liquidity Demand is Soft:
DXY is retesting a 4H fair value gap (97.10–97.30), suggesting potential short-term consolidation or correction.
🌍 Risk-On Mood Returns:
According to Goldman Sachs, the USD is trading more like a "risk asset" than a haven, aligning with rising equity appetite.
📉 Technical Landscape:
🟠 4H Structure:
If DXY breaks below 97.00, next support lies at 96.37, followed by 95.50–96.00.
Consolidation expected if price remains within the FVG.
🔻 Key Resistance:
97.70–98.20 zone. A break above this area could change the tone to bullish.
📌 Summary:
🔷 Fundamentals show long-term dollar weakening (rates, trade tension, reserve shifts)
🔷 Sentiment aligns with risk-on appetite and reduced USD demand
🔷 Technicals at critical level; break below 97.00 opens room for correction, break above 97.70 shifts bias bullish
.
.
.
.
🟠 Bias: Bearish to Neutral
Watch Levels: 97.00 support, 97.70–98.20 resistance
⚠️ Note: This analysis is for educational purposes only and is not financial advice. Always apply risk management.
✅ If you like this analysis, don't forget to like 👍, follow 🧠, and share your thoughts below 💬!

DXY BANK VAULT BREAK-IN: Your Dollar Index Profit Blueprint🚨 DXY BANK HEIST: Dollar Index Breakout Robbery Plan (Long Setup) 🚨
🌟 Hi! Hola! Ola! Bonjour! Hallo! Marhaba! 🌟
Attention, Market Robbers & Dollar Bandits! 🏦💰💸
Using the 🔥Thief Trading Style🔥, we’re plotting a DXY (Dollar Index) bank heist—time to go LONG and escape near the ATR danger zone. Overbought? Yes. Risky? Absolutely. But the real robbery happens when weak hands panic. Take profits fast—you’ve earned this loot! 🏆💵
📈 ENTRY: BREAKOUT OR GET LEFT BEHIND!
Wait for DXY to cross 99.300 → Then strike hard!
Buy Stop Orders: Place above Moving Average.
Buy Limit Orders: Sneak in on 15M/30M pullbacks (swing lows/highs).
Pro Tip: Set a BREAKOUT ALARM—don’t miss the heist!
🛑 STOP LOSS: DON’T GET LOCKED UP!
For Buy Stop Orders: Never set SL before breakout—amateurs get caught!
Thief’s Safe Spot: Nearest swing low (2H chart).
Rebels: Place SL wherever… but your funeral! ⚰️
🏴☠️ TARGET: 102.300 (Bank Vault Cracked!)
Scalpers: Long only! Trail your SL like a pro thief.
Swing Traders: Ride this heist for maximum payout.
💵 MARKET CONTEXT: DXY IS BULLISH (But Traps Await!)
Fundamentals: COT Reports, Fed Plays, Geopolitics.
Intermarket Sentiment: Bonds, Gold, Stocks—all connected.
Full Analysis: Check our bio0 linkks 👉🔗 (Don’t trade blind!).
⚠️ ALERT: NEWS = VOLATILITY = TRAP ZONE!
Avoid new trades during high-impact news.
Lock profits with trailing stops—greed gets you caught!
💥 SUPPORT THE HEIST (OR GET LEFT BROKE!)
Smash that Boost Button 💖→ Stronger team = bigger scores!
Steal profits daily with the Thief Trading Style. 🎯🚀
Next heist coming soon… stay ready! 🤑🐱👤🔥

DXY weekly outlookWeekly analysis for DXY: the broader bias remains bullish. I expect price to respect the stacked 3‑hour demand zones, with the lower zone likely providing the stronger reaction.
After that bounce, a short‑term bearish pullback could unfold from the 4‑hour supply zone. Although I don’t trade the dollar directly, I track DXY for its correlations with other pairs to add confluence and strengthen my setups.

DXY "Dollar Index" Market Bullish Heist Plan (Day or Swing)🌟Hi! Hola! Ola! Bonjour! Hallo! Marhaba!🌟
Dear Money Makers & Robbers, 🤑 💰💸✈️
Based on 🔥Thief Trading style technical and fundamental analysis🔥, here is our master plan to heist the DXY "Dollar Index" Market. Please adhere to the strategy I've outlined in the chart, which emphasizes long entry. Our aim is the high-risk ATR Line. Risky level, overbought market, consolidation, trend reversal, trap at the level where traders and bearish robbers are stronger. 🏆💸"Take profit and treat yourself, traders. You deserve it!💪🏆🎉
Entry 📈 : "The heist is on! Wait for the MA breakout (99.900) then make your move - Bullish profits await!"
however I advise to Place Buy stop orders above the Moving average (or) Place buy limit orders within a 15 or 30 minute timeframe most recent or swing, low or high level for Pullback entries.
📌I strongly advise you to set an "alert (Alarm)" on your chart so you can see when the breakout entry occurs.
Stop Loss 🛑: "🔊 Yo, listen up! 🗣️ If you're lookin' to get in on a buy stop order, don't even think about settin' that stop loss till after the breakout 🚀. You feel me? Now, if you're smart, you'll place that stop loss where I told you to 📍, but if you're a rebel, you can put it wherever you like 🤪 - just don't say I didn't warn you ⚠️. You're playin' with fire 🔥, and it's your risk, not mine 👊."
📍 Thief SL placed at the nearest/swing low level Using the 1H timeframe (98.900) Day / Swing trade basis.
📍 SL is based on your risk of the trade, lot size and how many multiple orders you have to take.
🏴☠️Target 🎯: 101.400 (or) Escape Before the Target
🧲Scalpers, take note 👀 : only scalp on the Long side. If you have a lot of money, you can go straight away; if not, you can join swing traders and carry out the robbery plan. Use trailing SL to safeguard your money 💰.
💰💵💸DXY "Dollar Index" Market Heist Plan (Swing/Day Trade) is currently experiencing a Bullish trend.., driven by several key factors.☝☝☝
📰🗞️Get & Read the Fundamental, Macro, COT Report, Geopolitical and News Analysis, Sentimental Outlook, Intermarket Analysis, Index-Specific Analysis, Future trend targets with Overall outlook score... go ahead to check 👉👉👉🔗🔗
⚠️Trading Alert : News Releases and Position Management 📰 🗞️ 🚫🚏
As a reminder, news releases can have a significant impact on market prices and volatility. To minimize potential losses and protect your running positions,
we recommend the following:
Avoid taking new trades during news releases
Use trailing stop-loss orders to protect your running positions and lock in profits
💖Supporting our robbery plan 💥Hit the Boost Button💥 will enable us to effortlessly make and steal money 💰💵. Boost the strength of our robbery team. Every day in this market make money with ease by using the Thief Trading Style.🏆💪🤝❤️🎉🚀
I'll see you soon with another heist plan, so stay tuned 🤑🐱👤🤗🤩

DXY Analysis & ConsiderationsOverall Trend & Context:
Long-Term Uptrend: The DXY exhibits a clear uptrend from late 2023, indicating persistent USD strength.
Key Levels:
Resistance Zone (109.50 - 110.00): This zone has proven a challenge for the DXY to break decisively. A sustained break above this level is crucial for further upside.
Support Zone (107.00 - 108.00): This zone has provided support during pullbacks.
EMAs (25, 50, 100, 200 - 4-Hour Chart): The DXY is trading above all EMAs, a bullish sign. The 25 EMA is acting as dynamic support, and a bullish crossover (25 above 50) has occurred.
Potential Scenarios & Probabilities:
Bullish Breakout (High Probability) : The bullish EMA alignment favor an upside breakout above 110.00. Increased volume would confirm this scenario.
Pullback to Support/EMAs (Medium Probability) : A pullback towards the support line or the 25 EMA (around 108.80 - 109.00) is plausible, especially given the overbought RSI. This could offer a good long entry opportunity.
Breakdown Below Support (Low - Medium Probability) : A break below the support line and the EMAs would weaken the bullish outlook and could lead to a deeper correction.
Trading Considerations:
xxxUSD pairs - If the dollar goes up we should look for short positions.
USDxxx pairs - If Dollar goes up we can look for long positions.
A pullback to the support zones or the 25 EMA could offer a lower-risk long entry, provided these levels hold and there is sufficient demand on the USDxxx pair you're trading. (technicals should always be prioritized)
Consider placing stop-loss orders below key support/demand levels to manage risk.
Look for increased volume during breakouts or bounces off support to strengthen signals.
Watch for bearish divergence on the RSI as a potential bearish warning sign on the DXY.
Geopolitical Factors:
De-dollarization Efforts: Some countries are exploring alternatives to the US dollar for trade and reserves. While this is a long-term trend, any significant announcements or actions could impact the dollar's value.
Sanctions and Trade Policies: US sanctions and trade policies can influence the dollar's strength, particularly against the currencies of targeted countries. The US imposed tariffs are creating ripples right now.
Let's quickly look at what 'tariffs' are -
By now you should all know about the US imposed tariffs on several major trading partners including China, Canada and Mexico (and that they've retaliated with their own tariffs on US goods).
What does this all mean?
In the US any goods that are imported from Canada for example, will now cost more to the general public. To put it simply, the US is now charging a "handlers fee" and that will increase the overall price.
These tariffs are intended to encourage these countries to change their trade practices.
The tariffs have disrupted global supply chains, increased costs for businesses, and created uncertainty.
Make no mistake, this is without a doubt, a trade war.
Potential Impacts on the US Dollar:
Positive Impact:
Safe-haven demand: Increased global economic uncertainty due to the trade war could drive investors towards the US dollar as a safe-haven asset, increasing demand and its value. People will flock to the take no s#it protocols implemented by the Trump administration.
Reduced imports: If tariffs lead to a significant decrease in US imports, there could be less demand for foreign currencies to purchase those imports, indirectly increasing demand for USD. This means that trade conducted by the US will increase the overall Dollar output - thus making it seem more valuable. (If we assume the Trump administration is playing petty games, we're badly misinformed, we should assume that these are well calculated risks)
Negative Impact:
Reduced US exports: Tariffs can make US goods less competitive, leading to a decrease in exports. This can reduce foreign demand for USD, as fewer foreign buyers need dollars to purchase US goods.
Economic slowdown: The trade war could negatively impact economic growth in the US and globally. A slowdown in the US economy could make the dollar less attractive to investors.
Retaliatory tariffs: If other countries retaliate with their own tariffs on US goods, it can further dampen US exports and reduce demand for the dollar.
Trade Wars and Uncertainty:
The uncertainty and potential for escalation associated with trade wars can negatively impact investor confidence and lead to a flight to safety. While the USD is often seen as a safe haven, extreme uncertainty could lead investors to seek other safe-haven assets or reduce their overall exposure to USD (Right now Gold is something you should be looking into as a trader and investor).
Final Notes:
The technical picture is strong and does favour a breakout. But the geopolitical risks reduce the probability. Be prepared for fundamentals to override technicals in the short term.
Given the heightened risks, traders should be cautious and wait for clear confirmation signals before taking positions.
Closely follow news related to the debt ceiling, economic data, and geopolitical events.
Disclaimer: This analysis is for informational purposes only and does not constitute financial advice. Trading involves substantial risk and may not be suitable for all investors. Conduct your own research and consult with a financial advisor before making any investment decisions.

Dollar DXY - Bullish ContinuationDollar Index / DXY Analysis :
-
Fridays NFP event dropped price and finished this week with signs of reversal to the upside.
Following price action we see a nice 4Hour Break Of Structure, indicating buying pressure.
This following week we will look for any retracements (Higher Low) to come back into our impulsive NFP candle (point of interest) and look for confirmations to take it higher and close above previous high.

DXY Shorts from the daily supply at 104.200 back down.The dollar has broken significant structure to the downside, leaving a clean, unmitigated daily supply zone with an imbalance that adds validity to this point of interest. Once price reaches this level, I'll likely refine the zone and wait for a CHOCH on the lower timeframe.
If price moves down first, I’ll watch for it to enter the newly created 3-hour demand zone, which swept previous higher-timeframe structure. This could propel the dollar up to the supply zone.
Confluences for DXY Shorts:
Strong bearish momentum on the higher timeframe, breaking previous structure.
Significant liquidity to the downside.
A solid daily supply zone caused this move, with an imbalance below.
This pro-trend trade aligns with my other pairs.
P.S. I expect Monday to start slow, with consolidation before either zone is mitigated. We'll make our move from there.

DXY Index is Ready to Pump by 🌄Morning Candlestick Pattern🌄🏃♂️DXY Index is moving near the 🟢 Support zone($104.27-$103.90) 🟢, and 200_SMA(Daily) and 100_SMA(Daily) , and the lower line of the ascending channel .
💡Also, the Morning Candlestick Pattern is clearly visible.
🌊According to the theory of Elliott waves , it seems that the DXY Index has completed the Double Three Correction(WXY) in the support zone .
🔔I expect the DXY Index to rise to at least the Resistance line .
U.S.Dollar Currency Index ( DXYUSD ) Analyze, 4-hour time frame⏰.
Do not forget to put Stop loss for your positions (For every position you want to open).
Please follow your strategy; this is just my Idea, and I will gladly see your ideas in this post.
Please do not forget the ✅' like '✅ button 🙏😊 & Share it with your friends; thanks, and Trade safe.

DXY Index is Ready to Fill GAP🚀🏃♂️The DXY index is moving in the Ascending Channel and seems to have broken the 🔴 Heavy Resistance zone($105.88-$104.65) 🔴, and is currently moving in a small Descending Channel and making a pullback to this zone.
🌊According to the theory of Elliott waves , it seems that the DXY index has succeeded in completing the Zigzag correction(ABC/5-3-5) inside the descending channel .
💡Also, we can see Regular Divergence(RD+) between two Consecutive Valleys .
🔔I expect the DXY index to Gp UP to at least the 🔵 GAP($106.613-$106.504) 🔵after breaking the upper line of the descending channel .
❗️⚠️Note⚠️❗️: If the DXY index can break the lower line of the descending channel, we can expect the DXY index to drop more.
U.S.Dollar Currency Index ( DXYUSD ) Analyze, 4-hour time frame⏰.
Do not forget to put Stop loss for your positions (For every position you want to open).
Please follow your strategy; this is just my Idea, and I will gladly see your ideas in this post.
Please do not forget the ✅' like '✅ button 🙏😊 & Share it with your friends; thanks, and Trade safe.

🚨DXY Index Is Ready to Go Down by H&S Pattern🚨🏃♂️ DXY index is moving near 🔴 Heavy Resistance zone($105.88-$104.65) 🔴.
📈In terms of Classical Technical Analysis , the DXY index has succeeded in forming an Ascending Broadening Wedge Pattern and is currently completing the right shoulder of the Head and Shoulders Pattern .
💡Also, the Regular Divergence (RD-) between the right and left shoulders of the H&S Pattern is clearly visible.
🔔I expect the DXY index to continue its decline after breaking the 🟢 Support zone($104.26-$103.88) 🟢 around $103 .
U.S.Dollar Currency Index ( DXYUSD ) Analyze, 4-hour time frame⏰.
Do not forget to put Stop loss for your positions (For every position you want to open).
Please follow your strategy; this is just my Idea, and I will gladly see your ideas in this post.
Please do not forget the ✅' like '✅ button 🙏😊 & Share it with your friends; thanks, and Trade safe.

DXY Index Is Ready to Go Up🚀✅The DXY index has succeeded in breaking the 🔴 Resistance zone($104.27-$103.80) 🔴.
📈From the point of view of Classical Technical Analysis , DXY seems to have succeeded in forming an Ascending Broadening Wedge Pattern . Of course, we must wait for the reaction to the upper line of this pattern .
🔔I expect the DXY index to rise to at least 🟡 Potential Reversal Zone(PRZ) 🟡.
U.S.Dollar Currency Index ( DXYUSD ) Analyze, 4-hour time frame⏰.
Do not forget to put Stop loss for your positions (For every position you want to open).
Please follow your strategy; this is just my Idea, and I will gladly see your ideas in this post.
Please do not forget the ✅' like '✅ button 🙏😊 & Share it with your friends; thanks, and Trade safe.

DXY Index Can Go Up by Classical Technical Analysis Pattern🚀🏃♂️The DXY Index is moving in the 🟢 Support zone($102.87-$102.43) 🟢.
📈 Regarding Classical Technical Analysis , the dollar index has successfully formed an Inverse Head and Shoulders pattern .
🌊According to the theory of Elliott waves , the dollar index has completed a Zigzag correction(ABC/5-3-5) in the 🟢 Support zone($102.87-$102.43) 🟢.
🔔I expect the DXY Index to rise to at least the 61.8% Fibonacci level and Resistance lines .
U.S.Dollar Currency Index ( DXYUSD ) Analyze, 1-hour time frame⏰.
Do not forget to put Stop loss for your positions (For every position you want to open).
Please follow your strategy; this is just my Idea, and I will gladly see your ideas in this post.
Please do not forget the ✅' like '✅ button 🙏😊 & Share it with your friends; thanks, and Trade safe.

DXY Index will Go Down to next Support zone✅ DXY Index has succeeded in completing a Rising Wedge Pattern near the 🔴 Resistance zone($105.90-$104.64) 🔴.
🔨DXY also managed to break the lower line of the Rising Wedge Pattern and is currently breaking the 🟢 Support zone($104.30-$103.89) 🟢.
💡Also, we can see Regular Divergence(RD-) between two Consecutive Peaks .
🔔After breaking the 🟢 Support zone($104.30-$103.89) 🟢, I expect the DXY index to continue declining until the next 🟢Support zone($102.86-$102.420)🟢 .
U.S.Dollar Currency Index ( DXYUSD ) Analyze, 4-hour time frame⏰.
Do not forget to put Stop loss for your positions (For every position you want to open).
Please follow your strategy; this is just my Idea, and I will gladly see your ideas in this post.
Please do not forget the ✅' like '✅ button 🙏😊 & Share it with your friends; thanks, and Trade safe.

💹 U.S. DOLLAR INDEX next week prevision 💹In the dollar we can see that it has to continue its downward trend at least until it reaches areas between 99,700 and 98,490 minimum to end with the 5 of the Elliot wave since it has not reached 100% of the fibonachi extension of the last reverse wave. It is making a brief correction before going down again to break SL's and go down again as we observe a strong accumulation in the area where it closed last week. As soon as it has touched the 100%-127% zone, the bullish trend will continue since it has to go to areas of 108,200 minimum. In summary go short options in the short term and when you have touched the 100 level great opportunities to go long.

🗺️DXY Index Roadmap🗺️🏃♂️The DXY index has been moving in the Descending Channel for over two months .
🌊According to Elliott's wave theory , the DXY Index is near the end of the main wave 5 .
🌊If we want to look at the microwaves of the main wave 5 in the 1-hour time frame , we will find that the DXY index is on the way to completing the microwave 5 of the main wave 5 .
💡Also, we can see Regular Divergence(RD+) between two Consecutive Valleys .
🔔I expect the DXY Index to start rising after touching the 🟢 Support zone($101.30-$100.80) 🟢, Support lines , and 🟡 Price Reversal Zone(PRZ) 🟡 and complete the main wave 5. The increase of the DXY index can fill the upper 🔵 GAP 🔵 and attack the upper line of the descending channel.
U.S.Dollar Currency Index ( DXYUSD ) Analyze, 1-hour time frame⏰.
Do not forget to put Stop loss for your positions (For every position you want to open).
Please follow your strategy; this is just my Idea, and I will gladly see your ideas in this post.
Please do not forget the ✅' like '✅ button 🙏😊 & Share it with your friends; thanks, and Trade safe.

DXY Index is Ready to Break the 🔴Resistance zones🔴✅It seems that the DXY Index finally managed to break the Descending Channel that it was in for more than one month .
💡I expect the DXY Index to take the help of the Uptrend line to break the Resistance zone ahead and it can break the minimum 🔴 Resistance zone($104.20-$103.98) 🔴.
U.S.Dollar Currency Index ( DXYUSD ) Analyze, 4-hour time frame⏰.
Do not forget to put Stop loss for your positions (For every position you want to open).
Please follow your strategy; this is just my Idea, and I will gladly see your ideas in this post.
Please do not forget the ✅' like '✅ button 🙏😊 & Share it with your friends; thanks, and Trade safe.
